A DECISION STRATEGY FOR THE USE OF A GEOGRAPHIC INFORMATION SYSTEM FOR METROPOLITAN TRANSPORTATION PLANNING.
by
DAVID BARTHOLOMEW KAATRUD M.I.A., Columbia University (1984)
B.A., Carleton College (1981)
Submitted to the Department of Urban Studies and Planning in Partial Fulfillment of
the Requirements of the Degree of Master of City Planning in Developing Areas
at the
Massachusetts Institute of Technology 20 September, 1989
David B. Kaatrud.
@
All Rights Reserved.The author hereby grants MIT permission to reproduce and to distribute copies of this thesis document in whole or in part.
Signature of Author__
Certified by
Accepted b the
art nt rn Stud Se~4mber 20, 1989r and Planning
Ralph Ae akenheimer
of an Planning and Civil Engineering
~7We Supervisor
AkldA.
SchonProfessor, Urban Studies and Planning Chairman, MCP Committee
SEP 2 91
TABLE OF CONTENTS Page TABLE OF CONTENTS. 2 LIST OF FIGURES. 4 ABSTRACT. 5 ACKNOWLEDGEMENTS. 6 LIST OF ACRONYMS. 7 CHAPTER 1: INTRODUCTION. 9 1.1 General Overview.
1.2 GIS and Transportation Planning.
1.3 The Metropolitan Planning Organization (MPO). 1.4 The Promise of a GIS-T.
1.5 Methodology.
CHAPTER II: A DECISON STRATEGY FOR THE ACQUISITION
OF A GIS-T. 29
2.1 Introduction.
2.2 Institutional and Organizational Assessment. 2.3 The Analytical Needs of an MPO.
2.4 The Data Needs of an MPO.
2.5 The Preliminary Design of a GIS-T.
CHAPTER III: THE STRATEGIC IMPLEMENTATION PLAN:
INSTITUTIONAL ISSUES. 42
3.1 Introduction.
3.2 Establishing a Foundation.
3.3 Fitting a GIS-T Into The Existing Organizational Structure. 3.4 Personnel Issues.
3.5 Inter-agency Linkages.
CHAPTER IV: THE STRATEGIC IMPLEMENTATION PLAN:
TECHNICAL ISSUES. 58
4.1 Introduction.
4.2 Database Design Issues. 4.3 Data Capture Issues.
4.4 Data Management and Maintenance Issues. 4.5 Hardware and Software Issues.
4.6 Data Analysis Issues.
CHAPTER V: THE DESIGN OF A STRATEGIC
IMPLEMENTATION PLAN FOR A GIS-T. 81 5.1 Introduction.
5.2 Pilot Project.
5.3 Phasing-in a GIS-T Project.
5.4 Towards a Cost-Benefits Analysis.
CHAPTER VI: CONCLUSION. 99
BIBLIOGRAPHY. 105
APPENDICES:
Appendix I: Basic GIS Concepts. 112
LIST OF FIGURES: Figure Figure Figure Figure 1.1: 1.2: 1.3: 1.4: Figure 3.1: Figure 3.2: Figure Figure Figure Figure Figure Figure Figure Figure Figure Figure 4.1: 4.2: 4.3: 1.1: 1.2: 1.3: 1.4: 1.5: 11.1: 11.2:
The Urban Transportation Planning Process. An MPO's Inter-agency Relations.
The Role of GIS in Transportation Planning. A Decision Strategy For The Use of a GIS-T
Byan MPO.
The Interaction Between the GIS-T Coordination and External Actors.
Possible GIS-T Coordination Group Organizational Structure.
GIS Application and Level of Detail: Urban.
GIS-LUTS: Possible Developmental Configurations.
Transportation Models and GIS-T Coupling. Spatial Objects of a GIS.
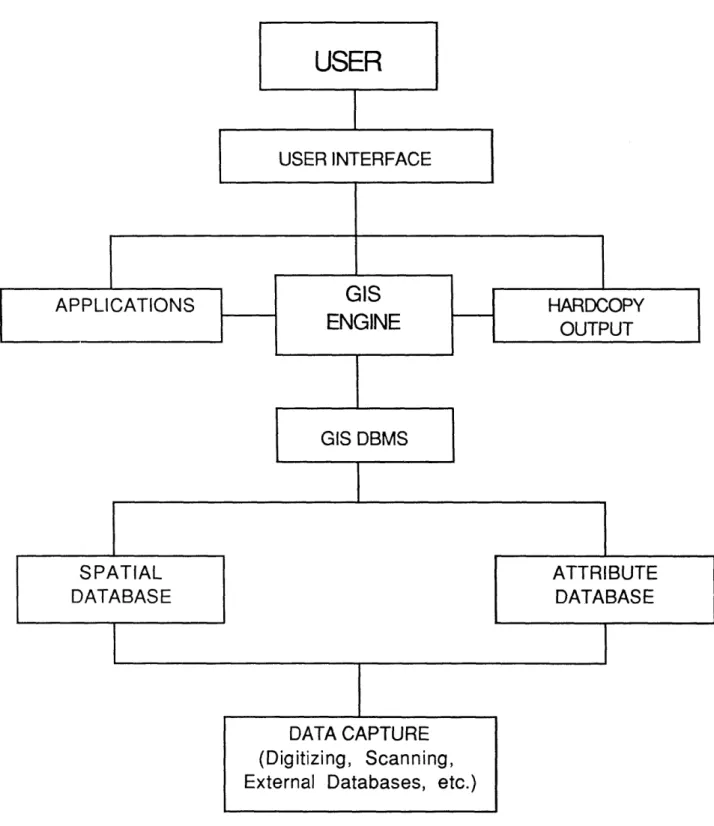
GIS Components.
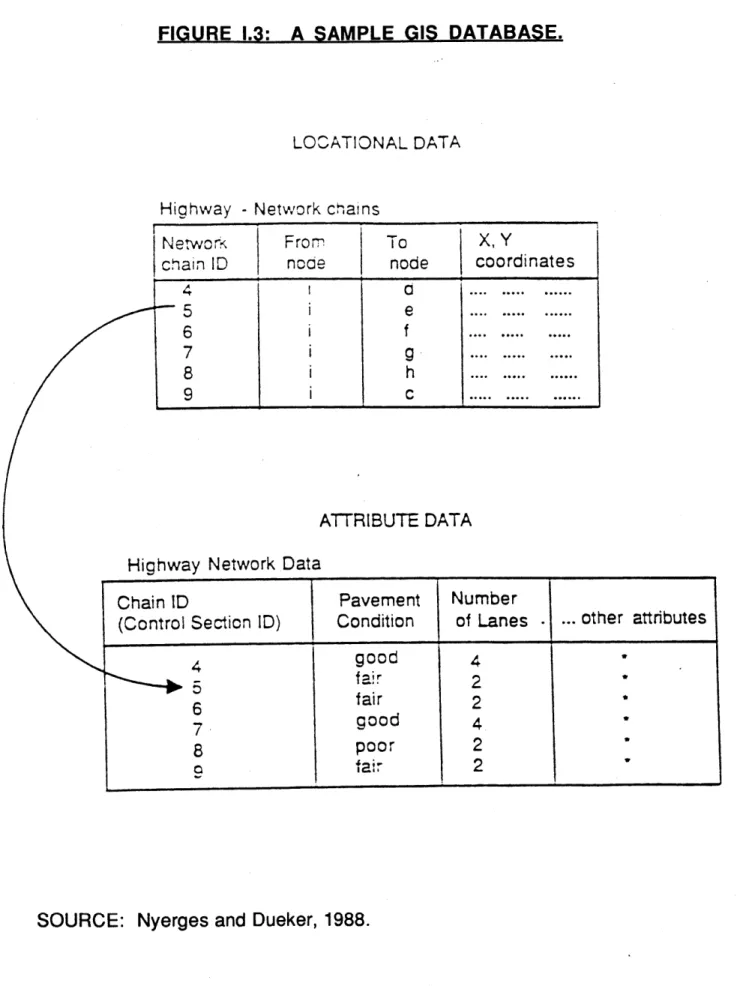
A Sample GIS Database.
An Example of Data Layering. TIGER Geographical Boundaries.
The Travel Demand Forecasting Process. Simplified LUTS/UTPS Process.
Page 15 19 21 27 Group 45 48 61 77 78 113 115 116 118 123 130 132
A DECISION STRATEGY FOR THE USE OF A GEOGRAPHIC INFORMATION SYSTEM FOR METROPOLITAN TRANSPORTATION PLANNING.
by
DAVID BARTHOLOMEW KAATRUD
Submitted to the Department of Urban Studies and Planning on September 20, 1989 in Partial Fulfillment of
the Requirements of the Degree of Master of City Planning in Developing Areas
ABSTRACT
The thesis reviews the acquisition and use of a Geographical Information System (GIS) for transportation planning (GIS-T) by Metropolitan Planning Organizations (MPO), the agencies responsible for transportation planning in urbanized areas. Due to the diversity among MPO's and the short history of GIS use in Transportation, the discussion is general and conceptual. The thesis describes the major issues in the steps of the appraisal process: an overall institutional and organizational assessment; the identification of future analytical and data needs; and the organizational and
technical issues associated with the implementation of a GIS-T. Recognizing that the GIS-T implementation occurs in a series of stages over an extended period of time, it is argued that the
acquisition of a GIS-T is not so much a single decision problem, as a strategy to deal with a continuing process. Reference materials covering the basic concepts of transportation modelling and GIS are provided in the thesis appendices.
Thesis Supervisor: Ralph Gakenheimer
ACKNOWLEDGEMENTS.
I wish to thank my advisor Professor Ralph Gakenheimer for
constructive comment and for being so flexible with my comings and goings during my final months at DUSP. Thanks also goes out to Professor Joseph Ferreira for giving direction to this endeavor as well as valuable input. I am grateful to Simon Lewis for providing fruitful discussion and debate, and tireless comment on each draft. Thanks to Liz Gotterer for helping me clean up drafts. Thanks is also due to: the MPO officials who took time out of busy schedules to speak with me; the Caliper Corporation; and CTPS. Finally, I am grateful to my family and friends for being so supportive throughout the thesis process.
LIST OF ACRONYMS: AASHTO ADT AM/FM ARC/INFO CAC CADD CBD 3C
00G
CRL CTPP CTPS DBA DBMS DLG DOT DP DPW DRAM EAC EIS EMPAL ESRI FAUS FHWA FIPS GBF/DIME GIS GIS-T GPS GRIDS HCM HW IS ITE ITLUPAssociation of American State Highway Transportation Officials.
Average Daily Traffic.
Automated Mapping and Facilities Management. A GIS software package made by ESRI.
Computer-Aided Cartography.
Computer-Aided Drafting and Design. Central Business District.
Continuing, Cooperative, and Comprehensive Planning. Council of Governments.
Computer Resource Laboratory at MIT. Census Transportation Planning Package. Central Transportation Planning Staff. Database Administration.
Database Management System. Digital Line Graph.
Department of Transportation. Data Processing.
Department of Public Works.
Dynamic Residential Allocation Model. Economic Activity Centers.
Environmental Impact Statement Employment Allocation Model.
Environmental Systems Research Institute. Federal Aid to Urban Systems.
Federal Highway Administration.
Federal Information Processing Standard.
Geographical Base File/ Dual Independent Map Encoding. Geographic Information System.
Geographic Information System for Transportation. Global Positioning System.
Geographic Roadway Information Display System. Highway Capacity Manual.
Hardware.
Information System.
Institute of Traffic Engineers.
LAN LIS LOS LUTS MB MINUTP MIS MPO MTP NCGIA NCHRP NDCDB O/D ORNL PC PMS; PSCOG RDBM SCAG SMSA STF SW TAZ TDM TIGER TIP TP TransCAD TSM UMTA UPWP URISA USGS UTM UTPP UTPS; V/C
Local Area Network. Land Information System.
Level of Service.
Land Use and Transportation Systems. Megabyte.
Micro-computer-based travel demand software package. Management Information System.
Metropolitan Planning Organization. Metropolitan Transportation Planning.
National Center for Geographic Information and Analysis.
National Cooperative for Highway Research Program. National Digital Cartographic Database.
Origin Destination.
Oak Ridge National Laboratories. Personal Computer.
Pavement Management System.
Puget Sound Council of Governments. Relational Database Management System. Southern California Council of Governments.
Standard Metropolitan Statistical Area. Summary Table File.
Software.
Traffic Analysis Zones. Travel Demand Model.
Topologically Integrated Geographic Encoding and Referencing.
Transportation Improvement Plan. Transportation Planning.
A GIS Transportation Planning software package. Transportation Systems Management.
The Urban Mass Transportation Administration. Unified Public Work Program.
Urban and Regional Information System Association. United States Geological Survey.
Universal Transverse Mercator.
Urban Transportation Planning Package. Urban Transportation Planning System. Volume Capacity Ratio.
CHAPTER 1: INTRODUCTION.
1.1 General Overview.
Geographical Information Systems (GIS) may be simply defined as computerized tools to capture, store, retrieve, manipulate, and display spatial data. The impact of GIS's is being felt in many fields, and transportation planning is no exception. In the
transportation field, State and Federal agencies have taken the lead, whereas at the local or metropolitan level, agencies are only
beginning to contemplate the possible application of GIS technology.
Recognizing that the decision to acquire such a system is a complex and important one, this thesis proposes to look at the strategies for assessing the introduction of a GIS for transportation planning (GIS-T) in Metropolitan Planning Organizations (MPO's), the agencies
responsible for Metropolitan Transportation Planning (MTP) in urbanized areas. To date, the introduction of a GIS into public agencies appears to have been mostly of an "ad hoc" nature (Croswell, 1989; Brown, 1989). However, GIS-T demands a
structured assessment in which issues are addressed systematically and implementation objectives are clearly defined. This document represents a preliminary attempt to understand the issues
associated with GIS-T implementation and structure the assessment process.
The acquisition of a GIS-T is viewed not a clear-cut decision problem, but rather as an developmental process. GIS-T
implementation occurs in stages and possibly over a period of years; staff must be trained and data must be made operational in a GIS-T context. Much of the implementation process involves learning from doing. Furthermore, the developmental nature of GIS-T
implementation is reflective of the rapid change which characterizes computer and GIS technology.
1.2 GIS and Transportation Planning.
GIS's are, in essence, spatial database managers which facilitate the analysis of geographical information (A discussion of the basic GIS concepts is found in Appendix I). A GIS is more than database
management, it is a method; more than just a tool for graphic display, a GIS conveys spatial information; and more than just an application, a GIS represents an analytical environment (Fletcher, 1989). By making use of spatial relational data, a GIS may be seen as a new approach to viewing data; that is, an approach with a spatial perspective (Nyerges and Dueker, 1988).
GIS's have been around in some form since the 1960's but, until the 1980's, existed only in the mainframe environment and were not widely available. Only recently, have these systems been made
available for mini- and micro-computers. Concurrent advances have been made in spatial data collection techniques (see Appendix 1.4). Initial use of GIS's was in the areas of natural resource and land
information systems (LIS) but applications of GIS are now occurring in a wide variety of fields. The software, hardware, and data
gathering improvements have spurred on the proliferation of GIS's among private and public organizations.
The application of GIS technology to transportation planning (GIS-T) is a recent phenomenon. Much of the GIS activity in transportation to date has occurred at the federal or state level; the first
applications were in database management areas such as highway inventory, accident analysis, and pavement management. GIS's have proven useful for the creation of integrated highway information systems, the correction of discrepancies in existing state
databases, and improved data access (Florida DOT, 1989). There are a variety of on-going GIS initiatives at the state level including: efforts at standardizing spatial data formats in North Carolina,
moves towards data integration in Pennsylvania (AASHTO, 1989), uses of optical storage devices in Wisconsin (Fletcher, 1987) and others (Nyerges and Dueker, 1988; Simkowitz, 1989a; and AASHTO, 1988). At the Federal level, the interstate highway system has been geo-coded in a database known as Geographic Roadway Information Display System (GRIDS) (Simkowitz, 1989a).
At both the federal and state level, GIS activities deal primarily with spatial data capture, geo-referencing issues, and highway inventory systems. However, almost no work has been done on network modelling (basic transportation modelling principles are discussed in Appendix 11.1). Network functionality, such as shortest
path, is increasingly becoming a feature of GIS software packages (Lupien, et. al., 1987). The first applications of GIS for travel demand modelling (TDM) are now being explored. These activities involve the interface of GIS with traditional transportation
modelling software packages. The full integration of TDM
capabilities within a GIS is also being developed in the TransCAD software package, which combines some GIS functionality with transportation planning algorithms. At the local level, GIS applications for transportation planning are of an experimental
nature and involve using GIS to manage data for input into activity allocation and transportation models and for the manipulation and display of model output (Kiel and Bridwell, 1989).
The design of a generic approach to GIS-T is still very much at the research stage. Examples of on-going research on the topic include: state DOT efforts in North Carolina, Wisconsin, etc (Fletcher and Lewis, 1989); research on the NETWORK module of the ARC/INFO GIS software package at the Environmental Systems Research Institute (ESRI); the TransCAD software by the Caliper Corporation
(Simkowitz, 1989a); research sponsored by the National Cooperative Highway Research Program (NCHRP); and FHWA-sponsored research in Johnson City, Tennessee (Kiel and Bridwell, 1989). Since a generic GIS-T is not yet a reality, the term GIS-T is used in the discussion to denote the use of existing GIS technology for transportation planning.
1.3 The Metropolitan Planning Organization (MPO).
The practice of MTP dates back to the pivotal Federal Aid Highway Act of 1962 which mandated that urban transportation planning be "continuing, cooperative, and comprehensive" (the 3C" process). "Continuing" because the process is done on an annual basis;
"cooperative" because the process is carried-out jointly by state and local agencies; and "comprehensive" because the planning process is at the metropolitan scale and includes land-use and public transit elements.
MPO's were formed with the Intergovernmental Cooperation Act of 1968. This legislation established a body responsible for the "3C" process at the metropolitan level in urbanized areas of over 50,000. In 1975, the Joint Federal Highway Administration (FHWA) and the Urban Mass Transportation Administration (UMTA) regulations
further defined the role of the MPO for MTP to include both highway and transit planning activities. The intergovernmental relations in transportation planning were re-defined in the Reagan era. Under this arrangement, while the federal requirements of MTP agencies persisted, the states were allowed to define the process as long as it met the broad "3C" criteria. The new arrangement represented a shift away from a very centralized transportation planning structure in the U.S. and placed the burden of MTP on local level agencies
State discretion in defining the MTP process has resulted in
diversity among MPO's. In some regions, such as Minneapolis or San Francisco, the MPO is an independent agency responsible solely for MTP. In other metropolitan regions, such as Seattle and Los Angeles, the local Council of Governments (COG) acts as the MPO, taking on activities such as comprehensive planning, zoning and land-use studies, environmental studies, and Census file updates, in addition to transportation planning responsibilities. A slightly more
complicated arrangement is found in cities like Chicago and Boston, where the MPO is actually a constellation of agencies, each
responsible for a segment of the MTP process. These diverse
institutional arrangements mean that financial arrangements vary across regions. Funding for MPO's usually comes from local and state sources. though for specific projects, federal funding is included.
MPO's also have differing organizational structures. This diversity is a function of differences in local government environment, the local transportation planning process, and the relative strength of other local agencies. These differences are also accentuated by the fact that the structure of the MTP process is determined at the state, not federal, level (Weiner, 1987).
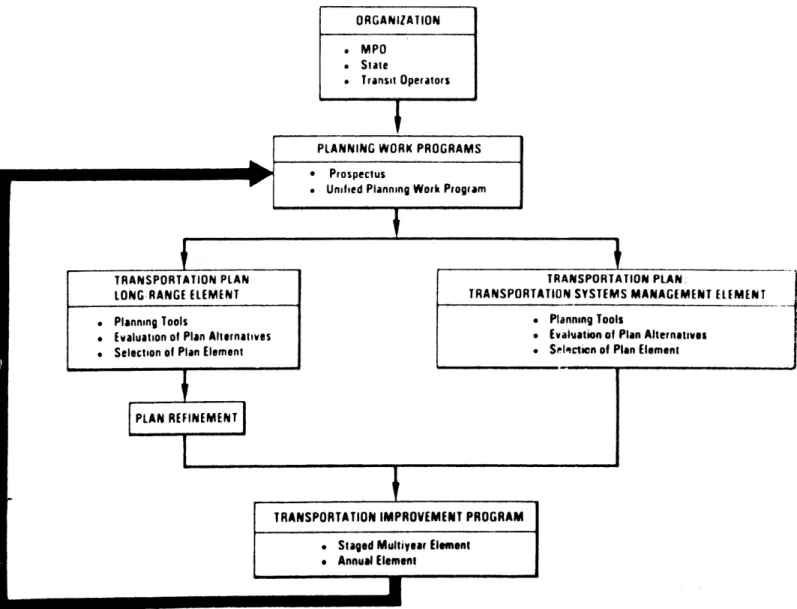
Although diverse, MPO's do adhere to the same federal requirements which is depicted in Figure 1.1. Thus, all MPO's are responsible for:
FIGURE 1.1: THE URBAN TRANSPORTATION PLANNING PROCESS. ORGANIZATION
* MPO . State
. Transit Operators
PLANNING WORK PROGRAMS
FI
TRANSPORTATION PLAN LONG-RANGE ELEMENT
. Planning Tools
. Evaluation of Plan Alternatives
. Selection of Plan Element
PLAN REFINEMENT
" Prospectus
. Unified Planning Work Program
TRANSPORTATION IMPROVEMENT PROGRAM
. Staged Multiyear Element
. Annual Element
SOURCE: Weiner, 1987.
TRANSPORTATION PLAN:
TRANSPORTATION SYSTEMS MANAGEMENT ELEMENT
e Planning Tools
e Evaluation of Plan Alternatives
2. The annual production of the Unified Planning Work
Program (UPWP), a federally required certification document describing FHWA and UMTA funded transportation planning projects anticipated over the subsequent one year period.
3. The annual production of the Transportation Improvement Plans (TIP's). The TIP represents a link between planning and programming since it includes all highway and transit projects to be implemented in the subsequent five-year period. The TIP has a short-range Transportation System Management
(TSM) component and a long-range component as shown in Figure 1.1.
4. Overseeing the Federal Aid to Urban Systems (FAUS) funds, federal funds for local transportation improvements.
Further duties of an MPO, not federally prescribed, include:
1. The review of local level (city and county) transportation projects and plans. The provision of technical assistance to local level governments and agencies in areas of
transportation planning and management.
2. Various state-defined duties such as overseeing state capital investment funds for local transportation projects.
3. While management of the local highway system is usually the concern of the local DPW, MPO's may get involved in the promotion of policies, such as PMS at the local level, as is the case in Boston (Baumstein interview, 1989), and Detroit
(Nwankwo and Blackmore, 1989).
MPO's use travel demand forecasting (Appendix 11.1) to formulate metropolitan transportation plans. Transportation modelling grew out attempts in the 1950's and 1960's to assess the interaction between land use and transportation demand. The models used in the transportation planning process include The Urban Transportation
Planning System (UTPS), which became a mainstay for MTP in the 1960's and 1970's. Most large MPO's have been using transportation models on mainframe computers since the 1970's. However, the datasets upon which transportation models rely are aging and are, in many instances, outdated (Atkins, 1987; Supernak, 1983).
External events have affected MTP since the late 1960's. The
Environmental Policy Act of 1969 reflected an increased concern on the part of the general public for the environmental impacts of transportation developments. In addition, the advent of increased opposition to new highway construction in the early 1970's has
politicized transportation planning and increased the need for constant interaction with the general public (Weiner, 1987;
Gakenheimer, 1989). No longer are transportation and other planning functions "esoteric activities of a few technicians". Increasingly,
there is a need to sell policies to the public, leading to demands on the MPO for report generation, presentations, and graphic depiction.
With public disillusionment with new highway construction and increasing importance of environmental concerns in the early
1970's, the activities of the MPO had shifted from a comprehensive or macro approach, to a more micro-level scope (Cook, et. al.,
1989b). This shift placed emphasis on corridor and traffic impact analysis, short-term planning activities, and small-area
improvements. Transportation Systems Management (TSM) came into vogue at this time and represented an orientation away from new highway construction and towards more intensive utilization of existing facilities (Gakenheimer, 1979). This development was re-enforced with the near completion of the interstate highway system and the increasing fiscal difficulties experienced by public agencies at all levels in the 1980's (Weiner, 1987). Currently, most MPO's carry out their planning activities at both the macro and
micro-levels; formulating comprehensive transportation plans and doing corridor analysis as well as impact and intersection analysis.
As depicted in Figure 1.2, MPO's function at the local and
metropolitan levels and interact with a variety of actors in the transportation planning process. The configuration of an MPO's external relations varies according to region. Generally, however, the relations consist of work with federal and state agencies on large-scale issues, and the provision of transportation project reviews technical assistance for local governments and
FIGURE 1.2: AN MPO's INTER-AGENCY RELATIONS. LOCAL DPW I 4 FEDERAL AGENCIES (FHWA, UMTA)
transportation agencies. MPO's work closely with local transit agencies and agencies responsible for the maintenance of the local
highway network, such as the local DPW. Relations with private contractors and consultants usually occur on an ad hoc basis.
Relations with the general public are usually filtered through the local governments which, as is the case in Boston, may have representation within the MPO (Baumstein, 1989).
1.4 The Promise of a GIS-T.
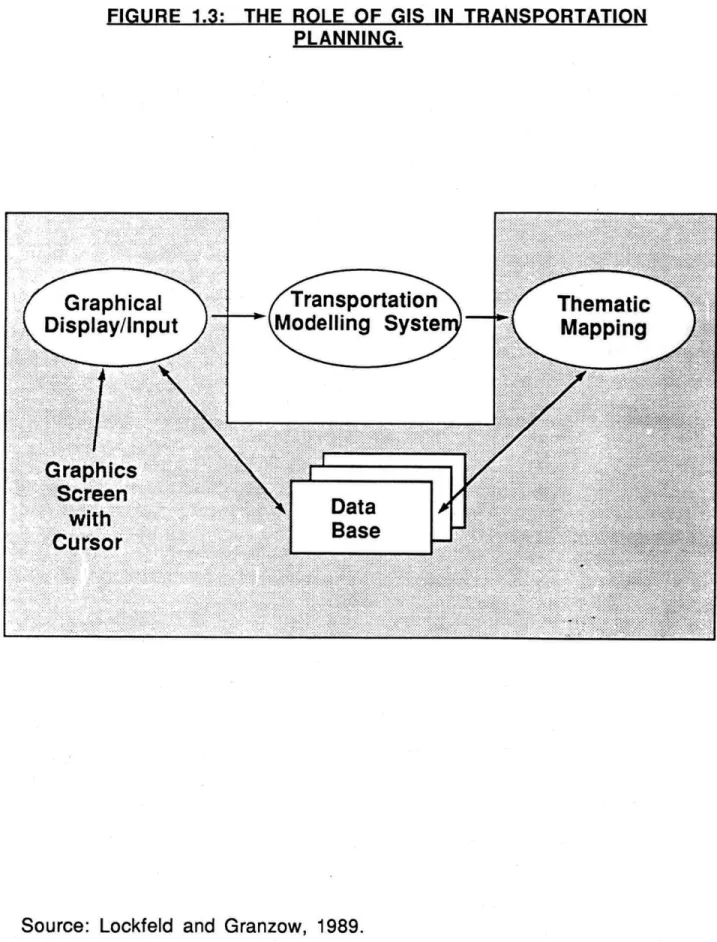
Why should an MPO consider the acquisition of a GIS for MTP? As indicated in Figure 1.3, GIS applications for transportation may be used for database management and as an enhancement for data analysis.
Data management benefits include:
1. The ability to link data geographically for data integration. A GIS-T exploits the inherent spatial nature of transportation planning data through the linkage of all data to a common
locational reference. This linkage serves to integrate different datasets and eliminate data redundancy and inconsistency.
FIGURE 1.3: THE ROLE OF GIS IN TRANSPORTATION PLANNING.
Source: Lockfeld and Granzow, 1989.
......... ... ..... .. .. . X., .. ... .. .. .. .. .. . . ... ... . .. .. . .... ... ... .. . . .... ... .... .... .1-11- .. .. ... .. - -... . .. .... .... .. . ... .... .. ... . .... .. X.,
.
..
...
Graphical Display/input IM ... ... ... .... ... .... ... ... ... ...... ... ...-G re
a 6 h i
...
...
...
..
.
.
.
..
..
..
.. ... .. ... .. ... ... . ... ... ... ... ... ... ... ... ...ursor:* .. ... ... ... .. ... . ..... . ..... .... .. .... ... ...... ... .. .. .... ....... ... .. ' W': ... ... ... .. .... .. O's .. ... ...... ....... .. ..2. The ability to retrieve information geographically. Interactive graphics afford the analyst flexibility in data access and data editing, as well as ease of comprehension.
3. Efficiencies in data preparation and data manipulation. A GIS-T affords efficiencies in the form of time and cost
savings in data preparation and manipulation (Ferguson, 1989).
4. Management of data for TDM input. GIS-T's are effective for managing and manipulating data for model input. A GIS-T
might aggregate data for input into TDM; for example,
economic model output might be aggregated into larger units, such as traffic analysis zones.
5. The possibility of accessing other data sources. By
establishing a common spatial data reference, a GIS offers the possibility of tapping into different data sources that might otherwise go unused by transportation planners, such as soil typology or hydrology data. Furthermore, a GIS may foster inter-agency data exchange which affords savings in data capture costs.
6. A GIS-T provides improvement in report and map production.
With regards to data analysis, the crucial question to be asked is: does a GIS-T enhance existing transportation modelling and
analysis? A GIS-T offers the following advantages for data analysis:
1. The ability to build more complete and accurate network models. Through disaggregation a GIS allows for more extensive use of travel behavioral data for refined spatial analysis, improving trip generation and modal choice
modelling.
2. The ability to visualize relations with thematic mapping. A GIS facilitates spatial analysis of transportation policies,
scenario testing, and the spatial comparison of alternatives. Graphic display capabilities might benefit the
decision-making process. Since graphic depiction is more intuitive than conventional data output a GIS-T might improve
communications with decision-makers and the general public. This might include: thematic mapping of model output in the form of bandwidth depiction of traffic flows.
3. The ability to do scenario testing. For example, traffic flow output from a transportation model may be overlaid on
alternative land-use growth scenarios.
4. The ability to formulate questions not previously asked. For example, noise contours to airport may be overlaid on residential data to gauge the noise impacts of airport expansion. As with any new technology, there may also be
unforeseen transportation planning applications of GIS-T technology.
The disadvantages of a GIS-T relate primarily to its expense in time and financial resources. In terms of cost, a GIS-T requires
significant hardware and software purchases, and substantial investment in the preparation and maintenance of spatially-referenced data. In terms of staff time investment, a GIS-T is usually introduced over a period of years and requires technically skilled staff.
While the promise of a GIS-T is great, few fully developed GIS-T implementations have been recorded to date. This suggests that the tasks of acquisition, implementation, and maintenance of such a system are complex and require careful attention.
1.5 Methodology.
The thesis aims to outline strategies for acquiring a GIS-T at the metropolitan level. In view of the fact that the introduction of GIS-T at the MPO level is embryonic and user history is limited, the discussion is principally at the conceptual level.
The approach is also general since the actual decision and forms of GIS-T's may vary with the diversity among MPO's. The discussion is restricted to the MTP aspects of GIS technology, although many
MPO's have land-use planning responsibilities, in addition their transportation planning responsibilities.
The intent of the study is not to identify a "best choice" of a GIS-T, but rather to seek a clearer definition of the salient issues to be addressed in a decision strategy for acquiring and implementing a
GIS for transportation planning in an MPO. The aim is only to raise questions specific to this process. Covering a topic as vast as a GIS-T in a limited format restricts the discussion to major issues at the expense of minor issues.
The research conducted for this thesis principally consisted of:
1. A survey of the small but growing body of literature on the subject.
2. Interviews with MPO officials involved in assessing the possible acquisition of a GIS.
3. Material gathered from conference and workshop attendance including: the AASHTO-sponsored Second
Applications of Transportation Planning Methods Conference held in Orlando, Florida in April, 1989 and the 27th Annual URISA Conference held in Boston, Massachusetts in August, 1989.
4. Hands-on exposure to GIS and transportation modelling software packages available at the Computer Resource
Laboratory (CRL) at MIT. One package, TransCAD made use of the same metropolitan transportation database used by the Central Transportation Planning Staff (CTPS), the technical support unit for the Boston area MPO.
The discussion proceeds along the lines found in Figure 1.4, which outlines a strategy for addressing GIS-T acquisition. Chapter I traces steps 1 through 3 in the process to the first decision point. This includes a discussion on the assessment of the present and future institutional environment and organizational goals, and future analytical and data needs.
The subsequent chapters provide a broad overview of issues
encountered in developing a strategic implementation plan for a GIS-T for an MPO (steps 5 and 6 in Figure 1.4). GIS-The division between organizational and technical issues delineates the discussions in Chapters III and IV. Chapter III looks at the organizational and
institutional issues to be dealt with in a GIS-T implementation plan. Chapter IV looks at the technical issues to be addressed in such a plan.
The general perspective of Chapters I through IV may serve to
disguise some of the real and practical difficulties of implementing a GIS-T. Therefore, some attempt is made in Chapter V to illustrate some of the implementation difficulties and provide a feel for .the time-frame involved in implementation. Examples of approaches to
FIE1.:A DECISION STRATEGY FOR TH US FAGST BY AN MPO.
1. INSTITUTIONAL/ORGANIZATIONAL ASSESSMENT.
2. ANALYTICAL AND DATA NEEDS ASSESSMENT.
3. PRELIMINARY DESIGN OF A GIS-T.
4. "GO/NO GO" DECISION: WILL GIS-T MEET NEEDS?
(Y) ) "DO NOTHING
5. IDENTIFY ORGANIZATIONAL & TECHNICAL ISSUES
6. DESIGN STRTATEGIC IMPLEMENTATION PLAN.
7. COST-BENEFIT ANALYSIS.
8. APPROVE IMPLEMENTATION PLAN.
1
9. PILOT PROJECT.
I
97 FIGURE 1.4:
pilot projects and the phasing-in of a GIS-T are included in this Chapter. Finally, the possible use of cost-benefit analysis for a GIS-T appraisal is discussed.
The author assumes the reader has some understanding of GIS and database management, and the process of transportation planning. Reference materials on the basic concepts of GIS and of
transportation modelling are provided in the accompanying appendices.
CHAPTER II: A DECISION STRATEGY FOR THE ACQUISITION OF A GIS-T.
2.1 Introduction.
The acquisition of a GIS-T is a complex decision for an MPO, since the decision must be made in an uncertain environment where both software and hardware developments are rapidly occurring. In addition, the demands of MTP and the role of an MPO are also
changing. After surveying many GIS implementation efforts in the public sector one analyst attributes the many failures to poor initial assessments (Croswell, 1989).
A GIS-T potentially affects database management strategy, the computing environment, organization structure and goals, the decision-making process, and relations with peer agencies. Any
needs assessment must therefore be broad in scope. This involves an overall assessment of the MPO and the transportation planning environment in which it operates as well as a total assessment of the MPO's analytical and data needs present, and future.
This chapter discusses steps 1 through 3 as outlined in Figure 1.4; from institutional and organizational assessment to future data analysis and future data needs. This discussion brings us to a
decision point at step 4 where the MPO must determine the viability of a GIS-T.
2.2 Institutional and Organizational Assessment.
A discussion of institutional and organizational issues requires a look at the MTP context and its future trends. The environment MPO's face in the near future is likely be one of: continued fiscal austerity, increased importance of inter-agency relations, and continued environmental concerns (Weiner, 1987; Gakenheimer, 1989).
Fiscal constraints at all levels of government are likely to persist forcing MPO's and local governments to do more with the same resources or less (Weiner, 1989). This situation typically
translates into policies geared less towards new construction and more towards intensive use of existing transportation facilities. Fiscal restraint may also stimulate interest in information systems (IS). that help improve the cost-effectiveness of transportation planning. In this context, the possible economies of scale of shared data among agencies with similar data needs are an attractive
benefit. However, these economies of scale are realized in the long-term only after significant capital investment in acquiring the
necessary hardware and software and constructing spatially-referenced databases to make data exchange possible.
Traditionally, MTP has been a "top-down" process, but in the future MPO's may receive more pressure from below. The accessibility of computer technology to local level governments and planning
agencies with the advent of powerful PC's and workstations may serve to widen the policy debates in the local transportation
planning process. Local agencies are able to combine publicly available spatial databases, such as the U.S. Census products, with in-house data and perform modelling and spatial analysis in their localities. Examples of this activity are found in the Seattle and Minneapolis-St. Paul metropolitan regions, where city and county governments have built GIS's and are performing transportation modelling in their localities, and local MPO's are beginning to implement GIS-T's (Johnson, et. al., 1989; Alderson, 1989).
The importance of inter-agency relations is also re-enforced by the suburban congestion issue. This is primarily a "many origin to many destination" problem. Therefore, the suburban mobility issue cuts across local boundaries; congestion problems in a given community
may be the result of policies and actions in other communities over which the affected community has no control. This situation calls for transportation planning which is more comprehensive in scope,
incorporating many communities (Cervero, 1988; Gakenheimer, 1989). The need for inter-agency cooperation is underscored by the fact that metropolitan and state transportation agencies cannot "build their way out of the problem" and must rely more on local policy actions, such as transportation systems management (TSM), to combat suburban congestion (Cervero, 1988; Deakin, 1988). Thus, MPO's may be called upon to provide a forum for inter-agency
assistance to local agencies to re-enforce local transportation planning efforts.
Concerns for the environment, common to transportation planning in the 1970's and 1980's, are likely to continue in the future (Weiner,
1989). Thus, future transportation planning will continue to be characterized by deemphasis on new construction and concern for air quality. Environmental concerns may also widen the scope for MTP. For example, transportation planning may include the impact of transportation policies on wetlands.
The organizational assessment of the MPO's external environment should consist of a review of internal information flows, and an existing hardware and software inventory. This provides a baseline of the MPO's IS capabilities. Information flows involve questions of:
1. Who uses what data and for what purposes?
2. What are data maintenance responsibilities of each departments?
3. To what degree are departments inter-dependent for data
needs?
Answers to these questions provide a better understanding of the nature of the MPO's overall database. This understanding, in turn, improves the planning of any data integration strategies.
A hardware and software inventory consists of detailing the current computing environment. Software inventory encompasses the
current DBMS and spreadsheet programs, and any automated drafting or mapping systems. Hardware inventory includes the network
configuration, stand-alone workstations, and any peripherals such as plotters. An understanding of the current computing environment is useful for formulating an incremental approach to software and hardware procurement.
2.3 The Analytical Needs of an MPO.
From an assessment of future trends in MTP, the future analytical demands on an MPO may be assessed. The task of the MPO is to perform analysis at both the macro as well as the micro level. At the system or macro-level, this analysis involves regional
transportation modelling, sub-area and corridor analysis. At the project or micro-level, this analysis consists of traffic impact and
intersection analysis, and traffic engineering-type concerns.
MTP for urban areas with a population in excess of 50,000 is still a federal requirement. In the early 1970's, TDM fell into disfavor
somewhat and many agencies relegated the use of these models from use for comprehensive transportation planning (Appendix 11.1) to project assessment (Atkins, 1987). However, in the mid-1980's, the suburban mobility issue appears to have stimulated renewed .
level (Weiner, 1989). The continued growth of Economic Activity Centers (EAC's) -- the spatially dispersed, but fast growing suburban commercial centers -- have also made sub-area and corridor analysis increasingly important.
Transportation modelling, as it exists today, continues to rely upon traditional network modelling approaches (see Appendix 11.1). The
principal uses of modelling are for: long-range planning, transit analysis, demand management, and sub-area planning (Weiner, 1989).
The UTPS is the primary set of techniques used by MPO's for long-range metropolitan-scale transportation planning studies. Many commercially available TDM software packages exist for the
mini-and micro-computer environment with improved features (see Lewis and McNeil, 1986).
Many analysts feel that solutions to the suburban mobility question tend to lie more in land-use policies, than in traditional
transportation policies such as highway construction and TSM (Deakin, 1988). To formulate better land-use policies, improved analytical tools are required to dynamically model interactions between land-use and transportation in suburban areas. Failure to reflect the feedback effects on land-use of transportation model output underestimates the impacts of transportation on land development.
In an effort to better assess land-use elements in their
Mid-American Regional Council in Kansas City) make use of activity distribution models. The package of choice is the Integrated
Transportation and Land Use Package (ITLUP) which is part of the UTPS. Activity allocation models distribute residential and
employment activity over space, given area growth rates and current demographic data. This activity allocation provides inputs in
modelling for scenario testing and projection. However, the problem has been the interface between activity allocation models and TDM due to the different level of aggregations characterizing the two. Thus, a crucial analytical need is to convert between the two types of models.
Given the "many origin to many destination" nature of suburban trips, transit options remain less a solution to the suburban mobility
problem (Cervero, 1988). However, transit analysis and planning still form an important part of an MPO's transportation planning activities. Moreover, transit planning continues to be a federal requirement. The transit analysis needs of an MPO principally consist of corridor analysis. Concern for fiscal restraint has also led to an increased need for evaluating cost-effectiveness of transit operations (Weiner, 1989).
At the micro-level, other analytical functions may be demanded of the MPO. The increase use of impact fees and traffic mitigation policies to combat suburban congestion signal a continued reliance upon traffic impact analysis (Appendix 11.2) by MPO's. Many
micro-level work (Stover and Koepke, 1988). However, there is a need to coordinate between analysis at the metropolitan, sub-area and corridor analysis, and site planning levels (Weiner, 1989). This coordination involves the ability to use output from modelling performed at a given level of aggregation as input to analysis at another level.
2.4 The Data Needs of an MPO,
The next step is the identification of data needs to support
analytical needs of the MPO at both the project and system level. MPO's generally do not make use of highway inventory data, such as pavement characteristic data. These data are usually maintained locally by the local Department of Public Works (DPW) or by the state Department of Transportation (DOT) at the state level.
An MPO does, however, make use of a considerable amount of data including:
1. Travel behavior data.
2. Network characteristic data.
3. Demographic data, such as Census journey to work data.
5. Traffic Impact data.
Fundamental to the travel demand forecasting process (Appendix 11.1) are travel behavior, or Origin/Destination (O/D) survey, data. These sample data form the basis for model assumptions. O/D surveys are commonly sample surveys of three to five thousand
households for a SMSA of one million. The costs of travel behavior surveys is expensive; therefore, updates are done in ten to twenty year intervals (Purvis, 1989). Metropolitan transportation
databases currently in use are, in many instances, outdated;
therefore, improved and updated databases may be required in the near future. One extreme example of an aging database, is found in Boston where MTP continues to rely extensively on O/D survey data from 1963 (Kaatrud and Lewis, 1989). Many MPO's from major metropolitan areas are currently in the process of updating these datasets. A recent survey found that of the MPO's in the top twenty-five SMSA's, sixteen were planning travel behavior surveys to
coincide with the 1990 U.S. Census (Purvis, 1989).
MPO's also maintain the local highway network characteristic data (Appendix 11.1). Network characteristic data includes information on the attributes of the highway network necessary for TDM, such as link directionality or number of lanes. The updating of these data is expensive and is done periodically on a five to ten-year basis. Trip tables or O/D matrices (Appendix 11.1) are also part of the network database. For a large MPO in an SMSA of two-three million, these
matrices may contain roughly 500 to 1000 zones. TDM has facilities for the update and manipulation of trip tables.
To support TDM, MPO's require spatial data in the form of network coordinates, known as network coding. The demand for this spatial data has increased recently due to the increased use of graphic
interfaces in TDM software packages (Florian, 1982). The storage requirements for these data is significantly less than the spatial data contained in a GIS database (see Chapter IV).
MPO's rely heavily on demographic data as well. U.S. Census data provides the main source of demographic information for the MPO. Census data is relatively inexpensive; the cost of Census data products is less than if the MPO collected the data itself. A recent survey by the FHWA, indicates that a majority of MPO's in SMSA's over one million population made use of the 1980 Census data
(Wykstrom, 1989). MPO's utilized U.S. Census products for MTP, such as The Urban Transportation Planning Package (UTPP) (Appendix 1.42). The UTPP includes all journey to work information crucial for trip generation and trip distribution modelling (Appendix 11.1). MPO's also made use of other 1980 Census products, such as the Summary Table File (STF) (Appendix 1.42). The STF's are distinct from the UTPP in that they contain basic demographic data broken down by Census tract or TAZ, but no journey to work data. These basic demographic data are useful for trip generation modelling. Census data products may be purchased in tape or micro-computer
Indications are that MPO's are planning to make use of the 1990 Census data. The U.S. Census has entertained input from MPO's on possible improvements to the 1980 Census products (Salopek, 1989). Although the Census Transportation Planning Package (CTPP) is only at the design phase at the moment, the general form of the package is likely to be the same as the 1980 version (Simkowitz, 1989d). One problem with the use of Census data is the time lag for data release; for example, the 1980 Census data became available in
1984. A three to five year time lag is likely for the 1990 data as well.
MPO's also make use of the Census' digitized cartographic products. These products are basically compatible with other Census products. Journey to work information is geo-coded for reference to digital
line products; for example, the 1980 UTPP was coded with the GBF/DIME files (Appendix 1.42). The TIGER/Line files are also useable in a MTP context since the TIGER/Line files can
accommodate data for the construction of TAZ's (Simkowitz, 1989d). However, the TIGER/Line file requires considerably more storage space than the network coding data used with TDM. In addition, as experienced with the GBF/DIME files, considerable work, in the form of error checking and correction, may be necessary to make
TIGER/Line files operable. TIGER files also involve maintenance costs for local updates in the years between censuses (see section 4.4).
At the micro-level of analysis, the work of an MPO requires traffic impact data. These data usually consist of current traffic counts in the area likely to be impacted by the proposed site development or project. Since traffic impact studies are basically project-specific, the data collected for such studies is temporal and used on a one-time basis. Traffic impact datasets are typically small, less than five megabytes (MB's), and make use of Census parcel-based
information for site specific areas. Traffic impact data is costly since it usually involves primary data collection.
2.5 The Preliminary Design of a GIS-T for an MPO.
With an assessment of future analytical and data requirements, and an idea of present information system capabilities, a preliminary design of a GIS-T for the MPO may be conceived. This phase is
essentially conceptual; it involves logically thinking through a possible design of a GIS-T and its database for the MPO.
The preliminary design may include: a conceptual database design, consideration of data sources, the computing environment, the analytical functions to be enhanced by a GIS, and the institutional and organizational context. The institutional and organizational
issues may consist of: the potential inter-agency data exchanges and cooperation in constructing a GIS, estimated human resource
requirements, and any required changes in information flows within the organization. In depth discussion of these topics is not carried
out here, since the major organizational and technical aspects of a GIS-T are detailed in Chapters III and IV.
As shown in Figure 1.4, once the preliminary design is completed, a decision point (step 4) is reached in the appraisal process. At this point, management must ask whether GIS-T offers the potential for adequately meeting the analytical and data requirements.
Furthermore, does a GIS-T provide value-added to the data
processing and transportation analysis done by the MPO, and should the MPO proceed and devise a plan for the implementation of a
GIS-T? This is essentially a viability assessment in which the
preliminary design of a GIS-T, with some cost estimates, is weighed by decision-makers against budget and other considerations.
A decision to abort the GIS-T assessment may be seen as the
equivalent of a "do-nothing" approach. This need not terminate GIS considerations for the MPO. GIS options may prove more viable and worthy of re-assessment at a future point in time, given
technological advances or shifts in the transportation planning environment.
A "go" decision initiates a GIS-T implementation plan, involving more detailed organizational and technical issues. This is the subject of the next section.
CHAPTER ill: THE STRATEGIC IMPLEMENTATION PLAN: ORGANIZATIONAL ISSUES.
3.1 Introduction.
Institutional and organizational issues form an important part of the implementation of a GIS-T. While many technical issues have been overcome through vendor innovation, a growing number of
practitioners feel that institutional and organizational issues have supplanted technical issues as the main obstacle to the successful implementation of GIS technology (Croswell, 1989; Somers, 1989).
This section outlines the organizational and institutional issues which need to be addressed in a strategic implementation plan for a GIS-T. Strategic planning for the implementation of a GIS-T
involves clearly defining objectives and designing system
procedures to meet those objectives. The difficulties in discussing the organizational issues associated with a GIS-T, lie in the lack of GIS-T user history and in attempting to generalize across
organizational contexts.
Recognizing these limitations, one possible grouping of
organizational issues is put forth here, around which the chapter's discussion is structured. Firstly, an organizational structure, termed here as the "GIS-T Coordination Group", may be formed to
provides a foundation for the continual upkeep and assessment of the system. Secondly, the question of how the GIS-T Coordination Group fits into the overall organizational structure of the MPO is
addressed. Thirdly, the effects on personnel issues is explored. Fourthly, issues involved in the linkage, if any, with outside
agencies regarding a GIS-T is discussed. Finally, the interactions between technical decisions and organizational decisions cannot be ignored; certain technical decisions may impact on organizational decisions and vice versa.
3.2 Establishing a Foundation.
The word "System" in the term "GIS" may be broadly defined as not only the software and hardware components of the GIS, but also the organizational commitment and associated staff which ensure the continual and proper functioning of the GIS. This definition alludes to the importance of establishing a foundation of management
commitment and organizational structure to support the GIS-T.
One component of this foundation is management support and commitment for the duration of the project. This involvement ideally should begin in the planning stages (Somers, 1989). This commitment is critical because the management group controls the resources necessary for periodic hardware and software
replacement. One way to garner this support may be to clearly delineate the flows of benefits from a GIS-T, and to make
management aware of the decision support aspects offered by the system (Croswell, 1989).
The GIS-T Coordination Group is the focal point for the learning that takes place at each stage of the introduction of a GIS-T. The size of the group may grow during the course of a GIS-T implementation. The initial pilot phases of a GIS-T project may require one to three half-time staff persons. Full integration of GIS-T into MPO
operations may require a unit on the order of 10 to 30 staff members.
The structure of the GIS-T Coordination Group must also be determined at the outset. One of the aims of this group is to
rationalize the relations between the GIS-T implementation process and external actors, and establish an environment of consensus and cooperation among all concerned parties. Figure 3.1 provides an
abstracted view of these relationships: the thin line depicts relationships which may be of significance for only the initial stages of the project; thick bands indicate relationships which promise to continue after the system is operative.
There are four groupings. Firstly, there are the relations between the GIS-T Coordination Group and the MPO administration. These relations are important for cultivating management commitment to a GIS-T project. Management must be kept abreast of events and presented tangible products demonstrating a value-added to data management and analysis. This relationship is likely to
FIGURE 3.1: THE INTERACTION BETWEEN THE GIS-T COORDINATION GROUP AND EXTERNAL ACTORS.
MANAGEMENT & OTHER AGENCIES a VENDORS CONSULTANTS
USERS
OTHER DEPTS. (Highway, Transit, Mapping, etc.) GIS-T COORDINATION GROUPcontinue through the life of the GIS-T because of the constant need for funding and resources, given the life-cycles of data and
hardware, and software. Secondly, there are the users or the
analysts and planners who access the system. Typically, these users have a familiarity with computer technology, yet varying degrees of understanding of the system. The needs of this group are related to applications of the system and are commonly of an on-going,
trouble-shooting nature. User groups also require training for use of the GIS software. Relations with user groups promise to be a
continual relationship for the duration of the GIS-T, given staff turnover and new applications.
The hardware and software vendors and various consultants represent a third group. This group is interested in the detailed technical aspects of the system more than the overall enterprise.
From the MPO's standpoint, this group demands performance
monitoring by MPO staff with some technical understanding. After the system is operational, contact with this group is reduced to software updating and periodic trouble-shooting.
A fourth group includes other MPO departments or divisions which may be affected by the GIS-T. During the implementation, these relations are important. The GIS-T Coordination Group may be placed within the existing database administration. The GIS-T
implementation may greatly alter the operation of or replace the existing mapping department. Other departments, such as transit and highway analysis departments, may interact with a GIS-T
Coordination Group. Once the system is functional and concurrent organizational adjustments completed, these relations may be normalized and routine. In the long-term, interactions between the GIS-T Coordination Group and other agencies, or even the general public, may also gain in significance for data exchange activities.
With these relations in mind, the structure for the GIS-T
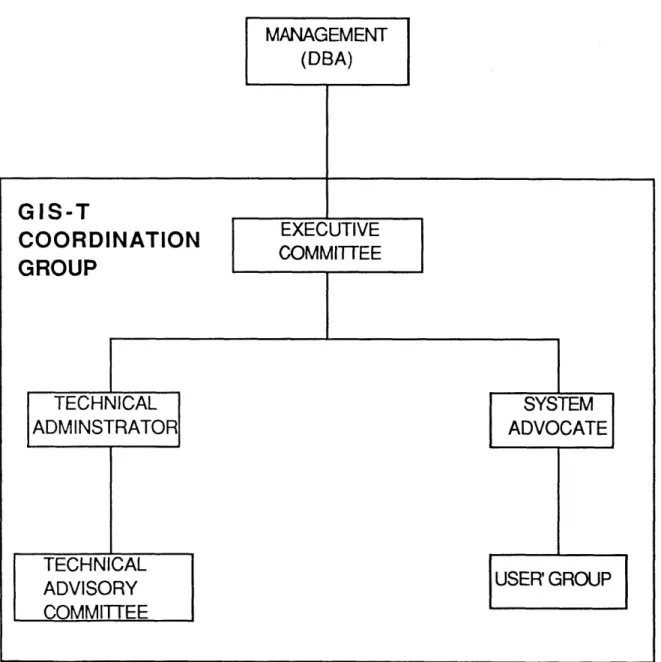
Coordination Group, with a fully operational GIS-T, might include components which manage these relations. One body might handle the interactions with management and, if appropriate, the
inter-agency relations; this may be termed an "Executive Committee". This body might manage the budget of the GIS-T project and ensure adherence to the implementation plan. Eventually, as the GIS-T fully integrates the MPO's database, the duties of the Executive
Committee may be assumed by the MPO's DBA. Another body might be concerned with the detailed technical questions regarding hardware, software, network functions, etc; this might be a "Technical
Committee".
Since the input of the end user is important for system design, the management of the relations between the users and the system may warrant separate attention. Therefore, the GIS-T Coordination Group
might include one or more individuals concerned with the day-to-day problems of the users of the system. This individual might be called the "System Advocate". This individual(s) might also act as aconduit for the dissemination of innovative uses of the GIS-T. As indicated in Figure 3.2, the structure of this group might take the form of an
FIGURE 3.2: POSSIBLE GIS-T COORDINATION GROUP ORGANIZATIONAL STRUCTURE.
Executive Committee overseeing the work of a technical committee and the System Advocate.
Finally, the whole operation ideally requires a driving force; a GIS coordinator or "champion" in the GIS vernacular. Typically, this is an individual given the resources and authority to make GIS a reality. This is an individual with knowledge of both GIS and transportation planning, and the ability to communicate with decision-makers and
promote the GIS idea throughout the organization (Dangermond, 1989). Such an individual is not always readily available within the organization. (Somers, 1989).
There are, of course, alternative structures to the one suggested here. An organization may choose to employ an outside party, such as a consultant, to manage the whole GIS-T implementation process. A GIS-T structure may also develop informally within the
organization's database administration. While these approaches may have validity, creating a formal structure for GIS implementation forms an organizational foundation and may provide a smooth adjustment to the GIS system is, therefore, preferable (Condi,
1989).
3.3 Fitting a GIS-T Into The Existing Organizational Structure.
After a GIS-T Coordinating Group is formulated, its structure known and duties delineated, the question becomes where and how it will fit into the overall organizational structure of the MPO.
Although difficult to generalize, the typical organization structure might consist of an administrative body overseeing departments organized by mode, such as transit and highway analysis.
Responsibilities for database maintenance usually reflects these divisions of responsibility of the different departments (Nyerges and Dueker, 1988). Within the MPO, ad hoc groupings of transit and
highway department staff may occur on specific studies or projects. In addition, an MPO usually has a department responsible for mapping and graphics production.
As mentioned above, a GIS-T Coordination Group might be formed within the present database administration (DBA). This placement
may impact on vertical (hierarchical) links in the organizational structure. The MPO must then determine the nature of the lines of authority between the GIS coordination group and the DBA, and between the GIS-T Coordination Group and management. The database integration afforded by a GIS-T might also affect
hierarchical relationships between the GIS-T Coordination Group and different agency departments. Therefore, these relationships should be delineated. For example, as part of its coordinating role, the
GIS-T Coordination Group may set standards, such as data scale and frequency of data updates, for the various departments of the MPO.
A GIS-T may also impact on horizontal linkages in the organizational structure. Horizontal or lateral linkage refers to the functional relations between departments, which are at the same level in the organization's hierarchy. The enhanced communications among user groups afforded by a GIS-T may lead to greater horizontal linkages and dependencies among departments, such as between the DBA and mapping departments, for example. A GIS-T may require user
support mechanisms to be spread across departments. One analyst suggests that rather than allowing lateral links to evolve in an ad hoc fashion, these links should be developed in the initial stages of the implementation (Somers, 1989). This may consist, for example, of designating responsible persons in the affected departments for information exchange with the GIS-T Coordination Group.
The problem of super-imposing the horizontal structure engendered by a GIS on a hierarchical structure may create conflicts between centralization and de-centralization tendencies within the
organization. For example, data integration might be inhibited by organizational structures that dictate separate files of attribute data, rather than one integrated file. This problem may be overcome
by assigning custodial responsibility for different data layers to the parts of an organization most responsible for the data, tying all layers to a common geo-referenced framework (Nyerges and Dueker, 1988). However, this may conflict with the centralization