https://doi.org/10.4224/20378289
READ THESE TERMS AND CONDITIONS CAREFULLY BEFORE USING THIS WEBSITE. https://nrc-publications.canada.ca/eng/copyright
Vous avez des questions? Nous pouvons vous aider. Pour communiquer directement avec un auteur, consultez la première page de la revue dans laquelle son article a été publié afin de trouver ses coordonnées. Si vous n’arrivez Questions? Contact the NRC Publications Archive team at
PublicationsArchive-ArchivesPublications@nrc-cnrc.gc.ca. If you wish to email the authors directly, please see the first page of the publication for their contact information.
For the publisher’s version, please access the DOI link below./ Pour consulter la version de l’éditeur, utilisez le lien DOI ci-dessous.
Access and use of this website and the material on it are subject to the Terms and Conditions set forth at
International Energy Agency Annex 39: High Performance Thermal
Insulation Materials, Subtask A: Vacuum insulation panels - study on
VIP-components and panels for service life prediction of VIP in building
applications
Simmler, H.; Brunner, S.; Heinemann, U.; Schwab, H.; Kumaran, M. K.;
Mukhopadhyaya, P.; Quénard, D.; Sallée, H.; Noller, K.;
Kucukpinar-Niarchos, E.; Stramm, C.; Tenpierik, M.; Cauberg, H.; Erb, M.
https://publications-cnrc.canada.ca/fra/droits
L’accès à ce site Web et l’utilisation de son contenu sont assujettis aux conditions présentées dans le site LISEZ CES CONDITIONS ATTENTIVEMENT AVANT D’UTILISER CE SITE WEB.
NRC Publications Record / Notice d'Archives des publications de CNRC: https://nrc-publications.canada.ca/eng/view/object/?id=793fec4c-e771-457e-a20c-898597ec4f88 https://publications-cnrc.canada.ca/fra/voir/objet/?id=793fec4c-e771-457e-a20c-898597ec4f88
Vacuum Insulation Panels
Study on VIP-components and Panels for Service Life
Prediction of VIP in Building Applications
(Subtask A)
Institutions and Authors
EMPA - Switzerland Hans Simmler Samuel Brunner ZAE-Bayern - Germany Ulrich Heinemann Hubert Schwab NRC - Canada Kumar Kumaran Phalguni Mukhopadhyaya CSTB - France Daniel Quénard Hébert Sallée
Fraunhofer IVV - Germany
Klaus Noller Esra Kücükpinar-Niarchos Cornelia Stramm TU Delft - Netherlands Martin Tenpierik Hans Cauberg Dr.Eicher+Pauli AG - Switzerland
Markus Erb (Operating Agent)
Impressum
IEA/ECBCS Annex 39
The work presented here is a contribution to Annex 39 of IEA/ECBCS-Implementing Agreement.
Title
Vacuum Insulation Panels - Study on VIP-components and Panels for Service Life Prediction of VIP in Building Applications (Subtask A)
Institutions & Authors
EMPA: Swiss Federal Laboratories for Materials Testing and Research (Switzerland) Hans Simmler, Samuel Brunner
ZAE-Bayern: Bavarian Centre for Applied Energy Research (Germany) Ulrich Heinemann, Hubert Schwab
NRC-IRC: National Research Council - Institute for Research in Construction (Canada) Kumar Kumaran, Phalguni Mukhopadhyaya
CSTB: Scientific and Technical Centre for Construction (France) Daniel Quénard, Hébert Sallée
Fraunhofer IVV: Institute for Process Engineering and Packaging (Germany) Klaus Noller, Esra Kücükpinar-Niarchos, Cornelia Stramm
TU Delft Technical University of Delft (Netherlands) Martin Tenpierik, Hans Cauberg
Dr.Eicher+Pauli AG (Switzerland) Markus Erb - Operating Agent
Summary
In accordance with the aims of the Kyoto protocol, a great energy-saving potential and there-fore potential for reducing CO2 emissions has been found in the building sector. In 1997,
about 25% of the energy consumption in the EU came from room heating. Increasingly restrictive building regulations focus on using better thermal insulation, which means insula-tion layers of up to 30 to 50 cm, if conveninsula-tional insulainsula-tion material is used. The motivainsula-tion for examining the applicability of high performance thermal insulation in buildings (i.e. evacuated insulation in the form of vacuum insulation panels) came from the difficulties involved in renovation – namely severe space limitations and therefore technical constraints, as well as from aesthetic considerations. The thermal resistance of evacuated insulation is a factor of five to ten better than conventional insulation of the same thickness. Vacuum insulation panels (VIP) in general are flat elements consisting of an open porous (and therefore evacuation-capable) core material which has to withstand the external load caused by at-mospheric pressure, as well as a sufficiently gas-tight envelope to maintain the required quality of the vacuum.
Nano-structured materials have been found to require the least quality of vacuum, which has to be achieved and to be maintained. In panels basically made of pressed fumed silica, the contribution of the gas to the total heat transfer is virtually eliminated even at an internal gas pressure of a few hundred Pascals. The requirements on the gas-tightness of the envelope are also relatively moderate for these extremely fine-structured core materials – the largest pores are in the order of 100 nanometres. Thin laminated metal foils and special high-barrier metallized laminates consisting mainly of polymers are therefore used for the envelope. This report focuses especially on this type of VIP, which combines relatively simple and flexible production methods (and is therefore currently the least expensive alternative) with an ac-ceptable service life of 30 to 50 years before the thermal barrier is impaired in any way due to air permeation into the panels. Even if the vacuum failed completely, the thermal resistivity of this filler material is twice as efficient as that of any standard insulation material.
Investigations have been performed individually on the core materials and laminates de-signed for the envelope as well as manufactured VIP.
All the core materials investigated in this study are fumed silica products with minor differ-ences, particularly in the nature of the fibres used for reinforcement. The densities are in the range of 160 kg/m³ to 190 kg/m³. The porosity is higher than 90%, the specific surface area is higher than 200 m²/g. High sorption capability results from the huge specific surface area; at 75% relative humidity, 0.05 kg of water per kg material is typically adsorbed. Thus fumed silica may act as a desiccant.
At a low gas pressure (100 Pa) and at room temperature the total thermal conductivity of the core material is about 0.004 W/(m·K) - 0.001 W/(m·K) from infrared radiative heat transfer and 0.003 W/(m·K) due to heat conduction via the solid skeleton. The thermal conductivity increases with the internal gas pressure to about 0.020 W/(m·K) at ambient pressure. At 10°C the impact of water content on the thermal conductivity was found to be linear with an increase of about 0.0005 W/(m·K) per mass% of adsorbed water.
Laminates with the highest grade barrier properties had to be determined to fulfil the re-quirements of long-term application in buildings. As with all polymeric films, the transmission rate for water vapour for these laminates was found to be several orders of magnitude greater than those for oxygen or nitrogen. Measuring extremely low permeation rates is challenging and very time-consuming. A fast measurement tool was developed to derive
water vapour transmission rates from helium transmission measurements. The effects of corners and edges on water vapour and on oxygen transmission rates were also determined. The thermal performance of VIP is impaired in two ways: increasing internal gas pressure and increase in the internal water content. Measurements on panels stored in different cli-matic conditions gave detailed information on permeation rates for air and water vapour as a function of temperature and humidity including all the effects of edges, corners and process-ing. The laminate with only one metallized layer was clearly proved not to fulfil the require-ments. Acceptable pressure increases of about 100 Pa per year can be expected for VIP with an Al-foil and for laminates with three metallized layers. The significant contribution of air permeation through the edges of the VIP postulates that panels may not be too small in size, (i.e. larger than 50 cm x 50 cm).
Water vapour uptake in the threefold metallized film was found to be basically proportional to the size of the panel surface, whereas the panels with Al-film absorbed water vapour at a much lower rate, and this occurred mostly through the edges and seams.
The dependence of air transmission rates on temperature can be described by the Arrhenius law with activation energies that are in the range of 25 to 40 kJ/mol. Water vapour transmis-sion rates are proportional to the differences in the partial pressures inside and outside, a significant explicit dependence on temperature could not be observed.
From the thermal point of view, metallized films are more favourable than laminated alumin-ium foils. A significant thermal bridge effect at the edge of Al-foil panels has to be taken into account in the overall U-value.
Since the VIP’s inherent aging is caused by the intrusion of gases, it thus also depends on climatic conditions and the size of the panels. Several more or less detailed models have been developed to predict the aging effects. To check the aging of VIP sufficiently slowly under practical conditions, VIP were integrated into five different building constructions in Germany and Switzerland. Temperature and humidity were monitored for more than a year and the panels dismantled for testing several times. The measured pressure increases were quite close to the calculated data, and the water uptake was even smaller than expected - presumably due to transient behaviour in the laminate. Typical pressure increases are less than 200 Pa/yr. The initial moisture accumulation rate (typically less than 0.2 mass%/yr) diminishes with time as the internal and external (mean) humidity is equalized.
The VIP technique is therefore principally applicable even in the building industry. Special attention has to be paid to climatic conditions. As for other polymers, exposure to UV-radiation should be limited unless shown otherwise by testing.
Since VIP covered with laminates are highly sensitive to mechanical impact, cautious han-dling during transport and installation as well as mechanical protection in the construction are imperative.
Content
SUMMARY
I
CONTENT III
1
INTRODUCTION 1
1.1 Vacuum Insulation for buildings 1
1.2 Physics and core materials 3
1.3 IEA/ECBCS Annex 39 6 1.4 Participating institutes 8
2
CORE MATERIAL
10
2.1 Physical Properties 10 2.2 Mechanical Properties 17 2.3 Hygro-Thermal Properties 19 2.4 Gas Permeability 34 2.5 Fire behaviour 352.6 Thermo Gravimetric Analysis (TGA) 35
2.7 Summary “Core” 37
3
ENVELOPE 38
3.1 Objectives 38
3.2 Theoretical Background 38
3.3 List of companies offering WVTR measurements 45
3.4 Barrier Measurements 45
3.5 Development of a new barrier measurement unit 57
4
PANELS 62
4.1 Introduction 62
4.2 Properties and aging mechanisms 64
4.3 Experimental methods 69
4.4 Experimental results 72
4.5 VIP service life prediction 93
4.6 VIP in buildings and components 106
4.7 Summary “Panel” 125
5
QUALITY ASSURANCE, PRODUCT DECLARATION AND DESIGN
VALUES 127
5.1 General aspects 127
5.2 Factory production control, test methods 128
5.3 Product declaration 129
5.4 Thermal design values 133
5.5 Summary “Quality assurance, product declaration and design values” 135
6
OUTLOOK 136
REFERENCES 138
APPENDIX 142
Film measurements (NRC) 142
Panel measurements (NRC) 144
1 Introduction
1.1 Vacuum Insulation for buildings
1.1.1 Development of insulation standards
Most insulation materials have been developed before 1950 but the extensive use of thermal insulation started only after the oil crisis in 1973. Since the oil crisis, the thermal insulation of buildings became the key element to prevent heat losses and to improve energy efficiency. For a long time for regions with an extended annual heating period, 10 cm of standard insula-tion such as expanded or extruded polystyrene, foamed polyurethane (PU), fibreglass, etc, were considered as good insulation. But energy specialists calculated that the economically optimised thickness should be 30-50 cm depending on the specific climatic conditions. To-day, many existing building regulations and standards demand U-value that is approximately equal to 0.2 W/(m2·K) for roofs and walls, which means about 20 cm thick insulation layers. Many architects have a problem with such regulations. They want to create spaces, not insulated bunkers. The problem of thick insulation layers is especially critical in the case of renovated buildings where there are severe limitations on space and also many other techni-cal constraints.
1.1.2 Energy in buildings
The effect of a major adoption of the VIP (Vacuum Insulation Panel) technology by the con-struction industry on environment is expected to be absolutely huge. The official numbers for the EU given below show that using VIP in buildings could account for most of the very challenging target of 8% reduction in emission of greenhouse gases (Kyoto Protocol).
The total final energy consumption in the EU in 1997 was about 930 Mtoe (Million tons oil equivalent). A simplified breakdown of this demand shows the importance of buildings in this context: 40.7% of total energy demand is used in the residential and commercial sectors, most of it for building-related energy services (Table 1). It should also be pointed out that approximately 10% of the consumed energy in buildings comes from renewable energy sources. Space heating is by far the largest energy end-use of households in EU Member States (57%), followed by water heating (25%). Electrical appliances and lighting make up 11% of the sector’s total energy consumption. For the commercial sector the importance of space heating is somewhat lower (52%), while energy consumption for lighting, office equip-ment and "other" (water heating, cooking and cooling) are 14%, 16% and 18%, respectively.
Table 1: Energy consumption of buildings in Europe. (Source: Directive of the European Parliament And The Council on the energy performance of buildings.)
Residential Sector [%] Commercial [%]
Space Heating 57 Space Heating 52 Water Heating 25 Water Heating 9 Electric Appliances 11 Lighting 14
Cooking 7 Office Equipment 16
Cooking 5
Cooling 4
From these numbers it can be derived that more than 25% of EU energy consumption and also CO2 emissions are caused by heat transfer processes in buildings, which directly
de-pend on insulation standards. It has to be kept in mind that these heat transfer processes not only do occur in the building envelope but also in boilers, refrigerators and freezers and cold storage rooms.
1.1.3 Potential impact of VIP for building insulation
In 1995, there were roughly 150 million dwellings in the EU-15; 32% of this stock was built prior to 1945, 40% between 1945 and 1975 and 28% between 1975 and 1995. The ratio, housing starts vs. housing stocks, varies between 1 to 2%. Therefore the reduction in CO2
emissions by using VIP technology depends largely on how well the new technology is adopted in retrofitting the old building stock, which to a large extent (around 50%) is not insulated at all. This success depends not only on the technical solutions but also on regula-tions and energy prices. However, it can be assumed that the energy consumption of the dominating old buildings can be reduced by a factor of three. This means that the EU CO2
emissions would be reduced by about 8%, which is the reduction the EU agreed on in the Kyoto Protocol. Since VIP-based systems are thinner and their recycling economically attrac-tive, the resource intensity will be lower than for conventional solutions. Additional important impacts are reduction in adverse environmental effects of transporting fuel (sea and land) to and inside Europe and also reduction in the rate at which the global energy reservoirs is depleted. Furthermore, if one takes into account that use of the VIP technology is not limited to Europe only, the numbers can be much more impressive.
1.1.4 Vacuum Insulation today
Currently VIP have only limited use, mainly in top models home refrigerators/freezers and cold shipping boxes. Japan controls more than 50% of the small global VIP market with several million panels per year. The VIP market in Japan is fast growing. The common core materials are fumed and precipitated silica, open-cell PU and several types of fibreglass. Both metallized-film and aluminium-foil laminates are being used to seal the vacuum.
For buildings, most of the VIP activity is still in the R&D phase with some demonstration projects. Germany and Switzerland are the only countries where a market in its early stage has been established. Fumed silica boards are being used almost exclusively. Fumed silica
the powder (Figure 4). There are only three producers of fumed silica in the world, and two of them are large EU companies: Wacker (Germany), Cabot (USA) and Degussa (Germany).
1.2 Physics and core materials
1.2.1 Physics
The physics of heat transfer through conventional insulation materials is well known. A short description of the most important phenomena is given below.
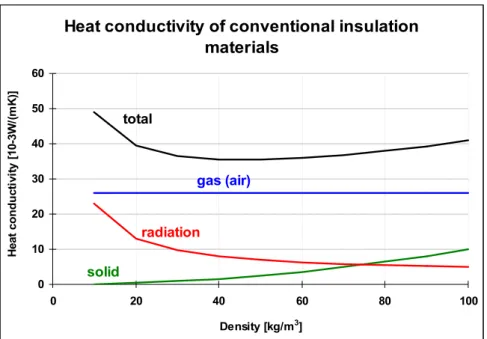
In conventional insulation materials like mineral wool, glass wool or organic foams the total heat transfer is dominated by the contribution of the (non-convective) gas within the hollow spaces or pores (Figure 1).
Heat conductivity of conventional insulation materials 0 10 20 30 40 50 60 0 20 40 60 80 100 Density [kg/m3] H e a t c ondu c ti v it y [ 1 0 -3 W /( m K )] solid total gas (air) radiation
Figure 1: Heat conductivity of conventional insulations (fibres and foams) is dominated by the gas conductivity.
Thus a large potential for improvement of the insulation properties can be realised by reduc-ing or even completely eliminatreduc-ing the gas conductivity. The gas conductivity in a porous medium is determined by the number of gas molecules as transfer medium as well as by the number of "walls" on the way from the hot to the cold side. At a high pressure, when the mean free path of the gas molecules is much smaller than the size of the pores, collision between the gas particles is the limiting mechanism for an efficient heat transfer. Here an increase in the gas pressure with an increase in the number of gas particles is correlated with a decrease in the mean free path. As the two effects, number of gas particles and fre-quency of collisions, compensate each other the thermal conductivity of a gas is nearly independent on the gas pressure, at higher pressures.
At atmospheric gas pressure the above behaviour holds for most conventional insulation materials. Also, gaseous conductivity is determined by the thermal conductivity of the non-convective gas. Reducing the gas pressure by "evacuation", the gaseous conductivity re-mains almost unaffected until the mean free path attains values that are in the order of the
size of the (largest) pores or higher. An extraordinary material in this regard is pressed powder boards made of fumed silica with the largest pores in the same order of magnitude as the mean free path of air molecules at atmospheric pressure (about 70 nm). For this material even at atmospheric pressure gaseous conductivity already is affected by the fine structure. It may be considered as "partially evacuated" and thus seems to be a favourite material for "evacuated" insulations.
Figure 2: Components of a VIP. The core-bag provides mechanical stability for handling and protects the welding area from being polluted by core-powder.
(foto: va-Q-tec).
Current VIP-technology uses especially this material with the least requirements to the quality of the vacuum, that has to be achieved and maintained in combination with special high barrier films and foils, which fulfil the requirements for long term applications as in buildings (Figure 2).
1.2.2 Core materials
The core material suitable for VIP production has to fulfil different requirements: very small pore diameter, open cell structure, resistance to compression (atmospheric pressure) and almost impermeable to infrared radiation.
Pore diameter
To reduce the gas conductivity in normal insulation materials the pressure has to be very low (Figure 3) which is difficult to maintain by an envelope mainly made of organic materials. That is why for VIP a combination of a nano-structured core material and pressure reduction is used.
pressed silica core with opacifier
multi-layer envelope film
core-bag
Thermal conductivity of air as a function of pore diameter 0.000 0.004 0.008 0.012 0.016 0.020 0.024 0.028
1.0E-04 1.0E-03 1.0E-02 1.0E-01 1.0E+00 1.0E+01 1.0E+02 1.0E+03
Gas pressure p [mbar]
T h e rm a l c o n d u c ti v ity [W /(m K )] fumed silica / aerogel pore diameter 10 mm 1 mm 0.1 mm 0.01 mm 0.001 mm
VIP service life
Figure 3: The small pore size of fumed silica or aerogels do reduce gas conductivity even at ambient pressure [1]. Today produced VIP (fumed silica core) start with in internal pressure in the range of 1 to 3 mbar. The VIP’s end of service life is reached when the gas conductiv-ity is starting to rise (50-100 mbar).
Cell structure
To be able to evacuate the core material it has to be 100% open-celled, so that the gas (air) can be quickly removed out of the material.
Stability
The internal pressure of a VIP is only few mbar. Consequently the pressure load on the panel is close to 1 bar or 10 tons/m2. The core material therefore has to be stable enough so that the pores do not collapse when evacuated.
Radiation
Besides gas conductivity, radiation has also to be reduced to reach very low conductivity values. This is done by adding opacifiers to the core material.
Heat conductivity
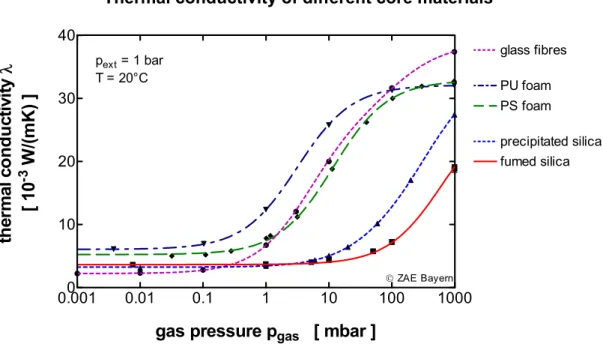
Today different organic and inorganic insulation materials with open-cell structure are avail-able for the use as core for VIP-production. Corresponding to the pore size distribution, the solid conductivity and the radiation properties of a material, a specific heat conductivity results, depending on the gas pressure (Figure 4). The figure shows clearly the advantages of fumed silica: low conductivity up to a pressure of more than 50 mbar and a conductivity at ambient pressure of half that of a conventional insulation material.
Thermal conductivity of different core materials 0.0010 0.01 0.1 1 10 100 1000 10 20 30 40 fumed silica glass fibres precipitated silica PS foam PU foam pext = 1 bar T = 20°C
gas pressure pgas [ mbar ]
th e rma l c o n d u c tiv it yλ [ 10 -3 W/ (mK) ] © ZAE Bayern
Figure 4: The heat conductivity of fumed silica starts to rise only above a gas pressure of more than 50 mbar.
1.3 IEA/ECBCS Annex 39
Germany and Switzerland were the first two countries supporting R&D activities with the aim of introducing VIP-technology to the building industry. In 2000 Switzerland decided to launch the topic on an international level. This happened in the frame of the IEA (International Energy Agency) Implementing Agreement called ECBCS (Energy Conservation in Buildings and Community Systems). Implementing Agreements are a kind of international networks of national representatives with the aim of coordinating applied research in the field of energy. Annex 39 is the 39th research program of ECBCS. It was officially adopted by the Executive Committee of ECBCS in November 2000 and started with an international conference in January 2001.
Since the topic was new to the research community, it was quite difficult to set up a work plan with the participating institutes. One problem for instance was the lack of standard methods to study VIP. But finally a work plan with two main fields of activity was developed: Subtask A: Panels
- Existing products, mainly VIP, will be analysed and their properties optimised in the way, that they meet the requirements of the systems in which they will be applied.
- Measurement standards concerning product declaration and quality monitoring proce-dures will be developed.
Subtask B: Applications
suitable groups for each development project, provide theoretical and practical information (simulation and testing of systems).
Part 2: Demonstration and information dissemination
- Realize demonstration projects together with well-known architects and important building owners.
- Lessons learned from the demonstration projects will be collected and used for further improvement of the materials and systems.
- Information material will be distributed to increase the interest of construction companies and clients.
1.4 Participating
institutes
Annex 39 Name e-mail Contribution
Dr.Eicher+Pauli AG
Switzerland
Markus Erb markus.erb@eicher-pauli.ch Operating Agent Introduction Subtask A ZAE-Bayern Germany Ulrich Heinemann Hubert Schwab heinemann.ulrich@zae.uni-wuerzburg.de schwab@zae.uni-wuerzburg.de Leader Subtask A Core material, Panel, Quality assurance , Outlook EMPA Switzerland Hans Simmler Samuel Brunner hans.simmler@empa.ch samuel.brunner@empa.ch Panel NRC/IRC Canada Kumar Kumaran Phalguni Muk-hopadhyaya kumar.kumaran@nrc.ca phalguni.mukhopadhyaya@nrc-cnrc.gc.ca Core material, Envelope CSTB* France Daniel Quénard Hébert Sallée quenard@cstb.fr sallee@cstb.fr Core material Fraunhofer IVV Germany Klaus Noller Esra Kücükpinar-Niarchos Cornelia Stramm klaus.noller@ivv.fraunhofer.de esra.kucukpinar@ivv.fraunhofer.de cornelia.stramm@ivv.fraunhofer.de Envelope TU Delft Netherlands Martin Tenpierik Hans Cauberg m.j.tenpierik@bk.tudelft.nl h.cauberg@chri.nl Panel
Subtask B Name e-mail Contribution FHBB Switzerland Armin Binz André Moosmann Gregor Steinke a.binz@fhbb.ch andre.moosmann@fhbb.ch gregor.steinke@fhbb.ch Leader Subtask B Report editor, Practice Report I, Recommendations, Economics EMPA Switzerland Karim Ghazi Reto Bundi karim.ghazi@empa.ch reto.bundi@empa.ch Thermal bridges ZAE-Bayern Germany Ulrich Heinemann Hubert Schwab heinemann.ulrich@zae.uni-wuerzburg.de schwab@zae.uni-wuerzburg.de Practice Report II TU Delft Netherlands Hans Cauberg Martin Tenpierik h.cauberg@chri.nl m.j.tenpierik@bk.tudelft.nl Case studies KTH Stockholm Sweden Gudni Johannesson Thomas Thorsell gudni@bim.kth.se thomas.thorsell@byv.kth.se Edge effect (stainless steel) * Work of CSTB partially funded by the French Energy Agency (ADEME - www.ademe.fr) and the French Electricity Company (EDF - www.edf.fr)
2 Core
Material
In this chapter the hygro-thermo-mechanical properties of two porous fumed silica based materials used as core materials for VIP applications are presented. They are named SIL1 (silica 1) and SIL2 (silica 2)
2.1 Physical
Properties
2.1.1 Density
This test was carried out by weighing boards of sizes 300 mm x 300 mm x 25 mm according to the standard EN 1602 “Thermal insulating products for building applications - Determina-tion of the apparent density” (see Appendix)
The mean values are listed in Table 2.
Table 2: Density.
Material Density
kg/m3
SIL1 192
SIL2 162
It’s important to note that the densities of both materials are nearly one order of magnitude higher than that of traditional insulating materials.
2.1.2 Porosity
The porosity was measured using a Helium pycnometer with samples of sizes: 60 mm x 40 mm x 25 mm. With this method, it is also possible to evaluate the bulk and skeleton density.
The results are presented in Table 3.
Table 3: Porosity & Densities
Material Reference Total Porosity
% Bulk Density kg/m3 Skeleton Density kg/m3 SIL1 93 ± 1 191 2’578 SIL2 94 ± 1 161 2’454
The bulk densities obtained with the pycnometer are in good agreement with the apparent densities given by the previous method. The skeleton density is almost the same as the density of silica.
In spite of the high density of both materials, their porosity is still higher than 90%. It means that the specific area is also very large, about several hundred m²/g.
2.1.3 Specific Area
The specific area was measured using the BET (Brunauer-Emmet-Teller) method [2] accord-ing to the ISO Standard 9277 “Determination of the specific surface area of solids by gas adsorption using the BET method”. MICROMERITICS 2100E2 apparatus was used for this purpose.
The BET method is based on the adsorption of Nitrogen molecules considered as a probe to cover the surface and then to estimate the specific surface (m2/g).
The measurement has been performed using a small sample (about 0.3 g) dried at 300°C. For both materials, the experimental curves, presented in Figure 23 are very similar.
0.0 0.2 0.4 0.6 0.8 1.0 0 50 100 150 200 250 300 350 400 Q cm 3 /g P/Ps SIL 1 SIL 2
Figure 5: BET Nitrogen sorption isotherm.
Table 4: BET Specific Area
Material Specific Area
m2/g
SIL1 213
SIL2 208
The specific surfaces of both materials are about 200 m²/g, in agreement with data given for commercialized products (between 100 & 400 m²/g). In comparison to carbon black (50-100 m²/g) or gypsum (~ 2 m²/g), it’s a high value.
2.1.4 Pore Size Distribution
The Pore Size Distribution (PSD) was investigated using the Mercury Intrusion Porosimetry (MIP) method. The basic principle consists in putting a small sample (about 0.2 g) in a glass bulb filled with mercury. Then the pressure is increased gradually and the volume intruded by mercury is measured (Figure 6). The pore radius is related to the applied pressure as:
P
cos
2
r
=
⋅
γ
⋅
θ
(1)r: pore radius
P: mercury applied pressure
γ: surface tension - 0.485 N/m
θ: contact angle - 130°
The test has been done with a MICROMERITICS AutoPore III 9410. The range of the PSD lies from 360 µm to 0.003 µm. The intruded volume is plotted against the pore radius.
The PSD is computed from the derivative of this curve.
With material such as compressed silica powder with a weak cohesion and thus a low elastic modulus, the high pressure (400 MPa) needed to reach tiny pores (< 10 nm) could signifi-cantly deform the material [3].
1000 100 10 1 0.1 0.01 1E-3 0 1 2 3 4 5 6 SIL 1 SIL 2 Cumul a ti ve por e vol ume ml /g Mean Diameter µm
Figure 6: MIP: Intruded volume versus pore diameter.
The density and porosity obtained from MIP curves are presented in Table 5.
Table 5: Density & Porosity from MIP.
Material Density kg/m3 Porosity % SIL 1 175 95 SIL 2 162 91
The four methods applied (gravimetry, pycnometer, BET, MIP) confirm the high porosity (> 90%) and the high specific area (> 200 m²/g) of silica core materials. As for the density, it ranges between 161 and 192 kg/m3. The discrepancy between the three methods are due to several reasons:
- the size of the sample: 300 mm x 300 mm x 20 mm for the weighting, 60 mm x 40 mm x 25 mm for the pycnometer and less than 10 mm x10 mm x 10 mm for the MIP.
- the friability or low cohesion of the materials which can lead to structural changes during the MIP test at high pressure.
2.1.5 Scanning Electron Microscopy - SEM
Even at low magnification (x30, x300), the fibres appear very clearly and one notices that each manufacturer does not use the same type of fibres. One type seems to be very stiff (SIL 1) whereas the other one is softer (SIL 2).
x30 – SIL 1 x30 – SIL 2
The next set of images obtained with a higher magnification (x1’000, x5’000) emphasises the interface between the fibres and the silica matrix. The granular structure starts to appear.
x1’000 - SIL 1 x1’000 - SIL 2
x5’000 - SIL 1 x5’000 - SIL 2
x10’000 - SIL 1 x10’000 - SIL 2 Figure 9: Microporous silica matrix.
In Figure 8 and Figure 9, the porosity with a characteristic size of 2 µm mainly due to inter-faces fibres/matrix and the cracking of the skeleton are shown.
Figure 10: SEM image - Pore Size Distribution. (Source: ZAE/Wacker)
The SEM image presented in Figure 10 illustrates the net-like structure of fumed silica grains.
At this scale, the fine porosity is clearly shown.
The artist’s depiction of the gas molecules simulates the 70nm (mean free path of air) sized pores in the material.
2.2 Mechanical
Properties
2.2.1 Curing
The samples have been tested according to the following curing conditions.
- First, as for easier handling, only VIP samples (cores wrapped in the film) have been sent from the manufacturers, the mechanical tests were performed one day after the opening of the film and the cutting samples of size 50 mm x 60 mm. This condition is defined as the “initial condition” or condition 1.
- For the second condition, samples are stored in stable laboratory conditions: 23°C & 50% of Relative Humidity (RH) for 13 days and then tested. This curing defines the condition 2.
2.2.2 Compression tests
The tests were performed according to the French standard NF T 56 101 “Alveolar Products made with elastomer or polymer: compression test of rigid material”.
The parameters of the test are as follows: - Speed: 10 mm/min
- Sample geometry L x l x e: 60 mm x 50 mm x 20 mm - Number of samples: 4
The compression stress was measured at 10, 25 and 40% of deformation. The results are summarised in Table 6 and Table 7.
Table 6: Results at 23°C – Initial Conditions or Condition 1.
Material Compression Stress
kPa
10% 25% 40%
SIL 1 142 408 835
SIL 2 108 325 630
In dry conditions, the silica core materials fulfil the requirement for main building applications such as sub-floor heating.
Table 7: Results at 23°C and 50% RH or Condition 2.
Référence Compression Stress
kPa
10% 25% 40%
SIL 1 92 264 555
By comparing results in Table 6 and Table 7, the effect of moisture on compression stress is clearly shown, the reduction is about 35% for SIL 1 and 20% for SIL 2.
2.2.3 Three Point Flexion Test
The tests were performed according to the French standard NF T 56 102 “Alveolar Products made with elastomer or polymer: flexion test of rigid materials”.
The parameters of the test are as follows: - distance between points: 230 mm - speed: 5 mm/min
- geometry of sample L x l x e: 300 mm x 110 mm x 20 mm - number of samples: 4
Results are presented in Table 8 and Table 9.
Table 8: Results at 23°C - Condition 1.
Material Breaking Stress
kPa Flexion Modulus MPa Deformation % SIL 1 28.7 8.93 0.59 SIL 2 38.6 2.34 3.24
Table 9: Results at 23°C and 50% RH - Condition 2.
Reference Breaking Stress
kPa Flexion Modulus MPa Deformation % SIL 1 13.29 2.94 0.8
SIL 2 20.66 not measured not measured
Table 9 clearly shows the extremely low cohesion of the material but as soon as it is com-pressed under vacuum inside the envelope; this weakness is no more critical.
As for compression, the moisture has an important effect on flexion properties, a reduction of 50% is found for the SIL 1 product.
2.2.4 Thermal Dilation
The dimension of the sample is as follows: 250 mm x 30 mm x 25 mm. Two glass beads are glued on the sample with a distance, L0, of 200 mm. Then, the sample is hung in a climatic
Temperature steps of 30°C each are applied between -20°C and 190°C. For each step, about one hour, the distance L is measured.
Due to the weakness of samples, the uncertainty in the results is very high.
-20 0 20 40 60 80 100 120 140 160 180 200 0.000 0.002 0.004 Fumed Silica 1 CSTB Fumed Silica 2 CSTB E x pans io n 10 -3 m/m Temperature °C
Figure 11: Thermal Dilation.
Table 10: Thermal Dilation.
Material Thermal dilation
°C-1
Fumed Silica 1 CSTB 10.10-6
Fumed Silica 2 CSTB 15.10-6
2.3 Hygro-Thermal
Properties
2.3.1 Water Vapour Adsorption
This test was performed according to the standard EN ISO 12571 “Hygrothermal perform-ance of building materials and products – Determination of hygroscopic sorption properties”. Before testing in the laboratory at controlled temperature of 23°C, samples have been dried at 105°C to constant weight in order to define the reference dry mass. Then, the samples were stored and regularly weighed in climatic chamber at respectively: 30, 50, 75 and 95% of relative humidity.
The increase in the sample weight at each step allows the calculation of water content by mass (kg/kg).
The results are summarized in Table 11 & Table 12 and plotted in Figure 12. In this figure, the experimental points are fitted with the equation (2), presented in [4]:
C RH B RH A RH u + ⋅ + ⋅ = 2 (2)
u: mass water content (kg/kg) A, B, C: fitting coefficients, RH: Relative Humidity 0<RH<1
Table 11: Adsorption Isotherms – Experimental results.
Relative Humidity
RH
Mass Water Content
kg/kg SIL 1 SIL 2 0.00 0.000 0.000 0.30 0.013 0.017 0.50 0.030 0.032 0.75 0.055 0.057 0.95 0.198 0.172
Table 12: Desorption Isotherms – Experimental Results.
Relative Humidity
RH
Mass Water Content
kg/kg SIL 1 SIL 2 0.95 0.198 0.172 0.75 0.112 0.103 0.50 0.035 0.039 0.30 0.017 0.020 0.00 0.000 0.000
0.0 0.2 0.4 0.6 0.8 1.0 0.00 0.02 0.04 0.06 0.08 0.10 0.12 0.14 0.16 0.18 0.20 Fumed Silica 1 CSTB adsorption desorption Wat e r Co nt e n t kg /k g Relative Humidity 0.0 0.2 0.4 0.6 0.8 1.0 0.00 0.02 0.04 0.06 0.08 0.10 0.12 0.14 0.16 0.18 0.20 Fumed Silica 2 CSTB adsorption desorption Wa ter C o n tent kg/k g Relative Humidity
Figure 12: Adsorption & Desorption Isotherms at 23°C and fitted curves.
Table 13: Fitting parameters for SIL 1 & SIL 2 adsorption-desorption Isotherms.
Adsorption A B C Desorption A B C
SIL 1 CSTB -40.1 25.42 16.86 SIL 1 CSTB 32.23 -64.55 37.03
SIL 2 CSTB -43.2 35.8 10.51 SIL 2 CSTB 18.26 -40.15 27.15
For comparison, adsorption data form NRC and ZAE-Bayern have been added in Figure 13 and a new fitting curve is suggested to plot the moisture content versus relative humidity:
f RH g 2 1
e
RH
t
RH
t
u
⋅+
⋅
=
(3)0.0 0.2 0.4 0.6 0.8 1.0 0.00 0.05 0.10 0.15 0.20 0.25 Fumed Silica 1 CSTB Fumed Silica 2 CSTB Fumed Silica NRC Fumed Silica ZAE
Wa ter co n ten t kg/k g Relative humidity
Figure 13: Comparison of experimental results from CSTB, NRC and ZAE-Bayern and the new fitting curve.
Table 14: Fitting parameters for SIL 1 adsorption Isotherms.
t1 t2 g f
0.01721 0.08356 2.82429 2.26663
Figure 13 shows that SIL 1 & SIL 2 samples are very similar and results from the three laboratories are very close to one another.
On one hand, for low humidity (RH < 60%), the amount of adsorbed water is low (u < 5%) and the sorption isotherm can be approximated by a linear relationship. In this range, water molecules (average size ∼ 0.3 nm) only cover the surface of the silica grains by adsorption [2] [5] (Figure 10).
On the other hand, for high humidity, from 60 up to 95%, there is an exponential increase mainly due to the capillary condensation in the small pores. Indeed, according to the Kelvin-Laplace law, at 95%, all the pores with a size smaller than 20 nm are filled with water.
2.3.2 Thermal Conductivity and Radiative Properties
In porous and cellular materials, heat is transferred through four distinct mechanisms: con-vection (
λ
c), conduction through solid (λ
s) and gas phases (λ
g) and radiation (λ
r) [6]. The three modes should be considered simultaneously. However, in order to simplify the treatment, the standard approach is to assume that all the three mechanisms act in parallel, and the equivalent overall thermal conductivity λe is considered to be the sum of the four distinct modes:- gas convection: λc - solid conduction: λs - gas conduction: λg - radiation: λr r g s c e
λ
λ
λ
λ
λ
=
+
+
+
(4)With regard to cell or pore size, generally smaller than 1 µm, and temperature occurring in building, the Grashof number indicates that convection is nonexistent.
Consequently, at ambient pressure, in porous silica materials, the main contributions are: - the solid conduction
- the gas conduction (air: 0.025 W/(m⋅K) in molecular regime) - and the radiation.
2.3.2.1 Dependence on Pressure
The thermal conductivity versus pressure and temperature was measured using the hot-wire probe method [7] described in the European Standard EN 993-15: Methods of test for dense shaped refractory products - Part 15: Determination of thermal conductivity by the hot-wire (parallel) method.
The thin hot-wire probe is placed between two samples of size 80 mm x 150 mm. Then, the “sandwich” is put in a climatic chamber with a controlled temperature at 30°C. The pressure in the chamber was measured using a Baratron Gauge and the climatic chamber was in-stalled in a laboratory at 23°C and 50% relative humidity.
The results are shown in Table 15 & Table 16 for both samples.
Table 15: Sample SIL 1.
Pressure hPa Thermal Conductivity 10-3 W/(m⋅K) 0.015 4.4 0.036 4.7 0.890 5.7 6.900 6.5 110.000 9.4 204.000 11.2 500.000 15.2 990.000 19.1
Table 16: Sample SIL 2. Pressure hPa Thermal Conductivity 10-3 W/(m⋅K) 0.014 4.3 0.030 4.6 0.160 4.7 0.950 5.2 9.800 6.0 51.000 7.3 107.000 8.7 403.000 12.8 1000.000 20.8
In Figure 14, the experimental data obtained by CSTB for the fumed silica samples SIL 1 and SIL 2 are compared with the results published by ZAE-Bayern [8] [9] for a fumed silica sam-ple provided by the manufacturer of SIL 2. At ZAE, the measurement was performed at 10°C instead of 23°C at CSTB, which yield slightly smaller values (see temperature dependence in Figure 15). Additional results for PU foam and precipitated silica are plotted only for compari-son. 1E-3 0.01 0.1 1 10 100 1000 4 8 12 16 20 24 28 Fumed Silica 1 CSTB Fumed Silica 2 CSTB Silica CSTB Fumed Silica ZAE PU Foam T h erma l co ndu ct iv it y 10 -3 W/m.K Pressure hPa
Figure 14: Thermal Conductivity versus pressure.
n 0 g g
K
A
2
1
+
⋅
=
λ
λ
(5)δ
m nl
K
=
is the Knudsen number and A, a constant close to 1.5.The Knudsen number is the ratio between lm , the mean free path of air molecules and δ, the characteristic size of pores.
On one hand, as the porosity of silica core is very high (> 90%), the gas contribution will play an important role at ambient pressure.
On the other hand, considering the narrow pore size in porous silica, the free air conduction λg0 is reduced due to the Knudsen effect (interaction between gas molecules and pore walls). The gas conduction in such confined media can be written as follows [10] [11]:
The mean free path can be estimated using the following equation [12]:
g 2 g m
P
d
2
T
k
l
⋅
⋅
⋅
⋅
=
π
(6)T is the temperature (K), Pg the gas pressure (Pa), dg the diameter of the gas molecule (3,53⋅10-10 m) and k the Boltzman’s constant (1,38066.
10-23 J/K).
In normal conditions, (23°C, 1 atm.), the mean free path of air is about 70 nm. A fit according equation (5) to the measured data yields for the fumed silica boards a characteristic pore size δ of about 300 nm. Both values are in the same order of magnitude. Thus even at ambi-ent pressure the air conductivity will be strongly influenced by Knudsen effect.
From equations (5) and (6) the thermal conductivity of air in confined porous media can be written as follows: g 0 g g
P
T
.
C
1
)
T
(
⋅
+
=
δ
λ
λ
(7)This formula emphasizes the three main parameters, which play a great role for heat transfer in porous media:
- the gas pressure Pg
- the characteristic size δ - the temperature T.
According to the equation (7), the gas conduction depends strongly on the product δ x Pg. It means, that if micro or nano-structured materials with a small pore size δ are used as VIP cores, only a weak vacuum is required to reach a low thermal conductivity.
From equations (5), (6) and (7) the equivalent thermal conductivity of the core in practice is often described by the simplified formula:
g 2 / 1 0 g evac
P
P
1
+ + =λ
λ
λ
(8)λevac: the thermal conductivity in the evacuated state,
P1/2: a fitting pressure.
Applying this formula for the investigated samples (Figure 14), we obtain the fitting parame-ters presented in Table 17.
Table 17: Sample SIL 2.
λ 10-3 W/(m·K)0 P1/2 hPa Fumed silica 1 CSTB 5.36 686.0 Fumed silica 2 CSTB 5.17 665.0 Precipitated silica CSTB 5.27 198.0
Fumed silica ZAE-Bayern 3.64 630.0
PU Foam 4.30 2.6
2.3.2.2 Dependence on temperature
The measurements were performed at a pressure of 0.01 hPa. At this low pressure, we can consider that the sample is dried and the thermal conductivity of the remaining gas mole-cules is negligible.
The effect of temperature on thermal conductivity is generally described using the following equation:
E
T
n
3
16
)
T
(
3 2 sσ
λ
λ
=
+
(9)E (m-1) is called the extinction coefficient and it can be estimated by fitting the experimental data, λ is the solid conductivity (W/(m·K)), σ the Stefan-Boltzman constant
280 300 320 340 360 380 400 420 440 460 480 500 0.002 0.003 0.004 0.005 0.006 0.007 0.008 Fumed Silica 1 CSTB Fumed Silica 2 CSTB Fumed Silica ZAE Precipitated Silica ZAE
Th erma l con d u ct iv it y 10 -3 W/m .K Temperature K
Figure 15: Thermal conductivity versus temperature.
In Figure 15 the experimental points and the fitted curves obtained for SIL 1 & SIL 2 samples are plotted and compared with results from ZAE-Bayern obtained for fumed silica similar to SIL 2 sample and a precipitated silica [13] [14].
For the comparable samples SIL 2 and the similar fumed silica samples characterised by ZAE-Bayern one can notice the same behaviour with a small constant difference of 0.0005
W/(m·K).
The fitting coefficients are listed in Table 18:
Table 18: Solid thermal conductivity and extinction coefficient. λs 10-3 W/(m·K) E m-1 Fumed Silica 1 CSTB 0.0027 5154 Fumed Silica 2 CSTB 0.0032 7632
Fumed Silica ZAE-Bayern 0.0029 8589
Precipitated Silica ZAE-Bayern 0.0021 12153
The solid thermal conductivity of fumed silica appears to be close to 3⋅10−3 W/(m⋅K). The
extinction coefficient, which depends on the density, varies from 5000 up to 12000 for the precipitated silica.
2.3.2.3 Dependence on water content
At ZAE-Bayern two sets of measurements were performed to study the influence of water vapour and adsorbed water on the thermal performance of vacuum insulation panels as well as on the thermal conductivity of the core material. The material investigated is assumed to be quite similar to SIL 2. In the first set, special VIP have been produced with additional water, sprayed on the core material. The amount of water was determined by repeated measurement of the panels mass. The second set of measurements was performed with a
vacuum guarded hot plate apparatus. Water vapour in different portions was let into this device. The water content is given by the partial pressure of the water vapour (see Figure 13) and in these tests this partial pressure is the same as the total gas pressure. Thermal con-ductivity was measured as a function of the relative humidity for different temperatures. For both sets of tests, thermal conductivity was determined at steady state conditions with the guarded hot plate apparatus.
Measurements on VIP Preparation of samples:
The following procedure was applied to bring a defined quantity of moisture into the VIP: First, the core material (fumed silica pressed to a panel) was dried for 3 h at 150°C, weighed, wrapped into the laminate-envelope and evacuated and then the thermal conductivity of the dry panel was measured.
After that, the VIP was opened, the core was sprayed with a roughly defined amount of water, frozen, evacuated and the thermal conductivity was measured on the VIP with mois-turized core.
To evaluate and to check more precisely the amount of water in the core, after the thermal conductivity measurement the VIP was opened again, the moist core was weighed, once more dried (3 h at 150°C) and weighed in the dry state. The water content Xw in the VIP was
calculated from the dry mass mdry and the mass of the moist core mmoist : (Xw = (mmoist-mdry)/
mdry)).
In the following the moisture in the VIP is always indicated as water content Xw (in mass
percent with respect to the dry mass). Results:
The thermal conductivity was measured at mean temperature of 10°C, with 20°C on the hot plate and 0°C on the cold plate. The panel size was 30 cm x 30 cm x 2 cm. The results are shown in Figure 16.
0 0,1 0,2 0,3 0,4 0,5 0 2 4 6 8 10
water content [mass-%]
heat transmission
coefficient
[ W/(m
2K)]
Figure 16: Measured heat transfer coefficient versus the water content for a 20 mm thick VIP. Mean tem-perature was 10°C.
A significant increase of the heat transfer with increasing water content is observed. These measurements only apply for the specified measurement conditions and panel size. Fitting a straight line through the data in Figure 16 and converting the heat transmission coefficient into a thermal conductivity, one gets an average increase in thermal conductivity of 0,5⋅10−3 W/(m⋅K) per mass percent of water content. The total thermal conductivity of the
moist board can be considered as a function of the water content Xw.
( )
X m % K m W 10 5 . 0 X 3 w dry , VIP w ≈ + ⋅ ⋅ ⋅ − − λ λ (10)Although equation (10) only applies for the mentioned conditions it allows to estimate the influence of moisture on the thermal conductivity.
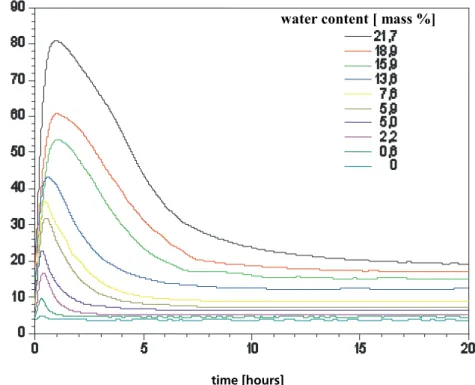
The above results give the thermal transmission coefficient under terms of stationary condi-tion. Another interesting aspect is the development of the measurements with time. At the beginning of the measurements high heat flows arise. This increased heat flows are caused by the vaporization with transport of the phase change enthalpy. The transient behaviour when the temperature gradient is reversed by turning around the panel, is illustrated in Figure 17, which depicts an “apparent thermal conductivity“ calculated with the actual power feed into the panel.
time [ hours ]
water content [ mass %]
a ppa rent t h erma l co nduct iv it y [ 10 -3 W /(m K ) ]
Figure 17: „Apparent thermal conductivity“ developing by the time for a VIP (30 x 30 x 2 cm³) with different water contents. Mean temperature was 10°C.
Measurements on the core material
A second set of measurements not on specially prepared VIP but on the core material were performed with a guarded hot plate apparatus that can be evacuated. Water vapour in differ-ent portions was let into this device. The water contdiffer-ent is given by the partial pressure of the water vapour (see Figure 13) and in these tests this partial pressure is the same as the total gas pressure. Thermal conductivity was measured as a function of the relative humidity for different temperatures. The relative humidity is given by the ratio of the measured gas pres-sure and the calculated saturation water vapour prespres-sure.
apparent thermal
conductivi
ty [10
-3 W/(m K)]
0 2 4 6 0 10 20 30 40 50 60 0 1 2 3 water content [ mass -% ] temperature 50°C temperature 40°C temperature 30°C temperature 20°C temperature 10°C relative humidity = pH 2O /psat [ % ] ther mal c onduc ti v ity λ [10 -3 W/( m K) ]
influence of water on the thermal conductivity at different temperatures
Figure 18: Measured thermal conductivity versus different water vapour pressures, depicted as relative humidity. Additional parameter is the mean temperature. Typical temperature gradient was 20 K on the samples with a thickness of about 18.5 mm.
0 2 4 6 8 0 10 20 30 40 50
measured for water vapor measured for dry nitrogen
fit for the nitrogen data (up to 50 mbar): λ=4.4+25.5/(1+a/pgas) yielding a=593 rh=3%
rh=21%
rh=53% temperature: 293K external load: 1bar
gas pressure pgas [ mbar ]
th ermal cond uctivity λ [ 10 -3 W/ (m K) ]
influence of dry air and water vapor
Figure 19: Thermal conductivity measured for different gas pressures of dry nitrogen and of water vapour at a mean temperature of 20°C. Additionally the corresponding relative humidity is depicted at the values given for the atmosphere of water vapour.
2.3.3 Specific Heat
The dependence of specific heat on temperature was measured using a differential scan-ning calorimeter SETARAM DSC 92.
The experimental parameters are the following: - Initial Temperature: 30°C
- Final Temperature: 200°C - Temperature step: 5°C
- Step duration: 480 s
- Heating rate: 2°C/min
- Number of cycles: 34
The results are listed in Table 19 and presented in Figure 20. The mean value is about 850 J/kg K for each material.
Table 19: Specific Heat. Temperature °C Specific Heat J/kg.K SIL 1 SIL 2 43 726 648 53 895 922 58 935 908 73 811 938 83 890 902 103 786 802 123 822 852 143 761 849 153 788 794 168 996 877 178 915 921 40 60 80 100 120 140 160 180 200 400 600 800 1000 1200
1400 Pyrogenic Fumed Silica 1 CSTB Pyrogenic Fumed Silica 2 CSTB
He at ca pac ity J/ kg. K Temperature °C
Figure 20: Specific heat versus temperature.
The specific heat of dry materials does not vary significantly versus temperature in the range 40-180°C.
2.4 Gas
Permeability
The intrinsic gas permeability k (m²) of a porous material is defined by the Darcy’s law [15] and [16]:
L
P
k
v
∆
η
−
=
(11) v: fluid velocity m/sη: dynamic viscosity Pa.s L: thickness m
P: pressure Pa
The fluid flow Q = v A through a media of thickness L and section area A is written:
L
P
.
A
k
Q
∆
η
−
=
(12)Then, the intrinsic permeability k is as follows:
P
L
.
A
Q
k
∆
η
−
=
(13)and the gas permeability Kg (s-1):
g g g
k
K
η
ρ
=
(14)ρg (kg/m³) is the gas density and ηg (Pa s) the dynamic viscosity of the gas.
The air permeability depends on the water content through relative permeability krg(u) which
ranges between 0 and 1:
)
(
k
.
K
K
=
g rgτ
(15)The tests were carried out according to the French Standard NF B 20-104: “Insulating prod-ucts made with mineral fibres – Felts, mats and panels - Determination of air permeability”. The samples were cylinders of diameter, ∅ = 110 mm and variable thickness depending on the tested samples (about 20 mm). The measurements were performed only for dry materi-als, thus the relative permeability krg is equal to 1. The results, listed in Table 20, show that both materials have a similar and very low intrinsic permeability.
Table 20: Intrinsic Permeability
Reference Intrinsic Permeability
x10-15 m² ∆P bar SIL 1 2.6 0.98 SIL 2 3.0 1.01
2.5 Fire
behaviour
The fire behaviour of both core materials is characterised by two techniques:
1: The fire reaction using the radiation test described in the French Standard NF P 92-501: Protection against Fire – Building – Fire reaction testing of materials – Radiation test for rigid materials or equivalent (glued coating materials) and soft materials with a thickness higher than 5 mm.
2: The measurement of the gross calorific value according to the French Standard NF P 92-510: Protection against Fire – Building – Fire reaction testing of materials – Determination of gross calorific value.
The sample sizes were 40 cm x 30 cm and the tests provide information about: - the fire behaviour rating,
- the calorific value.
The results are listed in the Table 21.
Table 21: Fire reaction testing
Reference Fire reaction rating Calorific Value
kJ/kg
SIL 1 non flammable -206
SIL 2 non flammable 1204
The negative calorific value of SIL 1 results from an endothermic reaction and due to the absence of any combustible products inside.
For SIL 2 the positive calorific value ensues from some organic materials, certainly the fibres. This result confirms the SEM analysis that shows soft fibres in SIL 2.
Remarks: The mean calorific value of rock wool is lower than 1’000 kJ/kg and lower than 1500 kJ/kg for glass wool.
2.6 Thermo Gravimetric Analysis (TGA)
For this analysis, the temperature ranges from 30°C to 1000°C with a temperature step of 10°C/min. Nitrogen is used up to 700°C and oxygen from 700 to 1’000°C.
For both materials, the weight loss is lower than 2% between 30 and 100°C; it corresponds to the desorption of water. Between 100 and 1’000°C, the weight loss is only 1% for SIL 1
whereas it is more than 5% for SIL 2 between 250 and 450°C. This difference is certainly due to the nature of fibres that seems to be different from each other.
Figure 21: Thermo Gravimetric Analysis - SIL 1
2.7 Summary
“Core”
Both materials SIL 1 & SIL 2 investigated in this study are comparable fumed silica with minor differences, especially the nature of fibres that are used for reinforcement.
For both materials, the porosity is higher than 90% and the specific area higher than 200 m2 /kg. The densities are slightly different, 160 and 190 kg/m3 respectively.
At low pressure (0.01 hPa), the effective thermal conductivity that is mostly due to the solids is close to 3⋅10−3 W/(m⋅K) whereas this value rise up to 20⋅10−3 W/(m⋅K) at ambient pressure
in dry condition.
The compression strength of core should be high enough to allow the application of VIP for sub-floor heating applications. Nevertheless, the flexion resistance and cohesion are very weak and consequently the handling of core requires special attention.
Finally, these nano-structured materials are very sensitive to moisture. Due to the high specific area and the small size of pores, these materials are nice getters for gases, espe-cially for water vapour. Consequently a significant influence of adsorbed water and of water vapour on the thermal conductivity was found, that causes an increase of 1 to 2⋅10−3 W/(m⋅K)
3 Envelope
3.1 Objectives
The most critical component of a Vacuum Insulation Panel (VIP) is the outer coverage, which is responsible for the maintenance of the vacuum inside the panel. As a standard, polymer film laminates are used for this purpose. The permeability of these laminates is the determin-ing criterion for the shelf life of the panel because the pressure in the panel may not rise above 100 mbar after 30 – 50 years.
The objective of this section of the investigation was the characterization of the currently used laminates in terms of measured transmission rates, especially for water vapour. The impact of different parameters such as temperature, moisture, ageing and production proc-ess should be examined.
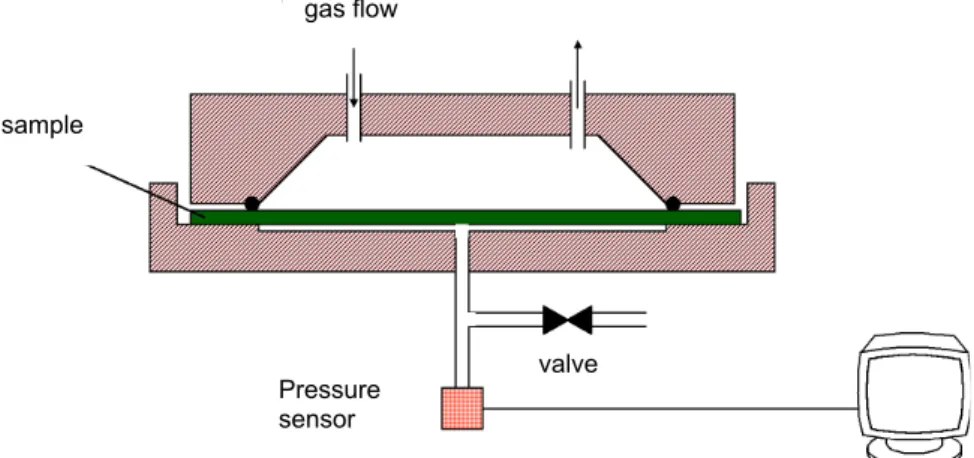
In building applications a shelf life of at least 30 - 50 years is required for the panel. Derived from that and taking into account that certain core materials may act as moisture absorbers (getters) the permeability of the laminate has to be below ~10-2 cm³/(m² d bar) bar for the oxygen transmission rate (OTR) and ~10-4 g/(m² d) for the water vapour transmission rate (WVTR), which is not yet possible to achieve. State-of-the-art standard equipment has a measurement limit of about 10-2 g/m² d for WVTR. Therefore the task was the development of permeability measurement equipment with a sensitivity limit of at least 10-4 g/(m² d).
3.2 Theoretical
Background
3.2.1 Introduction
Polymer films containing inorganic barrier layers have become increasingly important to the packaging industry owing to numerous advantages over other materials with respect to convenience, economy and even environmental issues. However, comprehensive knowledge of the barrier mechanisms is required to select them for the appropriate packaging use. Meanwhile, extensive studies led to a well-accepted model for the permeation of oxygen through polymer films containing an inorganic barrier layer, as Al or SiOx. Current
under-standing of the permeation mechanism of water vapour is nothing better than a working hypothesis.
3.2.2 Permeation through polymer films
The permeation mechanisms of gases and water vapour through pure polymer films depends on
- how many molecules can be dissolved in the polymer, e.g. the solubility coefficient S of the permeating substance through the polymer and
- how fast the molecules can move inside the polymer, e.g. the diffusion coefficient D. The permeability P is given by their product, P = D x S, in first approximation taken as con-stants, as to be seen in Figure 23.
After laminating different polymer films together, the total permeability (Ptotal) can be
calcu-lated from the individual permeabilities (P1, P2, ...) of the components by the simple equation,
also used for conductivities in series as the electrical analog of (Kirchhoff’s Law): P-1total = P-11 + P-12 + ...
The driving force is the difference in gas concentration between both sides of the polymer film. Different substances can be assumed to permeate homogenously through the lami-nates.
Figure 23: Permeation mechanism (schematic) through a laminate containing two homogenous polymers.
Figure 24: Permeation mechanism (schematic) through a three layer stack containing an inorganic barrier layer.
3.2.3 Permeation through vacuum web coated barrier layers
The oxygen permeation through vacuum web coated barrier layers, like Al, AlOx, SiOx and
also Melamine, predominantly occurs at macroscopic defects in the range of 0,1 µm² to 1 µm² ([31], [32]). There is practically no permeation through the bulk material of the layers, as to be seen in Figure 24.
There is another mechanism for the permeation of water vapour through the barrier layers due to non-linear effects, mainly generated by high solubility/condensation of substances that can either be really dissolved in the polymers or condensed in capillaries (water). Capillaries can form at microscopic defects and grain boundaries. In contrast to oxygen permeation dominated by the macroscopic defects in the barrier layer, the permeation of water vapour depends also on the microstructure of the layer.
For oxygen, the macroscopic defects in the vacuum coated barrier layers are the bottlenecks for permeating molecules. Due to the sideways diffusion to and from the bottlenecks in the polymer layers (substrate film or adhesive) next to the barrier layer, the polymer close to the defects influences the total permeability much stronger than at the outsides of the laminate [32]. Hence, many small holes in a barrier layer are much more efficient in compromising the system’s barrier properties than a few large holes with the same total area.
Due to capillary effects in the barrier layer, water vapour can also permeate at microscopic defects and maybe grain boundaries. A higher density of these diffusion channels reduces the impact of the sideways diffusion in the polymer layers next to the barrier layer. There is a lower synergy in permeation barrier between the barrier layer and the attached polymer for water vapour than for oxygen.
![Figure 3: The small pore size of fumed silica or aerogels do reduce gas conductivity even at ambient pressure [1]](https://thumb-eu.123doks.com/thumbv2/123doknet/14182603.476561/12.892.140.694.192.572/figure-small-silica-aerogels-reduce-conductivity-ambient-pressure.webp)