E L S E V I E R Desalination 114 (1997) 241-251
DESALINATION
Study of a new technique for fluoride removal from water
H. Lounici a, L. Addour a, D. Belhocine a, H. Grib a, S. Nicolas b, B.
Bariou b,
N. Mameri a*
aLaboratoire des biotechnologies, D~partement de g~nie de l'Environnement, Ecole Nationale Polytechnique, 10 avenue Pasteur, El Harrach, Alger, Algdrie
bLaboratoire du g~nie des procddOs, D~parteraent de Chimie, IUT de Rennes, rue clos Courtel, 35000 Rennes cedex, France
Received 27 August 1997; accepted 30 September 1997
Abstract
A new technique based on the combination of an activated alumina column and an electrochemical system for fluoride removal from water is reported in this study. In the first step, the optimization of the process was achieved under various experimental parameters (volumetric flow, temperature, pH, initial fluoride concentration and hardness) with a synthetic solution. The comparison of the performance of the current activated alumina process and the electrosorption system proved to be more efficienct than the latter in removing fluoride from water. Thus, the fluoride sorption capacity at the breakthrough point of the activated alumina column reached 3.Smg F-/L. It was increased by about 60% by means of the electrochemical process than the results obtained in current mode. Moreover, it was found that the electrosorption system could be utilized to regenerate the saturated activated alumina. In the second step, the electrosorption process was utilized to treat Sahara drinking water naturally contaminated with fluoride (3 mg/L) under optimum conditions previously determined. The electrosorption process coupled with activated alumina column has been successfully applied for fluoride removal from drinking water.
Keywords:
Electrosorption; Fluoride; Activated alumina; Optimization; Drinking water; Treatment1. I n t r o d u c t i o n
The excess o f fluoride in ground water is found in many regions. Indeed, fluoride concen-
*Corresponding author. Current address: l~cole Poly- technique of Montreal, Department of Civil Engineering, PO Box 6079, Station Centreville, Montreal, Quebec, Canada H3C 3A7. Tel. +1 (514) 340-4800; Fax +1 (514) 340-3981.
trations which did not comply with the national requirement were measured in Africa [1-4], America [5], Europe [6,7] and Asia [8-10]. Fluorosis is caused by an excess ingestion of fluoride and has caused a serious health problem for the population. For example, 25 million people in 15 states o f India are affected by this disease [8].
0011-9164/97/$17.00 © 1997 Elsevier Science B.V. All rights reserved P// S0011-9164(98)00016-2
2 4 2 t~ Lounici et al. / Desalination 114 (1997) 241-251
Several de fluorination methods were developed to remove fluoride and improve the quality of drinking water. The first techniques were based on chemical precipitation, ion- exchange and adsorption phenomena [7,9,11-17]. Recently other defluorination techniques based on electrolysis [ 1,18,19] and membrane processes [5] were developed.
The fluoride adsorption by an activated alumina (AA) column appeared to be an interesting process compared to other techniques [2,5,7,11]. Indeed, the AA has a good capacity and selectivity for fluoride removal. Moreover, the main characteristics of AA indicate interesting chemical and mechanical properties [4,7,11].
The electrosorption processes have already been used for the separation of nHexanol and nitrobenzene in aqueous solutions [20] and for the adsorption of mixture of quinon on graphite electrode [21]. The previous electrosorption studies [20,21] used the graphite and the carbon column as a working electrode.
To enhance the adsorbent capacity, the electrosorption technique was used in the present study. Stainless steel electrodes (working and auxiliary) were only used to create an electric field in the AA column. The electric field effect on the mechanism and the performance of the uptake were tested under various experimental conditions by varying fluoride concentrations, volumetric flow rates, pH, temperature and hardness of the water.
1.1. Adsorption
Equilibrium isotherms may be attributed to theoretical or empirical models proposed by many authors who have established a relationship between a fixed adsorbed mass and the solution concentration (Ce) at the equilibrium state [22]. Isotherms are usually interpreted by monolayer adsorption or by multilayer adsorption. The monolayer adsorption may be represented by the Langmuir equation (1) which can be transformed
to linear form [ E q . ( 2 ) ] :
X / m -
Qm'b'Ce
1 ÷b.C e
(1)
Ce
1 CeX / ~ - Qm .---~ + QZ
(2)
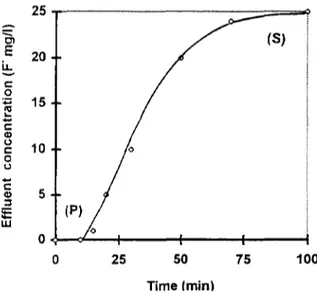
Adsorption through a packed bed may be explained by the exchange zone method (EZM) developed for a fixed-bed ion exchange [23] and extended to the fixed-bed adsorbent [24]. This model is based on a simplified method of interpreting the kinetic data in a fixed bed represented by the characteristic S curve commonly called the breakthrough curve (Fig. 1). The breakthrough point P is attained after the time, tp. For industrial applications, adsorption columns are used in a series and a column is used in the process until its saturation at time, ts, when the effluent concentration reaches the feed concentration. Parameters tp and t s are linked by a linear relationship to the breakthrough volume
(Vp) and the saturation volume (vs) which are
2 5 , , , ~ , E 20
u.
e'- Q,~
15 C c 1 0 0 t~ eo 5 E UJ 0 100 )( P ) /
25 50 75 T i m e / m i n iFig. 1. Breakthrough curve for fixed bed. (P) break- through point and (S) saturation or exhaustion point.
H. Lounici et al. / Desalination 114 (1997) 241-251 243 collected at the bottom of the adsorbent column
at time tp and t s , respectively. The interpretation of the operation and performance of the fixed bed may be evaluated by several characteristic parameters determined by using the breakthrough curves and a graphical integration of Eqs. (3) and (4). Thus, the adsorption capacities at the break- through point (Xp) and saturation point (Xs) of the fixed bed have been used to interpret the performance of the adsorption column. Xp and X s
may be defmed as the ratio of the quantity of solute adsorbed at the breakthrough and saturation points, respectively.
" (Co-C)d
0(3)
" (Co-C)d
x s = f
m
0(4)
the most appropriate activated alumina form for the defluorination operation, experiments in batch mode were performed.
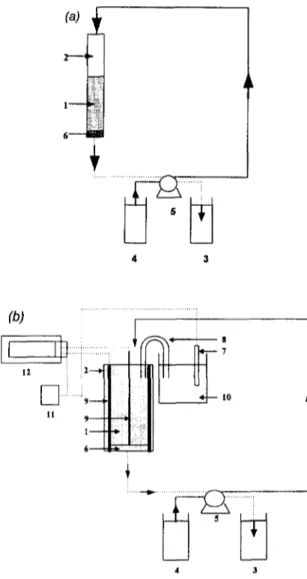
Defluorination of water by means of AA columns was achieved in flow continuous mode. Two adsorption cells realized in the laboratory were utilized (Fig. 2). The first cell consists in the electrosorption cell equipped with two stainless
4 3
The fractional capacity of the bed (F) was defined as the ratio between the quantity of adsorbent eliminated and the theoretical capacity existing between the breakpoint (P) to saturation point (S). Parameter F is calculated according to Eq. (5) and is used to characterize the efficiency of the activated alumina to bind fluoride ions from ground water.
vs (Co-C) dv F = f Co'V~
v.
(5)
2. Material and methods
Three activated alumina species (acid, basic and neutral) with a particle size of 63-200 mm (purchased from Merck-Paris, France), were soaked overnight in distilled water before the commencement of each experiment. To determine
7
1 0
... ~ . . . ....
4 3
Fig. 2. Schematic experimental systems. (a) electro- sorption process, (b) current adsorption process. 1 activated alumina, 2 column, 3 filtrate tank, 4 feed tank, 5 peristaltic pump, 6 glass wool, 7 reference electrode, 8 bridge, 9 stainless steel electrodes, 10 KCI saturated solution, 11 millivoltmeter, 12 potentiostat.
244 H. Lounici et al. / Desalination 114 (1997) 241-251
steel electrodes utilized as working and auxiliary electrodes. These electrodes were introduced in the PVC column to produce an electric field in the AA bed. Electrochemical potential was main- tained constant by means of a Tacussel PRT20- 2X potentiostat. The electrochemical potential applied during each experiment was measured by means of saturated calomel electrode (SCE), as reference, and the working electrode. To avoid the water dissociation phenomenon, the electro- chemical potential was limited in the range of - 860mv to 1000 mv/SCE. The comparison of the performance of the electrosorption process and current AA column was achieved by means of a second cell which had similar dimensions (diameter: 2cm; length: 20cm) to the electro- sorption column. With the column diameter being about 100 times larger than the diameter of the AA granules (20/0.2), the wall effect was thought to be negligible [25].
A synthetic fluoride solution was prepared with distilled water and NaF salt purchased by Prolabo (Paris, France). This solution was fed by the top side of the column, and the filtrate was collected at the bottom by means of a peristaltic pump (Watson Marlow 503U with 2 channels). The experimental temperature was maintained constant at 25 °C during the experiments using an MK70 thermostatic control apparatus.
Experiments in batch mode were carried out in a reactor with a reactionnal volume of 500 ml. A known mass of AA was maintained in contact with fluoride solutions. The equilibrium curves were established by following the evolution of the residual fluoride concentration at equilibrium
(Ce).
For the continuous defluoridation operation by the AA columns (with and without the electro- chemical system), the fluoride concentration was determined at regular and short intervals during each experiment for the determination of the breakthrough curve.Fluoride analysis was achieved using the iono- metric method with specific fluoride electrode PF4L from Tacussel. To prevent interfering ions (AI 3+, Fe 3÷, Cu 2+, Ca2+,...), TISAB buffer at
pH 5.5 was added into the samples. Calcium and magnesium analysis were achieved by means of Unicam-Philips SP19 atomic absorption. Sodium and potassium concentrations were determined using Perkin-Elmer Coleman 59 Ca flame photo- metry while chloride concentration was obtained by specific chloride electrode with the ionometric method. Bicarbonate HCO~ concentration was determined by the volumetric method using the chloride acid (HCI N/35) [26].
The optimization of the novel process was performed under various experimental conditions to examine the effects of electrochemical potential, volumetric flow rate, temperature, pH, hardness and fluoride concentration.
3. Results and discussion
3.1. Fluoride adsorption capacity of the AA
species
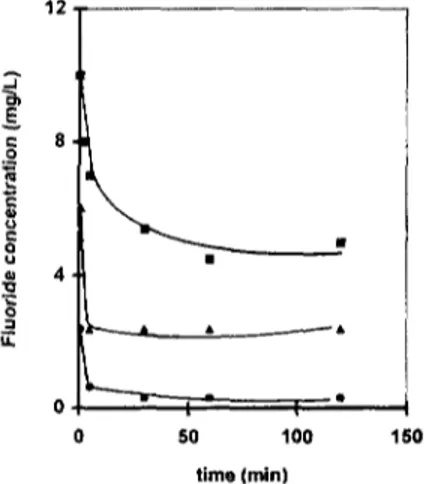
The results obtained with the three AA species presented in Fig. 3 permitted the deduction that the acid form of AA was the most appropriate to remove the fluoride ions from water. The deter- ruination of the fluoride adsorption mechanism on the acid AA was performed by establishing the
12 o: (J t- o o LL 8 4 • j A O, 0 50 1 0 0 1 5 0 t i m e (min)
Fig. 3. Fluoride adsorption on the three AA species in the batch reactor, m, 2g AA; reactional volume, 500 ml;
Co,
10 mg/I; pHi, 6.2; T, 20°C. O, acid activated alumina; D, neutral activated alumina; U, basic activated alumina.1t.. Lounici et al. / Desalination 114 (1997) 241-251 245 (a) A 3 LI. Cn E .~ o . 5 E E (b) 0 I I I 0 ( I I 0 I 2 3 4 1 2 3 C, (rng FVL) Ce (rag FVL}
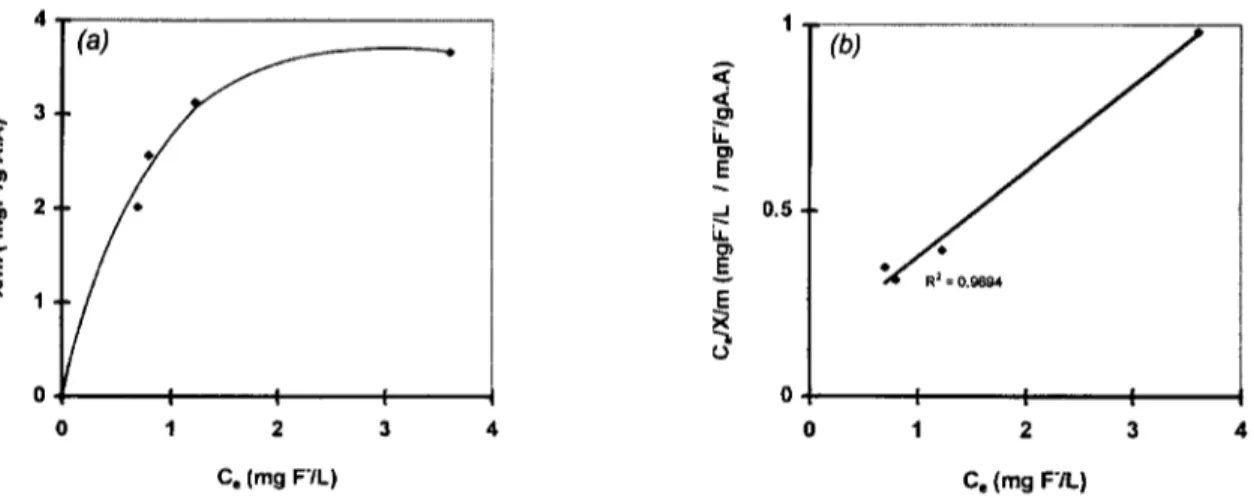
Fig. 4. Isotherm curve. Fluoride-acid activated alumina (a) and linearized Langmuir equation plot (b). Reactional volume, 500 ml; pHi, 6.2; contact time, 120 min; T, 20°C.
equilibrium curve. The results obtained, presented in Fig. 4, indicate that the F- adsorption onto AA may be represented by the type I isotherm, indicating monolayer adsorption on active sites until their saturation, as described by Ruthven [22].
3.2. Optimization o f the electrosorption process
The influence of the electrochemical potential (E) on the performance of the acid form AA was studied in continuous mode using the electro- sorption column (Fig. 2). The variation in fluoride concentration of the filtrate with time for different values o r E are plotted in Fig. 5a. These curves permitted identification of the optimum E=100mv/SCE giving the most important breakthrough time (i.e., highest water volume treated). The calculation of the fluoride capacity obtained at
tp
and t s for different electrochemicalpotentials (Fig. 5b) confirmed the improvement o f the AA column efficiency with the electro- chemical system. Indeed, operating with E in the range of 100 to 200 mv/SCE permitted increasing the capacity o f the AA column of about 60%.
The curves obtained by plotting Xp and X s against E have a similar shape to electrocapillary curves obtained by measuring the superficial tension vs E [27]. The maximum superficial
tension was attained at E 0 , commonly called the potential of zero charge (PZC). In the case of fluoride electrosorption on AA, by analogy we can consider that the potential E=+100mv/SCE is the PZC of the system fluoride-AA.
On an other hand, the evolution of the filtrate pH for different E was determined during the experiments (Fig. 5c). The curves obtained show similar shapes at different E. One can observe that the breakthrough point independent of the values of E was always obtained at a filtrate pH of about 6. Moreover, the electrosorption system permitted reducing significantly the fluoride leaks observed from the commencement of the experi- ment to the breakthrough time, tp. Indeed under E = 100mv/SCE, the fluoride leaks were in the range of 0.06 mg F-/L and were less important than those obtained with current column estimated to 0.1 mg F-/L. The utilization o f the anodic potential ranging from -400 to -860 mv/ SCE induced lowest adsorption capacities and more important fluoride leaks (0.2 mg F-/L) than the current column. This potential zone could be used for the electroregeneration of the AA columns after their saturation.
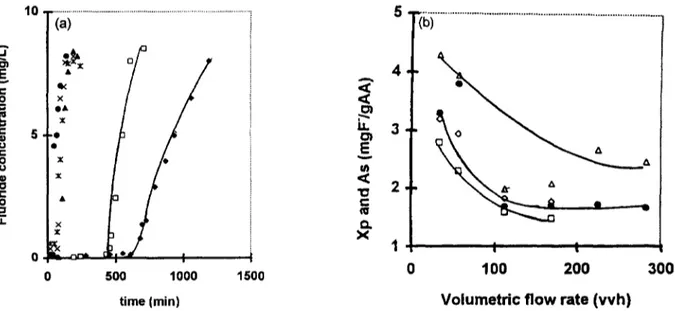
The influence of the volumetric flow rate on the performance of the electrosorption process, presented in Fig. 6, indicates that the increase of the volumetric flow rate from 30 to 100vvh
246 H. Lounici et al. / Desalination 114 (1997) 241-251 . . I la. v r " 0 C o . r . 0 . . t i1 10 -(a) 5 0 * 0 I ~.s. . x . t x x ~, x / X . A + ¢ 2 • .~ It3 ~ 0 i o o* I ¢J 1 • ~ ,,x " ÷ 1 o ~ + x Ii • , o x . • 200 400 600 800 Time (min) 'i+i ... • i I I I -1000 -500 0 500 1000 E l e c t r o c h e m i c a l p o t e n t i a l (mvlSCE) 8 ... T / ( c ) o '" ~ " I I I I 0 200 400 600 800 time (mln)
Fig. 5. Electrochemical potential effect on the performance of the AA column. Co = 10 mg/l, pHi = 5.6, H=3cm, D=56.6 vvh, T=20°C. (a): Breakthrough curves: <>, E=-860 mv/SCE; o, E= -400 mv/SCE; A, E=0 mv/SCE; x, E=+30 mv/SCE; *, E = 100 mv/SCE; O, E = +220mv/SCE, +, E=+400 mv/SCE; - , E = +616 mv/SCE; *, E=+880 mv/SCE; 0, E=+1000 mv/SCE. (b): Evolution of capacities at breakthrough point and saturated point under various electrochemical potential. B, at breakthrough p o i n t ; . , at saturated point. (c): Evolution o f the filtrate pH during the electrosorption experiments. 41,, E = +100 mv/SCE; D, E=+616 mv/SCE; A, E=-860 mv/SCE.
"iai ... 5
;
/ /
!
.
0 500 1000 1500 5 I J • o = ,T 0 4 <C ,¢ u. 3 O) E It) <¢ "o 2 C Q. X I I I 0 100 200 300time (min) Volumetric flow rate (vvh)
Fig. 6. Influence of the volumetric flow rate on the performance of the electrosorption process. Co= 10 mg/l; pHi = 5.6; H=-3cm; T=20°C. (a) Breakthrough curves. 4 , D=34 vvh; I-1, D = 56.5 w h ; A,/9=-113 vvh; x,/9 = 70 w h ; *, D = 226 vvh; o, D=283 vvh. (b) Evolution of the sorption capacities with the volumetric flow rate. Co=10 mg/l; H=3 cm; T=-20°C. • and A: Xp and X, with electrosorption column at E=100mv/SCE. [] and O: X e and ~. with current column.
H. Lounici et al. / Desalination 114 (1997) 241-251 247
provoked a drastic decrease o f the performance of the electrosorption system. Below the volumetric flow rate 100vvh, the electrosorption system reached the limiting values of Xp and X s of about 1.75 mg F-/g AA and 2.2mg F-/g AA, respect- ively. The difference between the electrosorption system and current process was observed at a lower volumetric flow rate. At a high volumetric flow rate the performance of the two processes was practically in the same order. It proved that this system was more interesting at a volumetric flow rate of about 50vvh. This value had been chosen as the optimum volumetric flow rate for all following experiments.
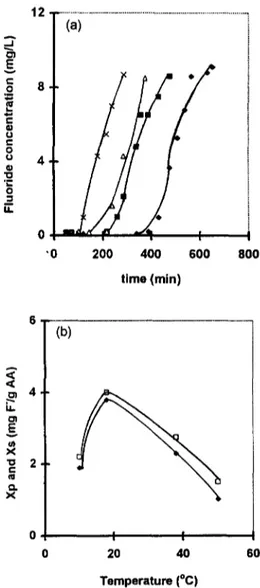
The temperature of ground waters naturally contaminated with the fluoride encountered in different regions [1,5] were in the range of 20 to 50°C. The influence of the temperature on the performance of the electrosorption process was studied. The results, presented in Fig. 7, show that an optimum temperature of about 25 °C was observed. These results may be explained by the fact that at high temperatures desorption of fluoride ions from aluminum hydroxides and less stability of the fluoroaluminium complexes [1] may occur.
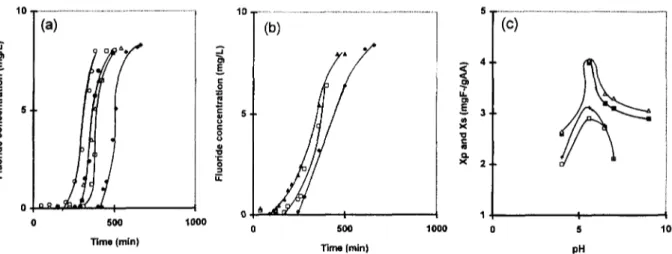
The influence o f the pH on the performance of the novel process was performed under optimum conditions previously determined. The break- through curves were plotted for different values o f pH (Fig. 8a). For both columns, the same optimum pH 5.6 was obtained. Indeed, at pH 5.6 the parameter tp w a s significantly increased inducing an increase of the filtrate volume collected until the break point. On an other hand, variation o f the capacities X s and Xp with pH for the two columns, plotted in Figs. 8b and 8c, indicate the most important capacities of the AA at pH 5.6. These results may be explained by the fact that at pH 5.6, the fluoride ions are under F- ionic form [28] which confer a maximum stability to the fluoroaluminium complexes. This explana- tion may be illustrated by the following chemical reactions:
g
e'- 0 e- ,0 t - O U 0 0 I,K 12 (a)./
200,/
0 ! '0 400 600 800 time (min) 4 E v x "~ 2 e - ra e~ x (b) 0 60 I I 20 40 Temperature (°C)Fig. 7. Influence of the experimental temperature on the performance of the electrosorption process. E=+100 my/ SCE; Co=10 mg/I; H=3 cm; D=56.6 wh; pHi = 5.6. (a) Breakthrough curves: A, T = 10°C; 0, T = 18 °C; II, T = 38°C: x, T = 50°C. (b) Evolution of the electro- sorption capacities with the experimental temperature: , ,
xp; o,x,.
-~-AI OHm- + F- - . . . ==AIF + H20 (6) ==AIOH + F . . . • ~ A I F + OH- (7) ~---AIOH+2F- - . . . . + ~ A I F 2 + O H - (8)
248 H. Lounici et al. / Desalination 114 (1997) 241-251 A . 1 e- o .a 1 0 ~ 5 .
oy
o . o w 5OO I0 8 E 0 5. Time (min) (b)!
1000 I 0 500 1000 0 Time (min) 4 . 3 . 2 . I 5 10 pHFig. 8. Influence of the pH of the fluorinated water on the performance of the electrosorption process.Co=10 mg/1; H=3 cm; D=56.6vvh; T=20°C. (a) Breakthrough curves with electrosorption process. E = +100 mv/SCE: 41,, pHi=5.6; Ii], pHi = 6.5; A, pHi=7; e, pHi=9; o, pHi=4. (b) Breakthrough curves with current process: 41,, pHi=5.6; I--1, pHi=6.5; A, pHi=7. (c) Evolution of the sorption capacities at breakthrough point and saturated point under various pHi: • Xp and A X s with electrosorption process at E=+100 mv/SCE; [] Xp and + X~. with current process.
The fluoride adsorption on activated sites of the AA decreased drastically at pH superior to neutral pH. These results could be attributed to the presence of the hydroxide ions which interfered with the F- binding on the AA. A similar decrease of fluoride adsorption on the AA was observed at a pH less than 5. These results may be explained by the formation at high acidity of an adsorbed layer charged negatively by means o f HF and HF] and which by electrostatic repulsion of fluoride caused a decrease of the AA sorption capacities.
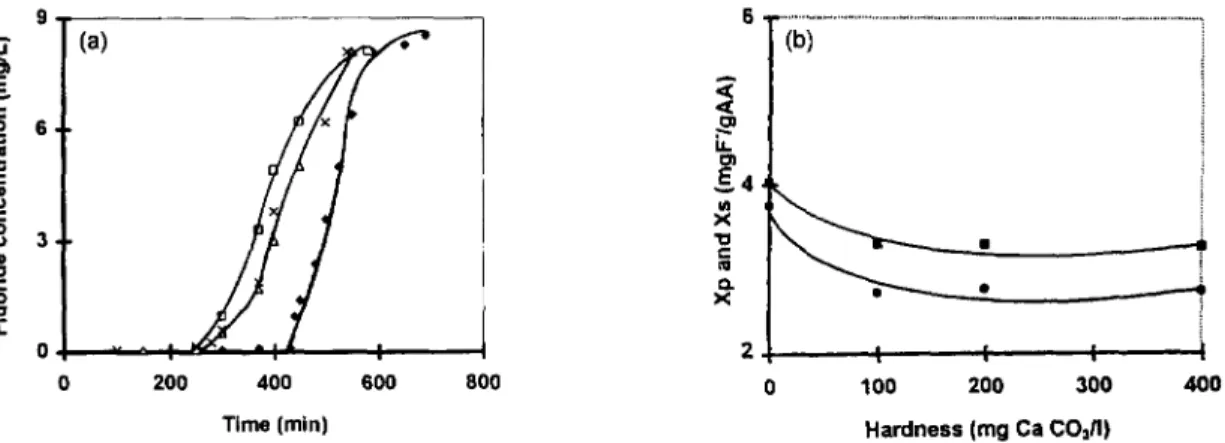
The influence of the hardness of the water on the performance of the electrosorption process was performed by adding carbonate calcium (CaCO3) salt which conferred hardness in the range of 0 to 400 mg/L of CaCO 3 (i.e., 0 to 80 French degrees) to the synthetic fluorinated water. The results obtained, presented in Fig. 9, show an important decrease estimated to 28% of the performance of the AA bed for the two columns utilized when the hardness was increased form 0 to 100 mg
CaCO3/L.
Below this value, the performances of both processes wereindependent of the water hardness and reached a limiting value of 2.75 mg F-/L. The reduction o f the performance of the AA columns may be explained by the competition between fluoride ions and CO32 and/or HCO~ ions formed after the dissociation of CaCO 3. These results are similar to those obtained in previous studies [4,29].
The influence of fluoride concentration on the performance of the electrosorption process was performed under optimum conditions previously determined. The results obtained (Fig. 10) indicate that the fluoride leaks did not exceed 0.4 mg F-/L with concentrations in the range of 3 to 30mg F-/L. Capacities Xp and X s increased with concentration until a concentration of 10 mg F-/L and 15 mg F - / L , respectively. Below these concentrations, capacities Xp and X s reached limiting values in the two cases (Fig. 10b).
It is important to note that the electrosorption process was always more efficient than the current AA column. Another observation was that the breakthrough point was attained independently of the experimental conditions at pH 6.
H. Lounici et al. ~Desalination 114 (1997) 241-251 249 I : 0 .w , w o f . 0 o Q "O
I
i t 9 , (a) 6 , 3, 0 0 400 600 Time (min) 200 800 ,< ,< ,-,.. i t O1 ~4 " 'bi ... I [ [ 0 100 200 300 400 Hardness (mg Ca CO~/I)Fig. 9. Influence of the water hardness on the performance of the electrosorption process. Co=10mg/l; /-/--3 cm; E =
+100 mv/SCE; D=56.6 vvh; pHi=5.6; T=20°C. (a) Breakthrough curves: O, 0 mg CaCO3/1; D, 100mg CaCO3/I; A, 200 mg
CaCOJl; x, 400 mg CaCO3/I. (b) Evolution of the electrosorption capacities at breakthrough point and saturated point with
hardness, e, Xp; m, X s curve. 3 0 . . . 1 6 (a)
/
0 5 0 0 1000 1 5 0 0 20 0 . J e~ 1 2 8 .m 8 c 0 u . r o 4 i u . (b)./"
200 400 600 800Time (rain) Time (min)
Fig. 10. Influence of Fluoride concentration on the performance of the electrosorption process. H=3 cm;/9=56.6 vvh; pHi =
5.6; T=20°C. (a) Breakthrough curves with electrosorption process. E=+100 mv/SCE: 4,, Co=3 mg/l; FI, Co=5 mg/l; A,
Col0 mg/l; x, Co15 mg/l; (>, Co=20 rng/l; e, Co=30 mg/l. (b) Breakthrough curves with current process: O, Co=15 mg/l;
t, Co=10 mg/l; A, Co=5 mg/l; x, Co=3 mg/I.
3.3. Defluoridation of ground water by the electrosorption process
The defluoridation of the ground water utilized as drinking water by the people in Debila City (northwest African Sahara) was performed under optimum conditions previously determined
with synthetic water. The main characteristics of Debila ground water, presented in Table 1, show a strong mineralization. The pH o f the ground
water was adjusted to pH 5.6 by means of H2SO 4
(1 mol/L) acid. The results obtained showed that
the capacity Xp obtained with naturally
250 11.. Lounici et al. / Desalination 114 (1997) 241-251
Table 1
Characteristics o f Debila ground water
Ions Concentration, mg/L F- 3 HCO 3 80 SO 2- 570 C1- 1100 Na + 450 K + 40 Ca + 245 Mg 2+ 120
2.44 mg F-/L. The presence of the competitive ions HCO 3 and SO 2- may explain the reduction of the performance o f the electro-sorption process in those obtained with the synthetic solution. In this case, the fluoride leak was also less than 0.4 mg F-/L.
4 . Conclusion
The electrosorption process appeared a very interesting and promising technique to remove fluoride from ground waters. Trivial leaks of fluoride not exceeding 0.4mg/l occurred. The novel technique exhibited more efficiency than the current process in all cases. Indeed, the performance o f the electrosorption process in all experimental conditions appeared more efficient and presented higher capacities, Xp and X~ to remove the fluoride from water. This work is presently being pursued in the laboratory with a study on the electroregeneration of a saturated AA column.
5. Symbol s
AA - - Activated alumina
b - - Equilibrium constant which character- izes the activated alumina, L/mg C e - - Fluoride residual concentration at equil-
ibrium, mg/L
Co
Cs
c,
D Ee0
1 m pHi OeOm
Q,
SCEtp
ts
T l Xxs
vvs
- - Fluoride initial concentration, mg/L -- Fluoride residual concentration at satu-
ration, mg/L
-- Fluoride concentration at time t, mg/L
- - Filtrate volumetric flow, vv -1 h-l=h -1
-- Electrochemical potential, volt
- - Potential of zero charge, volt - - Current density, Am -2
-- Adsorbent mass of the packed column,
Kg -- initial pH - - A d s o r p t i o n capacity at equilibrium, mg/g AA - - M a x i m u m adsorption capacity, mg/g AA - - A d s o r p t i o n capacity at experimental time t, mg/g AA
- - Saturated calomel electrode
-- Breakthrough time, s -- Saturation time, s
- - Temperature, °C
-- Experimental time, s
-- Mass of solute fixed by the activated
alumina, mg
- - A d s o r p t i o n capacity at breakthrough point of the fixed bed, mg F-/g AA
-- Adsorption capacity at saturation point
of the fixed bed, mg F-/g AA
-- Filtrate volume collected at time t, m 3
- - F i l t r a t e volume collected at break- through point, tp, m 3
-- Filtrate volume collected at saturation
point, t s, m 3
References
[1] N. Mameri, A.R. Yeddou, H. Lounici, D. Beihocine, H. Grib and B. Bariou, Water Res., in press. [2] A.A. Yam, M. Diouf-Ndiaye, M. Badiane and
G. Sawadogo, Tech. Sci. Muni¢., 6 (1995) 488. [3] J.C. Demancourt, Teeh. Sci. Munie., 3 (1980) 135. [4] J.J. Schoeman and G.W. Leach, J. Water Sei., 11
(1987) 25.
[5] D.R. Lee., J.M. Hargreaves, L. Badertoeher, L. Rein and F. Kassir, IAHS, 233 (1995) 155.
t£ Lounici et al. / Desalination 114 (1997) 241-251 251
[6] O.M. Saether, C. Reimann, B.O. Hilmo and E. Taushani, Environ. Geol., 26 (1995) 147. [7] P. Mazounie and P. Mouchet, Rev. Fr. Sci. Eau, 3
(1984) 29.
[8] H. Naoki, M. Masahiro, O. Hajime, S. Akindou, E. Takeji and K. Tooru, Water Res., 30 (1996) 865. [9] J.P. Padmasiri, W.S.C.A. Fonseka and T. Liyana- patabenti, Natl. Water Supply and Drainage Board, 13 (1995) 59.
[10] A.K.Susheela, IAHS, 233 (1995) 123.
[11] K.R. Bulusu and W.G. Nawlakhe, Indian J. Environ. Health, 32 (1990) 197.
[12] K.R. Bulusu and W.G. Nawlakhe, Indian J. Environ. Health, 30 (1988) 262.
[13] W. Syed Abdul, T. Shuzo and P. Sang-won, Sep. Sci. and Technol., 31 (1996) 1501.
[14] R. Wang, H. Li, P. Na and Y. Wang, Water Pollut. Res. J. Can., 30 (1995) 81.
[15] S.I. Abou Elela, E.M. El Kamah, H.I. Aly and E. Aboutaleb, Water Sci. & Technol., 32 (1995) 45. [16] K.M. Popat, P.S. Anand and B.D. Dasare, React.
Polym., 23 (1994) 23.
[17] S. Achour, Trib. Eau, 42 (1990) 53.
[18] F. Walsh and G. Mills, Chem. Technol. Eur., 1 (1994) 13.
[19] L.S. Cheng, Water Supply, 3 (1985) 177.
[20] V.V. Khabalov, A.A. Pershko, N.K. Gorchakoa and V.Y. Ghishchenco, Izv. Akad. Nauk. SSSR. Ser. Khim., 2 (1984) 263.
[21] J.H. Strohl and K.L. Dunlop, Anal.Chem., 44 (1972) 2166.
[22] D.M. Ruthven, ed., Principles of Adsorption and Adsorption Processes, Wiley, NewYork, 1984. [23] A.S. Michaels, Ind. Eng. Chem., 44 (1952) 1922. [24] G.M.Luckchis, Chem. Eng., 80 (1952) 111. [25] R.S. Juang and S.H. Lee, J. Chem. Tech. Bio-
technol., 66 (1996) 153.
[26] J. Rodier, L'analyse de l'eau, 7th ed., Dunod, Paris, 1984.
[27] J. Oscik, ed., Adsorption. Wiley, New York, 1982. [28] M. Pourbaix, ed., Atlas d'~quilibre 61ectrochimiques
25 ° C. Gauthiers-Villars, Paris, 1963.
[29] J.J. Schoeman and H. Mc Leod, Water S.A., 13 (1987) 229.