To cite this version : Mouls, Benjamin and Arurault, Laurent and
Taberna, Pierre-Louis and Bonningue, Corine Macroscopic,
thermodynamic, kinetic and microscopic study of nitric acid pickling of
Elektron 21 (EV31A) magnesium alloy. (2014) Journal of Magnesium
and Alloys, vol. 2 (n° 4). pp. 363-376. ISSN 2213-9567
To link to this article : doi:
10.1016/j.jma.2014.11.009
URL :
http://dx.doi.org/10.1016/j.jma.2014.11.009
O
pen
A
rchive
T
OULOUSE
A
rchive
O
uverte (
OATAO
)
OATAO is an open access repository that collects the work of Toulouse researchers and
makes it freely available over the web where possible.
This is an author-deposited version published in :
http://oatao.univ-toulouse.fr/
Eprints ID : 14114
Any correspondance concerning this service should be sent to the repository
administrator:
[email protected]
Macroscopic, thermodynamic, kinetic and microscopic study of nitric acid
pickling of Elektron 21 (EV31A) magnesium alloy
Benjamin Mouls, Laurent Arurault
*
, Pierre-Louis Taberna, Corine Bonningue
Universite de Toulouse, CIRIMAT, UPS/INPT/CNRS, 118 route de Narbonne 31062, Toulouse Cedex 9, France
Abstract
The study of pickling of the EL21T6 substrate in a nitric acid bath firstly provided knowledge of the influence of the different experimental parameters (concentration of acid, temperature and stirring of the solution) in relation to the etching rate. This experimental part led to the choice of standard pickling (Tbath¼ 25!C, moderate stirring (250 rpm), [HNO3]¼ 1.20 mol/L, duration of 2 min) so as to obtain constant removal of
material, even after several uses of the pickling bath. SEM observations also confirmed that in these operating conditions, pickling concerns both the grains of the matrix and the precipitates of type Mg3(Nd, Gd), leading to uniform removal of material from the surface. Working from a
number of assumptions, thermodynamic and chemical kinetic studies then allowed a pickling mechanism to be proposed and led to obtaining values for the corresponding kinetic parameters (order of reaction, constant of mean rate, activation energy) to be obtained.
Keywords:Magnesium alloy; Elektron 21; Pickling; Nitric acid; Chemical kinetic; Thermodynamic
1. Introduction
Elektron 21, also listed as EV31A in accordance with standard ASTM, is a magnesium alloy developed in the 2000s
[1e5]to be used at temperatures of around 200!C in the car
racing and aeronautical fields. This alloy is a quaternary sys-tem of the MgeZreZn-TR type with a very low Zinc content (0.2e0.5% of mass) and containing Neodymium, Gadolinium and Zirconium. The presence of Neodymium leads in partic-ular to a reduced grain size and an improvement in tensile strength (Rm ¼ 280 Mpa, Re0.2 ¼ 170 MPa) at high temper-atures[6], as well as excellent castability. However, its resis-tance to corrosion remains inadequate to satisfy the constraints in industrial uses, whence the need for surface treatments to
improve its resistance to oxidation. Protection treatments for magnesium alloys usually include pre-treatments (degreasing and pickling) then in most cases chemical (chromating and phosphating) [7e13] or electrochemical (mainly micro-arc oxidation)[14e20] conversion treatments, even though ther-mal oxidation treatments [21] or superficial laser fusion
techniques [22] are also sometimes implemented. Now,
chemical or electrochemical conversion layers (or any other type of coating) need to be applied to clean surfaces if only to ensure good adhesion at later stages. The surfaces of magne-sium alloys need first to be prepared by proceeding with degreasing and pickling pre-treatments that must be both environmentally friendly, effective and perfectly controlled.
First of all, the degreasing stage allows grease and lubri-cants used, especially on machining of the metallic substrate, to be eliminated. For magnesium alloys, degreasing is per-formed using either an organic solvent or an alkaline solution (in the domain of passivation) to which a surfactant is added. Thus, in recent works, Elektron 21 substrates have been
* Corresponding author. Tel.:þ33 561556148.
E-mail address:[email protected](L. Arurault).
degreased respectively with acetone[23]or by immersion in a solution including Na2CO3, Na3PO4, Na2SiO3and a surfactant [24].
After degreasing, pickling allows the passivation layer to be dispensed with. Considering the Pourbaix diagram, this is performed in an acid medium (in the domain of corrosion): MgOþ 2Hþ
/Mg2þþ H2O
However, as the passivation layer remains thin (a few nm [25]), over-pickling ensues rapidly:
Mgþ 2Hþ/Mg2þþ H2
This second reaction is doubly prejudicial as it leads firstly to a loss of metal and secondly, on its surface, the release of hydrogen (H2) likely over time to cause hydrogen embrittle-ment of the metallic substrate[25e29].
Magnesium alloys (as for example AZ31) can be pickled in either organic (acetic acid[30], oxalic acid or citric acid[31]) or mineral acid (HF, H3PO4, HNO3[30], H2SO4[32,33], HCl [34]) solutions. However, none of these studies address the thermodynamic and kinetic aspects of the pickling reactions, or concentrate merely on studying the thickness of material removed in relation to various operating parameters such as the nature of the acid, its concentration, the treatment time and the temperature of the treatment bath. Nwaogu [32] thus highlighted that, when pickling an AZ31 substrate with nitric acid (HNO3), phosphoric acid (H3PO4) or sulphuric acid (H2SO4), the thickness of material removed increases with the concentration and immersion time. However, the rate of ma-terial removal diminishes more or less rapidly as the immer-sion time increases, whatever the concentration of acid, this reduction being less noteworthy when pickling with nitric acid [32]. The same authors[32]also showed that nitric acid spe-cifically allows surface roughness to be obtained indepen-dently of the thickness of the removed material, attesting to uniform pickling. In addition, pickling most often allows for an improvement in resistance to corrosion of the magnesium alloy. Indeed, the enhanced resistance to corrosion following pickling may be due to the formation of protective layers. For example, when pickling in HNO3þ CrO3or HNO3þ H3PO4 combined baths, protective films of chromium oxide hydrox-ide (CrOOH) or magnesium phosphates (Mg3(PO4)2) form respectively[35]. Hydrofluoric acid meanwhile encourages the formation of a fine protective layer of magnesium fluorides (MgF2) or compounds of the Mg(OH)xF2#xtype[36,37]. The HF concentration and the treatment time then play a signifi-cant role in growth of the layer[38].
For pickling of Elektron 21 alloy, Murillo-Gutierrez [23] simply reports the use of a nitric acid solution (20 g/L, 2 min at ambient temperature). Meanwhile, Pommiers-Belin [24] characterised the surface of the alloy after each of the three baths (HNO3, H2CrO4, HF) making up the pickling-reprecipitation treatment firstly by XPS analysis and sec-ondly by optical observation. But these studies do not report systematic analysis of pickling from the thermodynamic or kinetic perspective. Furthermore, these processes most often include hexavalent chromium (CrVI), classified as being
carcinogenic-mutagenic-reprotoxic under the new European directive REACH, requiring it be eliminated and replaced by environmentally friendly surface treatments that at least do not involve the use of hexavalent chromium. Finally, a number of works [34,39,40] show unambiguously that the pickling pro-cess constitutes a key stage as it allows coatings that are denser and more uniform to be obtained later, also affording better adhesion.
The present study will include firstly a macroscopic approach devoted to the influence of various experimental parameters (acid concentration, temperature and stirring of the solution) in relation to the pickling rate of Elektron 21 alloy in a nitric acid medium. Then, thermodynamic and chemical kinetic approaches will enable a detailed reaction mechanism for pickling to be proposed and values for the associated ki-netic magnitudes to be established for the first time. This will be followed up finally by a study of pickling at the scopic scale, i.e. at the level of the substrate surface micro-structure after pickling.
2. Experimental procedures
2.1. Surface preparation
The substrate material was ELEKTRON 21 magnesium alloy. Its chemical composition in percentage weight was: 0.2 < Zn < 0.5%, 2.6 < Nd < 3.1%, 1.0 < Gd < 1.7%, saturated with Zirconium and Magnesium accounting for the remainder. To achieve its required properties, full solution treatment and artificial ageing (T6 heat treatments) were per-formed, i.e. 8 h at 525!C followed by quenching in hot water (60e80 !C), then 16 h at 250 !C and cooling in air [1,41]. Coupon sizes were 40 mm$ 20 mm $ 4 mm but the working surface corresponded to only one side, i.e. 8 cm2.
Prior to the pickling experiments, the working surface was polished with a 1200 grade silicon carbide polishing paper disc, and then rinsed with water and then ethanol.
All polished samples were degreased in an acetone bath for 10 s and then dried in room atmosph ere.
The coupons were then weighed (Sartorius CPA 324S) and pickled for 120 s in one of the different concentrations of nitric acid solutions (2.50, 1.40, 1.20, 0.10, 0.01 mol/L), i.e. at different pH values (#0.40, #0.15, #0.08, 1.00, 2.00 respec-tively), in different temperature conditions (at 25, 30, 40, 50 !C), and with or without magnetic stirring (250 rpm). Finally, the samples were rinsed in de-ionised water and ethanol, then dried in a stream of air, and finally weighed.
2.2. Characterisations
Prior to microstructural observations, samples were suc-cessively polished on 800, 1,000, 1,200, 2,400, 4000 grade SiC paper discs and finally on 3, 1, 0.1, 0.25 mm diamond paste polishing pads. Different mixed solutions (e.g. ethanol, water, acetic and picric acids) have been used previously[41,42]to perform metallographic etching. In the present study, samples were dipped for few seconds in a mixed sulphuric acid-ethanol
solution (1 mL of H2SO4 (98%) and 64 mL C2H6O (96%) respectively) at ambient temperature on the lines of the pro-cedure adopted by Schaberger and co-workers[43]. They were then rinsed with de-ionised water, then with ethanol and finally dried in a stream of air.
Sample microstructures were observed with an optical microscope (OM) (Keyence VHX-1000E). Additional obser-vations of the sample microstructure were carried out under a Scanning Electron Microscope (SEM-JEOL JSM 6510LV), using secondary electron imaging (SEM-SEI) mode, while ImageJ free software was used to analyse the SEM images and evaluate both grain and precipitate area and size. In addition, Energy Dispersive X-ray (EDX-PGT PRIMS2000) spectros-copy coupled with the SEM device allowed elementary chemical mapping of the Mg, Nd and Zr elements to be performed.
Quantitative elemental chemical analyses were also carried out (volume of the analysed area: some mm3) using an
Elec-tron Probe Micro-Analyser (EPMA e CAMECA SX50). Ten
measurements were made over the whole sample surface. Analysis of the pickling solutions used was performed by Inductively Coupled Plasma (ICP) mass spectrometry using a spectrophotometer (Thermofischer Scientific ICP-AES, IRIS) at the Service Central d'Analyses (Villeurbanne) to evaluate Mg, Nd, Gd, Zr, Zn releases resulting from the alloy etching. Additionally, samples were weighed before and after pickling using a Sartorius CPA 324S electronic balance.
3. Results and discussion
3.1. Macroscopic approach
3.1.1. Metallographic observations
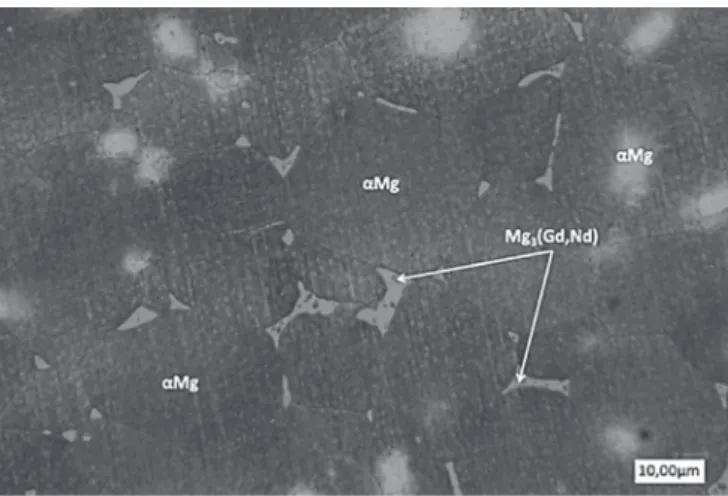
Fig. 1 shows an optical micrograph of the Elektron 21
surface after metallographic etching. This is a typical micro-structure of cast alloy with T6 thermal treatment, i.e. equiaxial grain structure with solid solution a-Mg (a), and intermetallic precipitates (b), which reformed during the thermal ageing step, being visible at the grain boundaries. OM image analysis
reveals that grain area varies from 10 to 5,000 mm2, with an average value of about 2000 mm2, while the precipitate area is in the 5e200 mm2area range, with an average value of about 50 mm2. From SEM observations (Fig. 2), the surface per-centage relative to precipitates was estimated to be equal to 3% of the total surface area. Additional EPMA analysis re-veals that the respective weight content of the alloying ele-ments are respectively 92.5 ± 0.6 wt% of Mg, 2.6 ± 0.4 wt% of Nd, 1.2 ± 0.4 wt% of Gd, 0.4 ± 0.2 wt% of Zr, and 0.3 ± 0.1 wt% of Zn. All these values comply with the required contents of the AMS 4429 specification defining Elektron 21 magnesium alloy.
Although the studied substrate is made of an alloy including two phases, this study firstly considers etching of the Mg phase alone (Assumption 1), since it represents 97% of the total surface area. However, various etching reactions of the Mg phase (E! ¼ #2.37 V/ENH) can be considered according
to the chosen electrochemical couple, i.e. Hþ/H2
(E! ¼ 0.00 V/ENH), NO3#/NO2 (þ0.80 V/ENH), NO3#/NO (þ0.96 V/ENH) or NO3#/NO2(þ0.84 V/ENH):
The first type of reaction involves the nitrates: 2NO3#þ 8Hþþ 3Mg/3Mg2þþ 4H2Oþ2NOðgÞ
ðReaction1Þ while the second takes the protons into account:
Mgþ 2Hþ
/Mg2þþ H2ðgÞ ðReaction2Þ
As these two reactions cannot readily be differentiated, this study firstly shows the concentration of [HNO3], taking into account both the acid and nitrate concentrations.
3.1.2. Determining the mean etching rate
The mean pickling or etching rate (Vatt) was studied in relation to various parameters (concentration, stirring and temperature) during pickling with nitric acid (HNO3). This rate is calculated using Equation(1):
Vatt¼
Dm$ 104
r$ S $ Dt ð1Þ
where Vattis the etching rate (mm/min), Dm the loss in weight (g), r the density of the Elektron 21 alloy (1.82 g/cm3), S the exposed surface (8 cm2) and Dt the treatment time (2 min).
Fig. 3 shows the different etching rates in relation to the
nitric acid concentration used, with these different results being obtained for an immersion of 2 min in a nitric acid bath kept at 25!C and without mechanical stirring.
As a general rule, an increase in the etching rate can be seen when the acid concentration augments. For concentra-tions between 0.01 and 1.50 mol/L, the increase in the etching rate seems to be linear and proportional to the higher acid concentration (Fig. 3). However, when the acid concentration is greater than 1.5 mol/L, a greater increase in the etching rate is observed.
On pickling, supply of the reagent matter (Hþ or NO3#
ions) can be ensured by convection and/or diffusion at the electrolyteesubstrate interface. The pickling reaction, and thus the consumption of reagents at the interface, thus leads to a reduction in their local concentration, and the establishment of a diffusion layer in the vicinity of the substrateeelectrolyte interface, whose thickness is all the greater in so far as the electrolyte is not stirred (which is the case for this study ac-cording to the nitric acid concentration).
Moreover, at low acid concentration (here 0.01 mol/L) there is no bubbling, while for concentrations between 0.10 mol/L and 1.40 mol/L, there is formation of gas bubbles (H2 or NO for example), that become extremely abundant beyond 1.40 mol/L. Whatever the nature of the bubbles,
Reactions 1 and 2 are accompanied by a big increase in
temperature (>10!C) and local convection, tending to reduce the thickness of the diffusion layer. The influence of both these parameters is now to be studied.
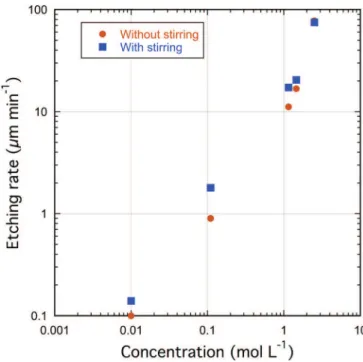
Fig. 4 shows variations in the mean etching rate when
pickling (25!C for 2 min) is conducted without or with
mag-netic stirring (250 rpm). The influence of stirring is effective for a certain concentration range. Indeed, for nitric acid concen-trations of between 0.01 mol/L and 1.40 mol, stirring leads to an acceleration of the etching rate increase that can become twice as fast. Stirring the bath then involves a convection phenomenon reducing the thickness of the diffusion layer, favouring the transport of matter and thus the pickling reaction, especially for concentrations of between 0.01 mol/L and 1.40 mol/L. However, for concentrations greater than 1.40 mol/ L, the influence of stirring is minimal or even inexistent. Bubbling is then especially intense and can finally lead to a convection phenomenon that will be preponderant over the convection resulting from mechanical stirring. In order to reduce the influence of the transfer of mass and thus avoid any excessive modifications of the electrolyteesubstrate interface, pickling processes will all be conducted with stirring (250 rpm) in what follows in the present article.
Fig. 5 shows variations in the mean etching rate for
different bath temperatures (25, 30, 40 and 50 !C), and for different nitric acid concentrations, with mechanical stirring being constant (250 rpm). Fig. 5 clearly illustrates that an increase in temperature is conducive to acceleration in the etching rate for concentrations higher than 0.01 mol/L. These results explain then that the increase in the pickling rate for concentrations higher than 1.5 mol/L (Fig. 3) can be attributed more to the increase in the interfacial temperature than to local convection. However, this approach only takes a single pick-ling process into account (with the bath being renewed every time), while the repetition of pickling processes in the same bath leads to ageing of the solution, whence a potential modification of the mean pickling rate of the substrate.
Fig. 3. Evolution in the etching rate in relation to nitric acid concentration.
Fig. 4. Evolution of the etching rate in relation to HNO3concentration and
3.1.3. Ageing of the pickling baths
To study potential ageing of the pickling solution, ten test coupons were pickled, one after another, for 2 min in the same stirred pickling bath, with the concentration or the temperature being modulated.
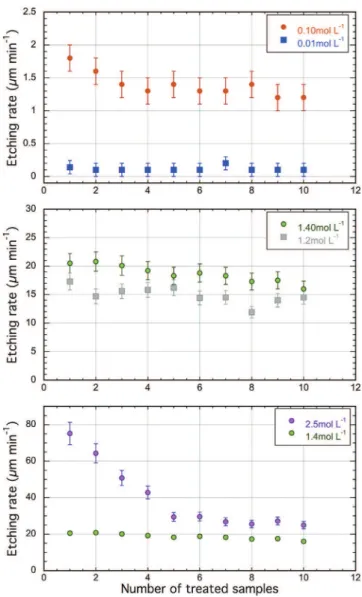
Fig. 6reports evolution in the etching rate for different acid concentrations, over a range going from 0.01 to 2.50 mol/L. For a concentration of 2.50 mol/L, there can be seen a sig-nificant reduction (61%) in the pickling rate, then a stabili-sation of the latter after five coupons have been used. However, for acid concentrations between 0.01 and 1.40 mol/ L, evolution of the etching rate is slight with quasi-immediate stabilisation occurring. For this study, ageing of the pickling baths can be considered negligible and pickling as repeatable in these operating conditions, i.e. (0.01 < [HNO3] < 1.40 mol/ L, stirring (250 rpm), 2 min, 25!C).
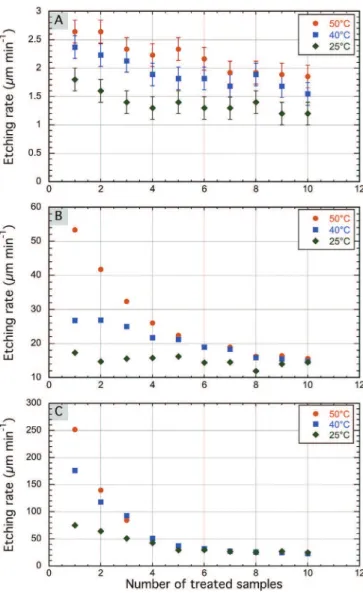
The impact of the pickling bath temperature is then studied over ten successive pickling processes. Fig. 7 thus shows evolution in the etching rate for pickling solutions set to 25!C, 40 !C and 50 !C, the impact of a temperature of 30!C being equivalent to that of 25 !C. Whatever the con-centration, reduction in the etching rate is all the more rapid in so far as the bath temperature is high. Furthermore, the etching rates tend to become similar for the same concen-tration, while at different temperatures this reduction is all the more rapid in so far as the concentration is greater. Indeed, for a concentration of 2.50 mol/L (Fig. 7C), after 5 coupons treated, the etching rates are equivalent for all three
temperatures, while for the 1.2 mol/L concentration
(Fig. 7B), this phenomenon only occurs from the ninth
coupon on and is not yet observable for the 0.10 mol/L concentration (Fig. 7A).
Finally, the increase in temperature only impacts the initial etching rate, meaning during the early period of the pickling bath being used, whereas the rate stabilises more or less rapidly until becoming identical for the three temperatures. As a result, the following pickling processes are made at 25!C, so as to have repeatable etching rates very quickly, or even as from the start of pickling bath use.
Up until now, the present study has adopted as sole assumption the fact that pickling mainly concerns the mag-nesium matrix (Assumption 1), whereas a number of reactions are possible in a nitric acid medium according to the elec-trochemical couple considered. The first reaction (Reaction 1) brings into play nitrates, while the second (Reaction 2) takes the protons into account. What follows in this study is inten-ded to specify the pickling mechanism through thermody-namic and chemical kinetics approaches, but also by an analysis of the treated surfaces using the Scanning Electron Microscope.
Fig. 5. Evolution of the etching rate in relation to nitric acid concentration and temperature.
Fig. 6. Evolution of the etching rate for nitric acid concentrations of 0.01; 0.10; 1.20; 1.40 and 2.50 mol/L.
3.2. Thermodynamic approach
3.2.1. Theoretical bases and assumptions
In order to identify the pickling mechanism, several mag-nitudes have to be determined, as with enthalpies of reaction, the theoretical energies released during the reactions and thus in the final analysis the variation in temperature between the start and end of pickling. It is also important to note that, from an experimental perspective, this thermodynamic study is not conducted in an adiabatic system. However, as the pickling reaction takes place within 2 min only, heat transfers remain minimal and can be considered negligible as a first approxi-mation (Assumption 2).
The standard free enthalpy of the reaction (DrGT!) (kJ mol#1) is calculated using Equation(2)that brings in the standard enthalpy of reaction (DrH!) (kJ mol#1) and entropy (DrS!) (J mol#1K#1), reaction standard and temperature (K).
DrG ! ¼ DrH ! # TDrS ! ð2Þ
These magnitudes are calculated using standard enthalpy (DfH!) and standard entropy (DfS!) of formation [44] in accordance with Equations(3) and (4) shown below:
DrH ! ¼X i niDfH ! i ð3Þ DrS ! ¼X i niDfS ! i ð4Þ
with nithe stoichiometric coefficient of the chemical species i; niis positive for products, negative for reagents. The values of these three magnitudes, for both possible reactions, are featured inTable 1.
For each pickling process, measurement of the loss in mass allows the mass of magnesium consumed to be determined and finally the energy Q (J) of the reaction in accordance with the following equation: Q¼ m M ! " $ DrH ! ð5Þ with m¼ the loss in mass (g), M ¼ atomic mass of magnesium (24.3 g/mol).
Knowing the energy of the reaction (Reactions 1 or 2), the theoretical variation in temperature produced during pickling DTtheo can then be determined. This variation is calculated thanks to Equation(6) that brings in the mass of the solution (mS) (kg) as well as its heat capacity (Cp) (J/kg K).
DTtheo¼
Q
#mS$ Cp
$ ð6Þ
For the present study, the density of the solution and its heat capacity are considered to be equal to that of water (1.418 J/ kg K) (Assumption 3).
3.2.2. Identifying the pickling reaction
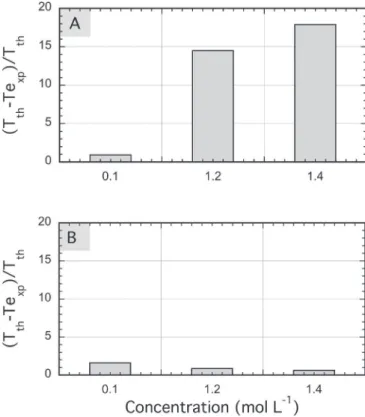
Thanks to calculation of the theoretical temperature varia-tion DTtheo (Equation (6)), the bath temperature can be esti-mated theoretically at the end of pickling ðTtheof Þ. This
temperature is then compared with that taken experimentally using the temperature sensor ðTf
expÞ. The mean differences
between the final theoretical temperatures ðTtheof Þ and those
measured experimentally ðTf
expÞ are shown for both reactions
onFig. 8.
Concerning the reaction involving nitrates (Reaction 1), the differences between Ttheof and Tf
expare close to 15e20% for the
strongest concentrations (1.2 and 1.4 mol/L) and are less than 2% for the weak concentration (0.10 mol/L). However, if
Reaction 2(involving protons) is taken into account, values do
not exceed 2%, whatever the acid concentration used. In light of these results, it can be considered that, from a thermodynamic perspective, the main mechanism of the pickling reaction is based on the preferential attack of the magnesium solid solution (aMg) and that this reaction can be modelled with Reaction 2 (Assumption 4), implying a spon-taneous redox reaction between the Mg/Mg2þ and Hþ/H2 couples. However, this conclusion is only valid if the
Fig. 7. Evolution of the etching rate for nitric acid concentrations of (A) 0.10; (B) 1.20 and (C) 2.50 mol/L at different temperatures (25, 40 and 50!C).
assumptions made are verified, especially if the adiabatic conditions are respected (Assumption 2). Otherwise, part of the heat can be let off by the system (the pickling solution) to the outside environment (the thermostat control unit). In this case, Reaction 1 could nevertheless be considered. At this stage in the study, it would be appropriate to confirm or rule out these results by determining experimentally (by mass spectrometry analysis, for example) the nature of the gases resulting from the pickling reaction. The study can then be pursued through a kinetic study, bearing in mind thatReaction 2 (involving protons) is considered as a priority, although values and considerations relating to Reaction 1, involving nitrates, are given for purposes of comparison where possible.
3.3. Chemical kinetic approach
3.3.1. Choice of kinetic model and calculation of the activation energy
When a reaction takes place between two reagents in different states (pickling being between a solid and a liquid), it is customary to study the kinetics of that reaction using het-erogeneous kinetic models.
Within the scope of the present study, the pickling reaction is firstly studied using the “Shrinking Core Model” (SCM) [45]. This model generally describes the reaction of the gas on the surface of a catalyser but is also often used to study re-actions of pickling or the dissolution of different materials [46,47].
SCM was developed both for spherical particles but also for plates, whose resulting equations are as follows:
XMg¼ 1 # ðl=LÞ
XMg2 ¼ kt#control by diffusion in the ash layer$
XMg¼ kt#control by chemical reaction$
with XMg the fraction of metal not dissolved, L the initial thickness of the metal, l the thickness of the dissolved metal, and t the pickling time.
It is worth noting that SCM applied to plates does not cater for the reduction in the concentration of acid during pickling. However, the present study is based on the works of Yoo et al.
[48,49]who took the interfacial variation of the acid reagent
into account in the SCM.
Thus, assuming a rate of reaction controlled by the chem-ical reaction taking place on the substrate surface (considered to be constant), Equation(7)can be defined:
# 1 Sext dNMg dt ¼ # rMg Sext Sext dl dt¼ #rMg dl dt¼ k%H þ& ð7Þ
Knowing that [Hþ] is not constant, this means:
#rMg Zl L dl¼ k Zt 0 %Hþ&dt ð8Þ rMgL k ( 1#l L ) ¼ Zt 0 %Hþ& 0ð1 # XHÞdt with XH¼ 1 # ½Hþ( ½Hþ( 0 ð9Þ XMg¼ kc Zt 0 ð1 # XHÞdt with XMg¼ ( 1#l L ) and kc¼ k½Hþ( 0 rMgL ð10Þ with: Sext¼ surface treated, NMg¼ moles of Mg, rMg¼ molar concentration of the Mg element in the substrate (mol/m3).
Table 1
Values for standard enthalpy (DrH!) and entropy (DrS!) for both reactions.
Calculated values 298 K 2NO3#þ 8Hþþ 3 Mg / 3Mg2þþ 4H2Oþ 2NO( g)(Reaction 1) Mgþ 2Hþ/ Mg2þþ H2( g)(Reaction 2)
DrH!(kJ mol#1) #1946.5 #466.9
DrS!(J mol#1K#1) #103.6 #40.1
DrGT!(kJ mol#1) #1915.6 #454.9
Fig. 8. Mean difference (expressed as a %) between Ttheof and Tf
expfor reaction
It is therefore necessary as a priority to measure the evo-lution in the mole fraction of acid converted XHin relation to time. Considering Reaction 2, XH is plotted in relation to treatment time (Fig. 9) for each initial concentration of acid (0.01; 0.10; 1.2; 1.4 and 2.50 mol/L) and each temperature (25, 30, 40 and 50!C).
This line allows an equation representative of the evolution of XHin relation to the treatment time to be extracted and then the integral of (1 # XH) to be determined. Next, XMgor XMg2 can be plotted in relation to the integral of (1 # XH). If the curve plotted is a straight line in the case where the y-axis is
XMg, then pickling is controlled by the chemical reaction at the interface. Conversely, the pickling reaction is controlled by diffusion in the ash layer if a straight line is obtained when
XMg 2
is put on the y-axis. Indeed, in the event of a control by diffusion in the ash layer, Equation(11)will be defined:
# 1 Sext dNMg dt ¼ DHþ d½Hþ( dl ð11Þ
with DHþ: diffusion coefficient of Hþ after integration,
considering [Hþ] null at the Mg-ash layer interface, there will be: X2 Mg¼ kD Zt 0 ð1 # XHÞdt ð12Þ
with kD¼ H½ þ(0DHþ=rMgL2 representing the apparent
re-action rate constant under diffusion control.
Fig. 10shows that experimentally, the pickling of Elektron
21 is mostly controlled by the surface chemical reaction. Moreover, the slope of the straight line thus obtained is equal to the constant for the apparent rate, which depends on
the temperature in accordance with the law of Arrhenius (Equation (13)),
kc¼ Ae#
Ea
RT ð13Þ
with A the pre-exponential factor or frequency factor, Ea the activation energy (kJ/mol), R the perfect gas constant (8.314 J/ mol#1 K#1) and T the temperature (K). Thus, the activation energy of the reaction can be determined thanks to Equation (13), plotting ln(kC) as a function of 1/T (Fig. 11) in accor-dance with:
lnðkcÞ ¼ ln#A$ #
Ea
RT ð14Þ
The pickling activation energies are featured in Table 2 according to the nitric acid concentrations less than 1.40 mol/L, that is for a case of pickling governed by a chemical reaction on the substrate surface.
The activation energy remains practically unchanged in the range of concentrations included between 0.10 and 1.40 mol/ L, and is close to 18 kJ/mol forReaction 2. These results are also similar to those obtained for Reaction 1, for which the activation energy is on average 20 kJ/mol. As a result, it ap-pears to be a good approximation to consider the pickling reaction, although it is intrinsically heterogeneous, as similar to a homogeneous type reaction, independently of the mass transport (relating to the protons or the nitrates). This approach is supported by the fact that firstly the surface of the coupon (its geometry) remains invariable over time and secondly that no passivation layer is formed to block or limit the pickling reaction. Having chosen a kinetic model, the study will be pursued by determining reaction rates as also the kinetic
Fig. 9. Evolution of XHin relation to treatment time for a bath of nitric acid initial concentration of 1.20 mol/L at 25!C.
Fig. 10. Highlighting control by the interfacial chemical reaction during pickling ([HNO3]¼ 1.20 mol/L; 25!C) of Elektron 21.
constants (apparent order of reaction and constant for the apparent rate) that are specific to each chemical reaction.
3.3.2. Theoretical bases
In order to calculate the rate of reaction, the degree of progress (z) of the reaction needs to be known, in accordance with Equation(15).
V¼dz
dt ð15Þ
where V is the rate of reaction in mol/L min#1and z(t) is the degree of advance (mol/L). In this study, z(t) is determined through the concentration of Mg2þ present in the bath, calculated thanks to the variation in mass the coupon un-dergoes during pickling and taking into account the percentage by weight (92.5%) of the magnesium in the alloy. The mean pickling rate is then assimilated with the slope of the straight line obtained by plotting [Mg2þ] as a function of the bath operating time.
Knowing the concentration of Mg2þ, the variation of con-centration in Hþ ions (Reaction 2), on pickling can then be determined (Equation(16)).
%Hþ& t¼%H
þ&
0# 2zðtÞ ð16Þ
with [Hþ]0 the concentration in mol/L in Hþions before pickling and [Hþ]tthe concentration in mol/L in Hþions at t minutes of utilisation of the pickling bath.
The empirical law for the rate (Equation(17)) can then be used to determine the order of the reaction, while considering variations in products, i.e. concentration in Mg2þions and the dissolution of gaseous H2, to be negligible in the solution,
V¼ k $ ½Mg(a$%Hþ&b
ð17Þ with V the rate of reaction (mol/L min#1), [Mg] the activity of the metal magnesium and [Hþ] the concentration in pro-tons, k the constant for the rate and a, b partial orders.
Now, in these pickling conditions, the activity of the solid metal magnesium substrate can be considered constant (equal to 1 by convention) throughout the treatment. Furthermore, considering that the etching rate only depends on the acid concentration, the isolation method (or degeneracy of the order) allows Equation(17)to be simplified as Equation(18).
V¼ k0$%Hþ&b
with k0¼ k $ ½Mg(a ð18Þ
with k0 the apparent rate constant and b the apparent order of the reaction that can be assimilated in this case with the global order of the reaction.
Equation (18) can be expressed in logarithmic form
(Equations(19) and (20)) so as to plot the curve Log (V)¼ f (pH) and thus determine the global order of the reaction. log V¼ log k0þ b log#%Hþ&$
ð19Þ
log V¼ log K0# b pH ð20Þ
Knowing the apparent order of reaction b, the apparent rate constant can be calculated by combining Equations(18) and (21), that is the expression of the mean rate of reaction ac-cording to the acid concentration.
V¼ #1 2$ (d½Hþ( dt ) ð21Þ with [Hþ]t the concentration in protons calculated using Equation(16).
3.3.3. Experimental determination of the mean reaction rate
Fig. 12 shows the evolution in the total concentration of
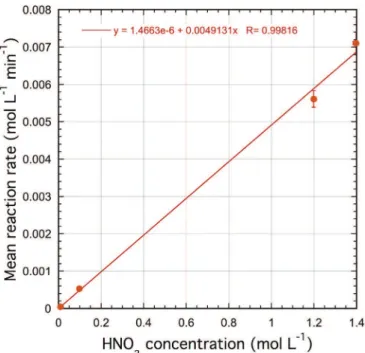
Mg2þ ions dissolved in solution in relation to the time the latter is used, this concentration being calculated from the loss of experimental mass of the substrate. It appears that the magnesium ion content is proportional to the pickling time. Determination of the slopes for each nitric acid concentration then means the corresponding rates of reaction can then be determined, in accordance with Equation (15). Fig. 13 high-lights the fact that the increase in the rate of reaction is pro-portional to that of the acid concentration.
In addition, ICP analyses enabled the real concentrations in solution after pickling of ten samples in the same bath to be
Table 2
Activation energy values for different acid concentrations, considering
Reactions 1 and 2.
[HNO3] mol/L Activation energy Ea (kJ/mol) forReaction 1
Activation energy Ea (kJ/mol) forReaction 2
1.40 19 22
1.20 20 22
0.10 15 15
Fig. 11. Determining the activation energy for an acid concentration of 1.20 mol/L.
determined.Fig. 14shows the comparison between the mean rates of reaction, obtained from magnesium ion contents in the solution, calculated firstly from the loss of mass and secondly as analysed by ICP. It appears that the values for the rates of reaction derived from the two methods are similar, while the differences existing can be attributed to the measurement er-rors of the two. This additional result attests to the relevance of the calculations from the loss of mass and confirms the pickling reaction mean rate values.
3.3.4. Experimental determination of the apparent order of the reaction
Knowing the different rates of reaction, the apparent order of the reaction can be determined, by taking the rate of re-action as a function of the pH (Equation(21)). The slope of the straight line obtained onFig. 15is equal to 1.03, i.e. a value close to unity. This means that, in the operating conditions for pickling used in the present study, the rate of reaction depends directly and solely on the concentration in Hþ, and that the
Fig. 12. Determining the rate of reaction for different initial concentrations of nitric acid.
Fig. 13. Mean rate of reaction in relation to the initial HNO3concentration.
Fig. 14. Comparison of Mg2þconcentrations calculated by loss of mass and determined by ICP.
Fig. 15. Experimental determination of the apparent order of the pickling reaction.
pickling reaction can be assimilated with a reaction of order 1. In addition, the intercept at the origin of this straight line is equal to log (k0) (Equation(20)), meaning access is given to
the apparent rate constant k0, whose value here is
5.10#3min#1.
3.3.5. Experimental determination of the constant for reaction and activation energy
Determination of the apparent order of the reaction also allows the constant of the apparent rate k0of the reaction to be obtained (Equation (22)) by combining Equations (18) and (21):
k0½Hþ( ¼ #1 2
d H½ þ(
dt ð22Þ
Resolution of this system leads to Equation(25)that brings in acid concentrations at the start [Hþ]0 and for a pickling duration t [Hþ]t: d½Hþ( ½Hþ( ¼ #2k 0t ð23Þ Z ½Hþ( t ½Hþ( 0 d½Hþ( ½Hþ( ¼ #2k 0Z t 0 dt ð24Þ ln½Hþ( t ½Hþ( 0 ¼ #2k0t ð25Þ
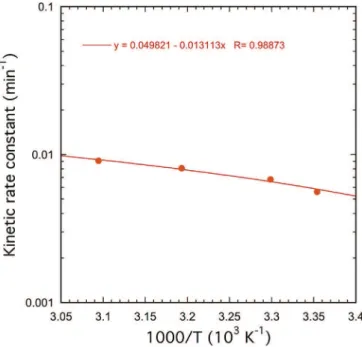
Plotting the curve representing the evolution of the Hþ concentration in relation to time (Fig. 16) thus allows values for the rate constant k0to be determined for each initial nitric acid concentration.Fig. 16illustrates the fact that the slopes of the straight lines are relatively close for initial nitric acid
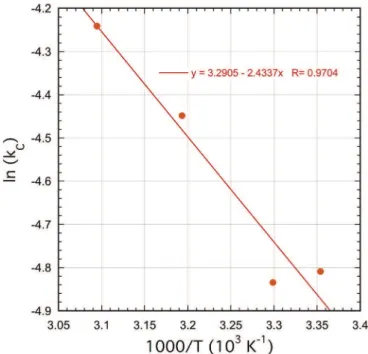
concentrations varying between 0.01 and 1.40 mol/L, which agrees closely with homogeneous kinetics, for which the rate constant k0 is independent of the concentration. This result then allows a mean rate constant k0 to be defined at 25 !C, which is equal to (5.6 ± 0.6) $ 10#3, a value matching that determined after final dosing of the baths ((6 ± 2)$ 10#3) and with the value of 5 $ 10#3 (cf Section3.3.4). While it is in-dependent of the concentration, the rate constant is in-dependent on the temperature in accordance with the law of Arrhenius (Equation (13)) and the activation energy of the reaction can again be determined thanks to Equation(14), plotting ln(k0) as a function of 1/T (Fig. 17).Fig. 17shows that experimentally ln(k0) diminishes with the inverse of the temperature (or in-creases with the temperature) in accordance with the Arrhe-nius relation. As the slope is equal to#Ea/R, the value for the activation energy in homogeneous kinetics is then 15 ± 2 kJ/ mol, which fits with the value determined previously (18 kJ/ mol) for the Reaction 2, from the Shrinking Core Model of heterogeneous kinetics in the range of concentrations between 0.10 and 1.40 mol/L. This result once more allows the assumption of homogeneous type kinetics to be endorsed within the scope of the present study.
All the previous calculations are based on the fact that, according to the results from the thermodynamic study, the pickling reaction can be modelled byReaction 2(Assumption 4), implying a spontaneous redox reaction between the Mg/ Mg2þ and Hþ/H2 couples. If, this time, Reaction 1 was considered, bringing nitrates into play, the rate law could then be expressed as follows:
V¼ k $ ½Mg(a$%Hþ&b
$%NO3# &g
ð26Þ However, variation in the concentration of nitrates can be considered distinctly less than that for protons (Assumption 5)
Fig. 16. Evolution in acid concentration in relation to bath use time.
Fig. 17. Evolution of the rate constant and determination of the activation energy.
if stoichiometric coefficients of the Hþand NO3ions (8 and 2 respectively) are taken into account. In this case, the rate law can be simplified and become similar to the previous Equation (17), that becomes Equation(18)after degeneracy of the order. To summarise, the rate law is finally identical forReactions
1 and 2. The order of Reaction 1 and the activation energy
(15 ± 2 kJ/mol) are identical whatever the reaction taken into account. After the thermodynamic and kinetic approaches providing global data, the pickling study was pursued by SEM characterisations so as to experimentally detail the mechanism at the microscopic level, meaning at the level of a grain and grain joints, and not just for the magnesium matrix but also for the precipitates made up in part by alloy elements.
3.4. Microscopic approach
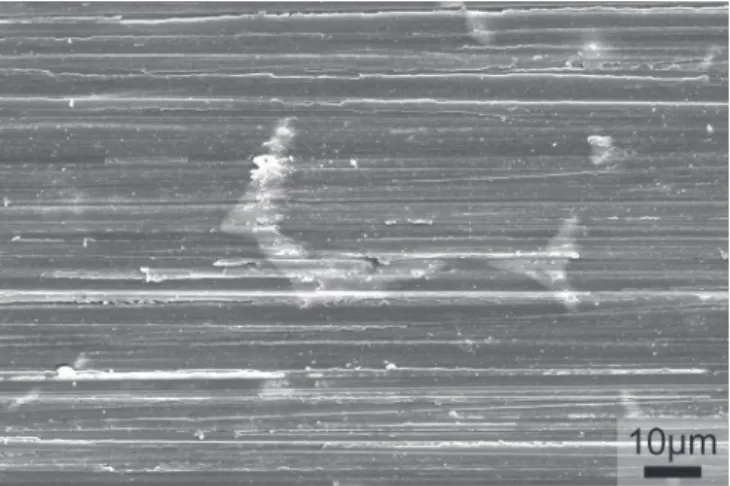
SEM observations were made on the surface of the sub-strate before and after pickling and at different nitric acid
concentrations (0.01; 0.10; 1.20 and 1.40 mol/L), but at a constant temperature of 25!C and an invariant immersion time of 2 min. These observations after and before pickling appear respectively inFigs. 18 and 19. These SEM micrographs show first of all a preferential etching of the a-Mg matrix by the acid, while the precipitates at the grain joints are not etched and are to be found (for low concentrations) in relief in rela-tion to the mean surface (Fig. 19B). These observations concur with a number of studies [50,51]relating to the corrosion of MgeYeREeZr or MgeZneREeZr type alloys. Neverthe-less, for concentrations of nitric acid greater than 1 mol/L, the precipitates seem to be either etched or detached, leading to a more uniform pickled surface and without topographic modification. These observations make a significant contri-bution to understanding the pickling mechanism as thermo-dynamic or kinetic studies do not allow reactions with the matrix to be distinguished from those with precipitates. Indeed, the area occupied by the precipitates is much smaller (3%) than the area of the a-Mg matrix (97%). The energy associated with the precipitates is thus very small compared with that released on dissolution of the magnesium.
Study of these surfaces was completed by analyses, in the form of EDX mapping. Firstly, such mapping confirms that the precipitates on the grain joints are rich in Neodymium and
Gadolinium (Fig. 20), probably in the form of
Mg12(Ndx,Gd1#x) type compounds [4,5]. Secondly, these an-alyses also highlight zones rich in Zirconium in the centre of the grains (Fig. 20), that do not seem to be affected by the acid etching itself for concentrations higher than 1 mol/L. These results concur with those provided by earlier studies [50e52] that had shown (on MgeYeREeZr, ZE41 and NZ30K alloys respectively) the existence of zones rich in Zirconium and their more or less favourable impact on the alloys' resistance to corrosion, according to the distribution of Zirconium inside the grain. Indeed, a uniform and regular distribution of
Fig. 18. SEM micrograph of the surface after polishing (#1200) and before pickling.
Zirconium in the grain leads to preferential dissolution of the magnesium, while if the concentration of Zirconium is greater in the centre of the grain, the latter will not be dissolved and will show better resistance to corrosion.
4. Conclusion
The present study was devoted to pickling of Elektron 21 magnesium alloy in a solution of nitric acid. It started with a macroscopic approach to the influence of various operating
parameters such as the nitric acid concentration
(0.01 < [HNO3] < 2.50 mol/l), the temperature (25e50!C) or stirring (0 or 250 rpm) on the etching rate. This first approach led to choosing standard pickling (Tbath ¼ 25 !C, moderate stirring (250 rpm), [HNO3] ¼ 1.20 mol/l, 2 min) to obtain constant removal of material without significant ageing of the pickling bath.
Thermodynamic and chemical kinetic approaches then allowed a global pickling mechanism to be proposed, based on the reaction between the metal and the protons, that can be assimilated with a homogeneous type kinetics and order 1. These works also led for the first time to obtaining the constant for the mean rate and also the activation energy (15 ± 2 kJ/ mol). In addition, SEM study showed a disparity in the pick-ling at microscopic scale. The precipitates are indeed less effectively etched than the matrix, with the latter reacting differently at its core, according to the distribution of zirco-nium inside the grain.
Following this study, it would be interesting to confirm the assumptions adopted, especially the nature of the redox reac-tion, by using mass spectrometry, for example, to analyse the gas(es) generated during pickling.
Acknowledgements
The present work was carried out as a part of the CAR-AIBE project. The FDA and the OSEO are gratefully
acknowledged for the financial support they provided for this project. The authors are grateful for partnership from Liebherr, Turbomeca, Eurocopter, Mecaprotec, Fonderie Messier and the Institut Carnot CIRIMAT. The authors would like espe-cially to thank Philippe de Parseval from the LMTG for the EPAM measurements.
References
[1] P. Lyon, Magnes. Technol. (2004) 311e315.
[2] G. Riontino, D. Lussana, M. Massazza, A. Zanada, J. Mater. Sci. 41 (2006) 167e3169.
[3] P. Lyon, I. Syed, S. Heaney, Adv. Eng. Mater. 9 (2007) 793e798. [4] A. Kielbus, J. Achiev. Mater. Manuf. Eng. 20 (2007) 127e130. [5] A. Kielbus, J. Achiev. Mater. Manuf. Eng. 22 (2007) 29e32.
[6] Z.L. Ning, H. Wang, H.H. Lin, F.Y. Cao, S.T. Wang, J.F. Sun, Mater. Des. 31 (2010) 4438e4444.
[7] J.E. Gray, B. Luan, J. Alloys Compd. 336 (2002) 88e113.
[8] Z. Yong, J. Zhu, C. Qiu, Y. Lin, Appl. Surf. Sci. 255 (2008) 1672e1680. [9] M.A. Gonzalez-Nunez, C.A. Nunez-Lopez, P. Skeldon, G.E. Thompson, H. Karimzadeh, P. Lyon, T.E. Wilks, Corros. Sci. 37 (1995) 1763e1772. [10] Y.L. Lee, Y.R. Chu, W.C. Li, C.S. Lin, Corros. Sci. 70 (2013) 74e81. [11] N.V. Phuong, K.H. Lee, D. Chang, S. Moon, Corros. Sci. 74 (2013)
314e322.
[12] X.-B. Chen, N. Birbilis, T.B. Abbott, Corros. Sci. 55 (2012) 226e232. [13] X.-B. Chen, X. Zhou, T.B. Abbott, M.A. Easton, N. Borbilis, Surf. Coat.
Technol. 217 (2013) 147e155.
[14] S. Verdier, M. Boinet, S. Maximovitch, F. Dalard, Corros. Sci. 47 (2005) 1429e1444.
[15] Z. Shi, G. Song, A. Atrens, Corros. Sci. 48 (2006) 3531e3546. [16] H.-Y. Hsiao, H.-C. Tsung, W.-T. Tsai, Surf. Coat. Technol. 199 (2005)
127e134.
[17] R.F. Zhang, D.Y. Shan, R.S. Chen, E.H. Han, Mater. Chem. Phys. 107 (2008) 356e363.
[18] S. Ono, K. Asami, T. Osaka, N. Masuko, J. Electrochem. Soc. 143 (1996) L62eL63.
[19] J. Cai, F. Cao, L. Chang, J. Zheng, J. Zhang, C. Cao, Appl. Surf. Sci. 257 (2011) 3804e3811.
[20] S. Lu, W. Qin, X. Wu, X. Wang, G. Zhao, Mater. Chem. Phys. 135 (2012) 58e62.
[21] C. Taltavull, A.J. Lopez, B. Torres, J. Rams, Mater. Des. 55 (2014) 361e365.
[22] S. Feliu Jr., A. Samaniego, V. Barranco, A.A. El-Hadad, I. Llorente, C. Serra, J.C. Galvan, Appl. Surf. Sci. 295 (2014) 219e230.
[23] N.V. Murillo-Gutierrez, F. Ansart, J.-P. Bonino, M.-J. Menu, M. Gressier, Surf. Coat. Technol. 232 (2013) 606e615.
[24] S. Pommier-Belin, J. Frayret, A. Uhart, J.-B. Ledeuil, J.-C. Dupin, A. Castetbon, M. Potin-Gautier, Appl. Surf. Sci. 298 (2014) 199e207.
[25] S. Feliu Jr., C. Maffiotte, A. Samaiego, J.C. Galvan, V. Barranco, Appl. Surf. Sci. 257 (2011) 8558e8568.
[26] M. Kappes, M. Iannuzzi, R.M. Carranza, J. Electrochem. Soc. 160 (2013) C168eC178.
[27] Y. Uematsu, T. Kakiuchi, M. Nakajima, Procedia Eng. 10 (2011) 578e582.
[28] M.B. Kannan, W. Dietzel, Mater. Des. 42 (2012) 321e326.
[29] R.G. Song, C. Blawert, W. Dietzel, A. Atrens, Mater. Sci. Eng. A 399 (2005) 308e317.
[30] R. Supplit, T. Koch, U. Schubert, Corros. Sci. 49 (2007) 3015e3023. [31] U.C. Nwaogu, C. Blawert, N. Scharnagl, W. Dietzel, K.U. Kainer,
Cor-ros. Sci. 52 (2010) 2143e2154.
[32] U.C. Nwaogu, C. Blawert, N. Scharnagl, W. Dietzel, K.U. Kainer, Cor-ros. Sci. 51 (2009) 2544e2556.
[33] M.C. Turhan, R.P. Lynch, H. Jha, P. Schmuki, S. Virtanen, Electrochem. Commun. 12 (2010) 796e799.
[34] H.H. Elsentriecy, K. Azumi, H. Konno, Surf. Coat. Technol. 202 (2007) 532e537.
[35] Y. Zhu, G. Yu, B. Hu, X. Lei, J. Zhang, Appl. Surf. Sci. 256 (2010) 2988e2994.
[36] S. Verdier, N. van der Laak, S. Delalande, J. Metson, F. Dalard, Appl. Surf. Sci. 235 (2004) 513e524.
[37] K.Y. Chiu, M.H. Wong, F.T. Cheng, H.C. Man, Surf. Coat. Technol. 202 (2007) 590e598.
[38] T.F. Da Conceicao, N. Scharnagl, C. Blawert, W. Dietzel, K.U. Kainer, Thin Solid Films 518 (2010) 5209e5218.
[39] W. Ximei, Z. Liqun, L. Huicong, L. Weiping, Surf. Coat. Technol. 202 (2008) 4210e4217.
[40] K. Brunelli, M. Dabl a, I. Calliari, M. Magrini, Corros. Sci. 47 (2005) 989e1000.
[41] B.S. Padekar, R.K. Singh Raman, V.S. Raja, P. Lyon, Corros. Sci. 71 (2013) 1e9.
[42] M. Bobby Kannan, W. Dietzel, C. Blawert, A. Atrens, P. Lyon, Mater. Sci. Eng. 480 (2008) 529e539.
[43] E. Schaberger, D. Kahn, M. Lang, Prakt. Metallogr. 35 (1998) 306e315. [44] D.R. Lide, Handbook of Chemistry and Physics: a Ready-reference Book of Chemical and Physical Data : 2000-2001, 81st ed., CRC Press, 2000. [45] O. Levenspiel, Chemical Reaction Engineering, third ed., John Wiley &
Son, New York, 1999.
[46] I. Boukerche, S. Djerad, L. Benmansour, L. Tifouti, K. Saleh, Corros. Sci. 78 (2014) 343e352.
[47] P.E.A. Lima, R.S. Angelica, R.F. Neves, Appl. Clay Sci. 88-89 (2014) 159e162.
[48] S.-J. Yoo, H.-S. Yoon, H. Dong Jang, M.-J. Lee, S.-I. Lee, S. Tae Hong, H. Sang Park, Chem. Eng. J. 133 (2007) 79e84.
[49] S.-J. Yoo, D.-H. Kwak, J.-W. Lee, J.-G. Kim, Hydrometallurgy 96 (2009) 223e229.
[50] G. Ben-Hamu, D. Eliezer, K.S. Shin, S. Cohen, J. Alloys Compd. 431 (2007) 269e276.
[51] W.C. Neil, M. Forsyth, P.C. Howlett, C.R. Hutchinson, B.R.W. Hinton, Corros. Sci. 51 (2009) 387e394.
[52] J.W. Chang, X.W. Guo, P.H. Fu, L.M. Peng, W.J. Dind, Electrochim. Acta 52 (2007) 3160e3167.