HAL Id: hal-03112454
https://hal.archives-ouvertes.fr/hal-03112454
Submitted on 16 Jan 2021
HAL is a multi-disciplinary open access
archive for the deposit and dissemination of
sci-entific research documents, whether they are
pub-lished or not. The documents may come from
teaching and research institutions in France or
abroad, or from public or private research centers.
L’archive ouverte pluridisciplinaire HAL, est
destinée au dépôt et à la diffusion de documents
scientifiques de niveau recherche, publiés ou non,
émanant des établissements d’enseignement et de
recherche français ou étrangers, des laboratoires
publics ou privés.
Gas kinematics in powerful radio galaxies at z
2:
Energy supply from star formation, AGN, and radio jets
N. P. H. Nesvadba, G. Drouart, C. de Breuck, P. Best, N. Seymour, J. Vernet
To cite this version:
N. P. H. Nesvadba, G. Drouart, C. de Breuck, P. Best, N. Seymour, et al.. Gas kinematics in
powerful radio galaxies at z 2: Energy supply from star formation, AGN, and radio jets. Astronomy
and Astrophysics - A&A, EDP Sciences, 2017, 600, pp.A121. �10.1051/0004-6361/201629357�.
�hal-03112454�
DOI:10.1051/0004-6361/201629357 c ESO 2017
Astronomy
&
Astrophysics
Gas kinematics in powerful radio galaxies at z
∼
2: Energy supply
from star formation, AGN, and radio jets
?
,
??
N. P. H. Nesvadba
1, G. Drouart
2, C. De Breuck
3, P. Best
4, N. Seymour
2, and J. Vernet
41 Institut d’Astrophysique Spatiale, UMR 8617, Université Paris-Sud, Bât. 121, 91405 Orsay, France
e-mail: nicole.nesvadba@ias.u-psud.fr
2 CNRS, 91400 Orsay, France
3 International Center for Radio Astronomy Research, Curtin University, GPO Box U1987, 6102 Perth, Australia 4 European Southern Observatory, Karl-Schwarzschild Strasse 2, 85748 Garching bei München, Germany 5 SUPA, Institute for Astronomy, Royal Observatory of Edinburgh, Blackford Hill, Edinburgh, EH9 3HJ, UK
Received 20 July 2016/ Accepted 30 September 2016
ABSTRACT
We compare the kinetic energy and momentum injection rates from intense star formation, bolometric AGN radiation, and radio jets with the kinetic energy and momentum observed in the warm ionized gas in 24 powerful radio galaxies at z ∼ 2. These galaxies are among our best candidates for being massive galaxies near the end of their active formation period, when intense star formation, quasar activity, and powerful radio jets all co-exist. All galaxies have VLT/SINFONI imaging spectroscopy of the rest-frame optical line emission, showing extended emission-line regions with large velocity offsets (up to 1500 km s−1) and line widths (typically 800–
1000 km s−1) consistent with very turbulent, often outflowing gas. As part of the HeRGÉ sample, they also have FIR estimates of
the star formation and quasar activity obtained with Herschel/PACS and SPIRE, which enables us to measure the relative energy and momentum release from each of the three main sources of feedback in massive, star-forming AGN host galaxies during their most rapid formation phase. We find that star formation falls short by factors 10−1000 of providing the energy and momentum necessary to power the observed gas kinematics. The obscured quasars in the nuclei of these galaxies provide enough energy and momentum in about half of the sample, however, only if both are transferred to the gas relatively efficiently. We compare with theoretical and observational constraints on the efficiency of the energy and momentum transfer from jet and AGN radiation, which favors the radio jets as main drivers of the gas kinematics.
Key words. galaxies: kinematics and dynamics – galaxies: high-redshift – galaxies: active – galaxies: jets – quasars: general – galaxies: star formation
1. Introduction
Powerful radio galaxies (HzRGs) at high redshift (z >∼ 2) are ideal targets to study the late formation stages of massive galaxies in the early Universe. They have high stellar (e.g.,
De Breuck et al. 2001,2010;Seymour et al. 2007) and dynami-cal masses (Villar-Martín et al. 2003;Nesvadba et al. 2007), and often high star formation rates (SFR) of up to 1000 M yr−1 (Archibald et al. 2001;Reuland et al. 2004;Drouart et al. 2014), with implied formation times of a few 100 Myr. They host lumi-nous, obscured quasars (e.g.,Carilli et al. 2002;Overzier et al. 2005; Drouart et al. 2014), and have powerful radio jets (e.g.,
Carilli et al. 1997;Pentericci et al. 2000), indicating that they are the host galaxies of some of the most powerful active galactic nuclei. Their black hole masses fall near the upper end of the mass function of supermassive black holes in nearby galaxies (Nesvadba et al. 2011a), and scale with the mass of their host galaxies in a fairly similar way to nearby galaxies which fall onto the local black hole–bulge mass relationship, suggesting
? Based on observations carried out with the Very Large Telescope
of ESO under Program IDs 079.A-0617, 084.A-0324, 085.A-0897, and 090.A-0614.
?? Herschelis an ESA space observatory with science instruments
pro-vided by European-led Principal Investigator consortia and with impor-tant participation from NASA.
they must be near the end of their active formation period.
Drouart et al.(2014) argued that the black holes of HzRGs will outgrow the plausible mass range for supermassive black holes even in very massive galaxies if their growth continues for more than a few 107 yr, further highlighting that we are ob-serving these sources at a critical moment in their evolution. The same is suggested by their high stellar masses, which ex-ceed the amounts of remaining molecular gas by factors of 10 or more (Seymour et al. 2007;De Breuck et al. 2010;Emonts et al. 2014), limiting their potential future growth in stellar mass.
HzRGs are often surrounded by extended nebulosi-ties of high surface-brightness, warm ionized gas (e.g.,
Villar-Martín et al. 2003; Nesvadba et al. 2008a) with sizes of up to about 60 kpc, and irregular gas kinematics with veloc-ity offsets and line full widths at half maximum (FWHMs) of up to 1000 km s−1. In very powerful HzRGs, these veloc-ities are above the escape velocity from the gravitational po-tential of massive galaxies, suggesting that this gas is out-flowing (Villar-Martín et al. 2003;Nesvadba et al. 2006,2008a). In galaxies with more moderate jet power, smaller scale outflows and turbulence seem to be dominant (Collet et al. 2016;Nesvadba et al. 2016, N16 hereafter). The high surface-brightness emission line regions are in most cases elongated along the radio jet axis, and their sizes typically do not exceed the jet size. Dynamical times are comparable to the radio-jet
lifetime. This supports the interpretation that these are outflows of ambient, warm ionized gas that has been entrained by the ex-panding “cocoon” of hot, shocked gas inflated by the radio jet (Nesvadba et al. 2006,2008a).
However, powerful radio galaxies are complex environments where star formation and bright quasar activity co-exist with the powerful radio jets, and it has so far been impossible to compare the possible relative contribution from star formation and quasar activity to the gas kinematics in these systems directly. Star for-mation as a possible driver of extended, super-galactic bubbles has been suggested by, e.g.,McCarthy(1999),Taniguchi et al.
(2001),Zirm et al.(2005), andHumphrey et al.(2009). Some of this star formation could be extended in the halo surrounding the radio galaxy itself (e.g.,Hatch et al. 2008,2013).
Estimating star formation rates in high-redshift radio galax-ies is observationally challenging. Common star formation trac-ers like the UV continuum, bright optical emission lines like Hα, or rest-frame mid-infrared photometry probing polycyclic aro-matic hydrocarbons (PAHs) are generally not reliable tracers of star formation in active galactic nucleus (AGN) host galaxies be-cause they are either contaminated or even dominated by heating through AGN photons and shocks. Although 850 µm photome-try with SCUBA has been obtained in the past, and provided interesting qualitative evidence of star formation in HzRGs, deriving robust quantitative constraints has been difficult be-cause of the uncertain spectral shapes and dust temperatures in HzRGs. In addition, the large beam of single-dish measurements raises the dangers of confusing star formation within the radio galaxy with star formation in nearby companion galaxies that fall within the same beam (e.g. De Breuck et al. 2001;Ivison et al. 2008; Nesvadba et al. 2009; Drouart et al. 2014; Emonts et al. 2014). This risk is particularly high in HzRGs since they are predominantly probing dense environments, presumably form-ing galaxy clusters (Hatch et al. 2009). Furthermore, by analogy with Spitzer and Herschel observations of nearby radio galaxies, we suspect that even at rest-frame wavelengths of 100−200 µm, as probed in the 850 µm band in galaxies at redshifts z ∼ 2−3, the far-infrared (FIR) continuum can still be dominated by the AGN, not the star formation (Tadhunter et al. 2014).
Having a sample of HzRGs with good mid- to far-infrared coverage to disentangle dust heating through AGN radiation and star formation is therefore necessary to study the role of feed-back from each process in powerful high-redshift radio galaxies. In addition, we need good constraints on the gas kinematics, ide-ally over the whole projected surface of the nebulosities.
We present an analysis of the gas energetics in a sample of 24 HzRGs at z >∼ 2, which have good infrared constraints of ob-scured AGN and star formation activity, and also rest-frame op-tical imaging spectroscopy of warm ionized gas. These galaxies are the subset of sources from the HeRGÉ project (Drouart et al. 2014;Seymour et al. 2012), which are also part of our SINFONI study of 49 HzRGs at z >∼ 2 (Nesvadba et al. 2006,2007,2008b,
2011a;Collet et al. 2015,2016; N16). Our sources have AGN luminosities in the range of Lbol,AGN= few × 1013 L and radio power of ≥1027W Hz−1. They are among the most luminous ob-scured, radio-loud quasars, and are also among the best studied radio galaxies at their epoch. In our previous work we provided a number of observations suggesting that the jet most likely dom-inates the kinetic energy injection into the gas, including a close alignment between the jet axis and the kinematic and morpho-logical major axis of the gas, and velocity jumps or elevated line widths near bright radio features in some galaxies. However, as encouraging as these findings are, it is not sufficient to show that the jet can plausibly accelerate the gas; we also need to show
that alternative mechanisms are less likely. This has now become possible thanks to the HeRGÉ constraints, and is the goal of the present study.
Seymour et al. (2012) have already carried out a similar analysis for one galaxy of our set. For the Spiderweb galaxy MRC 1138−262 at z= 2.16, they estimated a bolometric power of the AGN of Lbol,AGN∼ 7 × 10¹³L and argued that this would suffice to power the outflow with kinetic energy of Lkin ∼ 8 × 10¹²L
observed in MRC 1138−262 byNesvadba et al.(2006). Hence the AGN and the radio jet would seem energetically capa-ble of driving the gas kinematics in this galaxy, if about 10% of the bolometric luminosity of the AGN was transformed into ki-netic energy of the gas. In turn, the kiki-netic energy released by the star formation in MRC 1138−262, although one of the most vig-orously star-forming high-redshift radio galaxies known, would not be sufficient (Nesvadba et al. 2006;Seymour et al. 2012).
Building upon these results for a first galaxy, we present a di-rect comparison of the energy injection rates from star formation, quasar bolometric power and radio jets. We expand the previous results by including all 24 galaxies with Herschel photometry and VLT/SINFONI imaging spectroscopy, and by analyzing the energy as well as the momentum injection into the gas. We dis-cuss our results in light of recent feedback models.
Throughout the paper we adopt a flat H0= 70 km s−1Mpc−1 concordance cosmology withΩM= 0.3 and ΩΛ= 0.7.
2. Mid- to far-infrared SEDs and IR luminosities
The set of galaxies we study here is a subset of the HeRGÉ set of 70 distant radio galaxies at redshifts 1 < z < 5.2 with Herschel PACS and SPIRE photometry in the far-infrared (Drouart et al. 2014;Seymour et al. 2012). These galaxies were also observed with SINFONI and are therefore at redshifts where bright emission lines fall into the near-infrared atmospheric win-dows (predominantly z ∼ 2.0−2.6, and z ∼ 3.0−3.6 N16), and at either southern or equatorial declinations. All the galax-ies also have Spitzer mid-infrared photometry (Seymour et al. 2007;De Breuck et al. 2010), and sub-mm photometry obtained with either JCMT/SCUBA (Archibald et al. 2001;Reuland et al. 2004) at 850 µm, or APEX/LABOCA (Drouart et al. 2014) at 870 µm. In total, their infrared to submillimeter spectral en-ergy distributions cover the wavelength range between 16 and 870 µm.
Drouart et al.(2014) used DecompIR (Mullaney et al. 2011) to decompose these SEDs into an AGN and a starburst compo-nent, using the empirical templates ofMullaney et al.(2011) for both components.Mullaney et al. (2011) provide five different empirical templates for the starburst component. Most of the galaxies in our present sample are best fit by their SB 2 tem-plate, i.e., the infrared spectral energy distribution of NGC 7252 (Drouart et al. 2014, their Table 6). The 24 sources we are con-cerned with here have infrared luminosities from AGN and star formation between 1.6 and 24.5 × 10¹² L
and 2.2 and 10.5 × 10¹²L
, respectively (Table 6 ofDrouart et al. 2014), in-tegrating over wavelengths 8−1000 µm in the rest-frame. Spec-tral decompositions for individual sources are shown in Fig. D.1 ofDrouart et al.(2014).
3. Kinetic energy and momentum of the warm ionized gas
All the galaxies have also been observed with the SINFONI imaging spectrograph on the Very Large Telescope of ESO
Fig. 1.Average (yellow shaded histogram) and maximum (dark green hatched histogram) FWHMs of our sources, and of their velocity offsets (dark red hatched histogram).
(Nesvadba et al. 2006, 2008a; Collet et al. 2016, N16). SIN-FONI is an image slicer with 800× 800 field of view operating in the near-infrared J, H, and K bands with spectral resolving power between R= 1500 and 3000. We mainly used the seeing limited mode with spatial sampling of 125 mas × 250 mas to ob-serve the bright rest-frame optical emission lines, in particular [OIII]λλ4959, 5007 and Hα, depending on redshift.
Figure1summarizes the kinematic properties of the warm ionized gas in our galaxies, which has already been presented in greater detail byN16, in the form of three histograms: we show the average and maximal FWHM measured from [OIII]λ5007 in our SINFONI cubes for each galaxy, and the maximum ve-locity offset in the extended emission line gas. The average FWHM ranges from FW H Mavg = 400 km s−1to 1100 km s−1, and reaches 2500 km s−1in USS 1243+036. It represents the av-erage of all local FWHMs measured typically from [OIII]λ5007 in all spatial pixels in a given galaxy where the signal-to-noise ratio exceeds three. The maximum FWHM measured in small regions of our sources are between 700 km s−1and 1950 km s−1, and are typically about 500 km s−1 greater than the average FWHM (N16). The velocity offsets are between 100 km s−1and 1300 km s−1for most sources. We note that even if we corrected the velocity offsets by fiducial factors 2−3 to account for incli-nation effects, the radial velocities of the gas would typically not exceed the FWHM line widths.
A potential caveat of these estimates might be that [OIII]λ5007 is probing a highly ionized state of a trace element, and may therefore not be a representative tracer of the dominant mass component. However,N16compared the velocity fields of [OIII]λ5007 and Hα in the nine galaxies where both are emitted from spatially well-extended regions and at good signal-to-noise ratios, finding little cause for alarm, at least at the spatial resolu-tions of about 5–10 kpc reached with this study.
Our imaging spectroscopy data provide several constraints that we can use to estimate the kinetic energy in the warm ion-ized gas of our sources. We followNesvadba et al.(2006) in esti-mating the energy necessary to inflate a hot bubble adiabatically to the sizes, r, and velocities,∆v, as observed:
dE/dt= 1.5 × 1046× r2×∆v3 × n0erg s−1 (1) where r is the radius of the bubble in units of 10 kpc.∆v is given in units of 1000 km s−1, and we adopt n0= 1 cm−3for the density of the gas into which the bubble expands.
Fig. 2.Emission-line FWHM (top) and velocity offset (bottom) as a function of stellar mass, as estimated by Seymour et al. (2007) and
De Breuck et al.(2010) from Spitzer near- to mid-infrared photometry. The red dots show the galaxies from our sample, the small black empty squares the stellar-mass selected sample ofBuitrago et al.(2014) with-out powerful AGN for comparison. We do not find a correlation for our sample in either relationship.
This estimate does not depend on the total gas mass, and is therefore not affected by gas in other phases than the warm ion-ized phase, which may contribute significantly to the total mass in the outflow (e.g.,Cicone et al. 2014). The only requirement is that the gas kinematics are representative of the terminal out-flow velocity, which should be the case, because they subtend large volumes surrounding the galaxy relatively evenly and have moderate densities compared to the colder, and perhaps domi-nant, gas phases (N16). Table1shows that the resulting kinetic energy in our targets is between log Egas= 43.0 and 47.5 erg s−1.
4. Stellar masses and gravitational motion
Before turning to the potential astrophysical mechanisms that may power the gas kinematics in our HzRGs, we first present our arguments for why gravitational motion is unlikely to play a large role.Seymour et al.(2007) andDe Breuck et al.(2010) used Spitzer and ground-based photometry to decompose the op-tical to infrared spectral energy distributions of our sources into their stellar and AGN dust components, obtaining robust stellar mass estimates (or at least upper limits) for most of them. Most HzRGs fall into a small range of (high) stellar masses around log Mstellar/M = 11.5 ± 0.3.
In Fig. 2, we show the total velocity offsets and average FWHMs of the gas as a function of the stellar mass derived by Seymour et al. (2007) and De Breuck et al. (2010) for the sources we study here. We find no evidence of a relationship be-tween stellar mass and velocity or FWHM, as measured across the extended emission-line regions, and consider this additional evidence that gravity does not play a large role in the gas mo-tion in our sources. We also show the sources ofBuitrago et al.
(2014), to our knowledge the only available stellar mass selected sample of galaxies in the early Universe with rest-frame optical imaging field spectroscopy and with Mstellar > 1011 M . This adds to the arguments already presented byCollet et al.(2016) andN16, namely that the velocity and dispersion maps of the gas are very complex and inconsistent with simple rotating disks, that line widths are systematically and significantly greater than in quiescent high-z bulges with similar stellar mass, and that their ratios of velocity gradients to line widths are inconsistent with
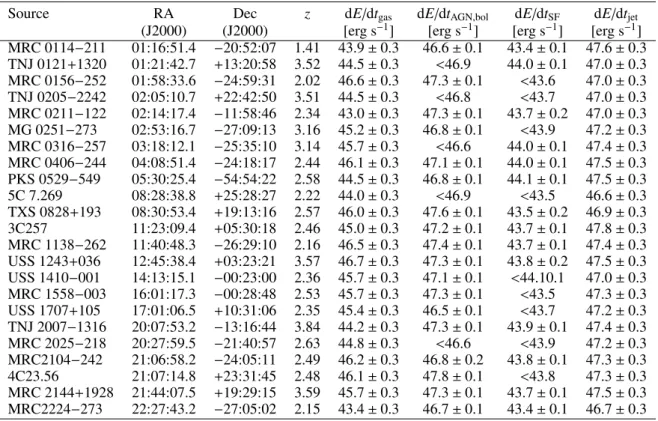
Table 1. Coordinates, redshifts, gas kinetic energy, AGN bolometric power, and kinetic energy from star formation and radio jet for the sources in this sample.
Source RA Dec z dE/dtgas dE/dtAGN,bol dE/dtSF dE/dtjet (J2000) (J2000) [erg s−1] [erg s−1] [erg s−1] [erg s−1] MRC 0114−211 01:16:51.4 −20:52:07 1.41 43.9 ± 0.3 46.6 ± 0.1 43.4 ± 0.1 47.6 ± 0.3 TNJ 0121+1320 01:21:42.7 +13:20:58 3.52 44.5 ± 0.3 <46.9 44.0 ± 0.1 47.0 ± 0.3 MRC 0156−252 01:58:33.6 −24:59:31 2.02 46.6 ± 0.3 47.3 ± 0.1 <43.6 47.0 ± 0.3 TNJ 0205−2242 02:05:10.7 +22:42:50 3.51 44.5 ± 0.3 <46.8 <43.7 47.0 ± 0.3 MRC 0211−122 02:14:17.4 −11:58:46 2.34 43.0 ± 0.3 47.3 ± 0.1 43.7 ± 0.2 47.0 ± 0.3 MG 0251−273 02:53:16.7 −27:09:13 3.16 45.2 ± 0.3 46.8 ± 0.1 <43.9 47.2 ± 0.3 MRC 0316−257 03:18:12.1 −25:35:10 3.14 45.7 ± 0.3 <46.6 44.0 ± 0.1 47.4 ± 0.3 MRC 0406−244 04:08:51.4 −24:18:17 2.44 46.1 ± 0.3 47.1 ± 0.1 44.0 ± 0.1 47.5 ± 0.3 PKS 0529−549 05:30:25.4 −54:54:22 2.58 44.5 ± 0.3 46.8 ± 0.1 44.1 ± 0.1 47.5 ± 0.3 5C 7.269 08:28:38.8 +25:28:27 2.22 44.0 ± 0.3 <46.9 <43.5 46.6 ± 0.3 TXS 0828+193 08:30:53.4 +19:13:16 2.57 46.0 ± 0.3 47.6 ± 0.1 43.5 ± 0.2 46.9 ± 0.3 3C257 11:23:09.4 +05:30:18 2.46 45.0 ± 0.3 47.2 ± 0.1 43.7 ± 0.1 47.8 ± 0.3 MRC 1138−262 11:40:48.3 −26:29:10 2.16 46.5 ± 0.3 47.4 ± 0.1 43.7 ± 0.1 47.4 ± 0.3 USS 1243+036 12:45:38.4 +03:23:21 3.57 46.7 ± 0.3 47.3 ± 0.1 43.8 ± 0.2 47.5 ± 0.3 USS 1410−001 14:13:15.1 −00:23:00 2.36 45.7 ± 0.3 47.1 ± 0.1 <44.10.1 47.0 ± 0.3 MRC 1558−003 16:01:17.3 −00:28:48 2.53 45.7 ± 0.3 47.3 ± 0.1 <43.5 47.3 ± 0.3 USS 1707+105 17:01:06.5 +10:31:06 2.35 45.4 ± 0.3 46.5 ± 0.1 <43.7 47.2 ± 0.3 TNJ 2007−1316 20:07:53.2 −13:16:44 3.84 44.2 ± 0.3 47.3 ± 0.1 43.9 ± 0.1 47.4 ± 0.3 MRC 2025−218 20:27:59.5 −21:40:57 2.63 44.8 ± 0.3 <46.6 <43.9 47.2 ± 0.3 MRC2104−242 21:06:58.2 −24:05:11 2.49 46.2 ± 0.3 46.8 ± 0.2 43.8 ± 0.1 47.3 ± 0.3 4C23.56 21:07:14.8 +23:31:45 2.48 46.1 ± 0.3 47.8 ± 0.1 <43.8 47.3 ± 0.3 MRC 2144+1928 21:44:07.5 +19:29:15 3.59 45.7 ± 0.3 47.3 ± 0.1 43.7 ± 0.1 47.5 ± 0.3 MRC2224−273 22:27:43.2 −27:05:02 2.15 43.4 ± 0.3 46.7 ± 0.1 43.4 ± 0.1 46.7 ± 0.3 Notes. FIR luminosities from AGN and star formation have been given byDrouart et al.(2014), and 1.4 GHz radio power inN16.
the ellipticities for both fast and slow rotators in the Atlas3D sam-ple of nearby galaxies.
The broad line widths and high velocities further suggest that an additional energy and momentum input mechanism must be present in the HzRGs. In the following sections we use our ob-servational constraints on star formation rates, AGN bolomet-ric power, and radio jets to further discuss which of these three dominates.
5. Power of star formation
Intense star formation in galaxies releases kinetic energy and momentum into the ambient gas in form of stellar winds from young stars and through expanding shells of supernova rem-nants, which interact, mix, and thermalize, producing smooth, galaxy-wide outflows (e.g., Heckman et al. 1990; Lehnert & Heckman 1996a; 1996b). Observations and simulations have now reached a broad consensus that about 40% of the ini-tial 1051 erg of kinetic energy released by a supernova is carried by galactic winds (e.g., Dalla Vecchia & Schaye 2008;
Sharma et al. 2014;Veilleux et al. 2005;Strickland & Heckman 2009), thus releasing about 1−2 × 1049 erg of kinetic energy per solar mass of stars formed into the interstellar medium (Dalla Vecchia & Schaye 2008). The precise estimate depends most strongly on the assumptions about the initial mass function of star formation and the details of the thermalization and mass loading process. Here we adopt an energy release of 1049 erg per solar mass of star formation.
We estimate the kinetic energy released by star formation in our HzRGs from the starburst component of the far-infrared lu-minosity measured byDrouart et al.(2014), and calculate a star
formation rate by setting SFR = 4.5 × 10−44 LFIR (Kennicutt
1998). The SFR is given in M yr−1, and the FIR luminos-ity in erg s−1. Kennicutt(1998) derived this relationship for a Salpeter initial mass function; we divide the star formation rates by a factor of 1.8 to match the Chabrier initial mass function more commonly used today (Chabrier 2003).
With star formation rates between 211 and 550 M yr−1, and using the above mentioned scaling that supernovae release on average 1 × 1049 erg of kinetic energy per solar mass of stellar mass formed, we find kinetic energies between 1.7 × 1044erg s−1 and 2.2 × 1045erg s−1. This corresponds to 0.4−5.8 × 10¹¹L .
To determine the momentum produced by the star forma-tion in our sources, we rely on the recent empirical study of powerful starburst-driven winds in low-redshift galaxies by
Heckman et al. (2015), who find that the momentum injection per solar mass of new stars formed is about 4.8 × 1033 dyn. This includes the contribution of ram pressure from the hot wind medium as well as that of radiation pressure. They also find that the starburst must inject about 10× more momentum into the gas than is necessary to unbind the wind, in order to pro-duce clear outflow signatures. In our targets this corresponds to 9 × 1035dyn to 6 × 1036dyn. Values for individual galaxies are listed in Table1.
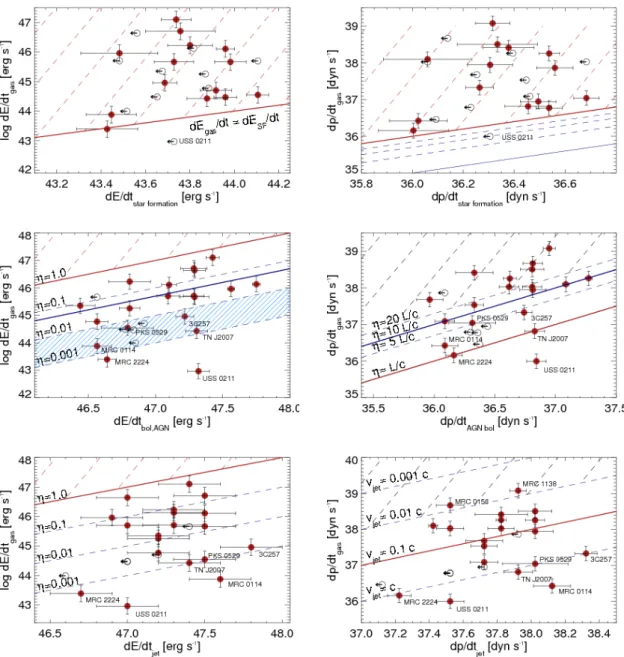
Figure3shows the kinetic energy and momentum of the gas as a function of the energy and momentum that are released by star formation with the above estimates. Nearly all sources are above the solid black line for at least one quantity, with only one exception, USS 0211−122 at z = 2.1. This galaxy has unusu-ally narrow emission lines for our overall sample, and a distinc-tive unresolved broad component, which is also unusual for our sample (N16).Vernet et al.(2001) also found it was an outlier
Fig. 3.Relationships between the observed kinetic energy (left) and momentum (right) of the gas, for star formation (top), AGN radiation (center) and radio jets (bottom). Filled red and empty black dots show galaxies with FIR detections and upper limits, respectively. Error bars show the measurement uncertainties. Red wide-spaced dashed regions are excluded by energy and momentum conservation, black wide-spaced dashed regions by empirical constraints on the maximum momentum transfer from AGN radiation and radio jet, respectively. In the top right panel, the red and blue solid lines show momentum transfer of 100 and 10% of that provided by star formation, respectively.Heckman et al.(2015) argued that 10% efficiency is most likely. Thin dashed dark blue lines show transfer rates of 30, 50, and 70%. In the middle left panel, the red line shows an energy transfer of 100%, the blue line 5% required by cosmological models, the hatched region of 0.1–1% of Lbolto gas kinetic energy. The latter is
favored by observations of FeLoBALs (Moe et al. 2009;Dunn et al. 2010;Bautista et al. 2010) and hydrodynamic models taking radiative transfer explicitly into account (Bieri et al. 2017;Krumholz & Thompson 2012). The same observations and models also favor an average momentum transfer of L/c (red line in the middle right panel), whereas more optimistic models find L/c ∼ 10 (dark blue solid line;Zubovas & King 2012;
Faucher-Giguère & Quataert 2012). In the bottom left panel, the red solid line represents an energy transfer of 100% from jet to gas, and in the bottom right panelthe momentum transfer for the most likely jet expansion velocity of 0.1c. Dashed dark blue lines show the momentum input from the jet for different assumptions of the jet advance speed, assuming that no momentum is lost to other effects. It is therefore not impossible to find galaxies below the line for a jet expansion at the speed of light, c (lowest dark-blue dashed line), due to geometry, gas clumpiness, and other effects.
compared to other HzRGs, with unusually high levels of polar-ization consistent with low levels of star formation, high nitrogen abundance suggesting high levels of secondary nitrogen produc-tion, and perhaps a very advanced evolutionary state.
The remaining 23 galaxies require more energy and momen-tum input than can be provided by star formation, by up to three orders of magnitude, even if this energy and momentum were
transferred into the interstellar medium at 100% efficiency. This is likely not a realistic assumption. Observations of starburst-driven winds suggest that efficiencies are more in the range of a few times 10% (Strickland & Heckman 2009) for the energy, and about 10% for the momentum transfer (Heckman et al. 2015), larger than the potential systematic uncertainties. The latter ef-ficiency is shown as a dashed black line in the top right panel
Fig. 4.Left: FIR luminosity between 8 and 1000 µm, and the 1.4 GHz monochromatic power, i.e., the quantities used to estimate the kinetic energy of the different possible drivers discussed in this paper. The yellow filled, red hatched, and green hatched diagrams correspond to bolometric AGN power, star formation, and radio power, respectively. We only include sources with Herschel detections. Right: same histograms showing the kinetic energy corresponding to the FIR luminosity and monochromatic radio power at 1.4 GHz, derived with the methods described in Sects.5
and6.
of Fig.3. Many theoretical studies suggest values that are even lower (e.g.,Krumholz & Thompson 2012;Bieri et al. 2017). As an additional caveat, recent ALMA arcsec-resolution observa-tions have shown that most of the FIR emission from star for-mation does not necessarily come from the radio galaxy itself, but from nearby companion galaxies (Gullberg et al. 2016, see also Ivison et al. 2008; N16). This would also suggest that we might overestimate the energy and momentum input rates shown in Fig. 3. Taking these arguments into account only reinforces our finding that star formation in these galaxies does not pro-duce sufficient kinetic energy or momentum to power the gas kinematics as observed.
6. Bolometric AGN radiation
Observations of broad quasar absorption lines have provided se-cure evidence of fast outflows within the nuclei of powerful AGN for several decades, but observational evidence that such out-flows may also extend into the kpc range away from galactic nu-clei is being found only now (e.g.,Liu et al. 2013a,b;Sun et al. 2014), although observations of broad, blueshifted emission-line wings from the narrow emission-line region have been known for much longer (e.g., Heckman et al. 1984; Greene & Ho 2005;
Woo et al. 2016). The bolometric luminosity emitted by pow-erful quasars during their lifetimes corresponds approximately to the binding energy of their massive host galaxy (e.g.,
Silk & Rees 1998). Quasars might therefore in principle drive large-scale outflows if the radiated energy and momentum are deposited in the ambient gas at high enough efficiency. Cosmo-logical models of galaxy evolution suggest that about 0.2−0.5% of the rest-mass energy equivalent of a supermassive black hole must be injected to reproduce the observed black-hole bulge (mass) relationships (e.g.,Di Matteo et al. 2005), corresponding to about 2–5% of the bolometric luminosity of the AGN for a radiative accretion efficiency onto the black hole of 0.1.
To estimate the bolometric quasar power, we rely on the AGN component of the FIR spectral energy distributions of
Drouart et al. (2014, their Table 6), and multiply by a factor of 6 (again followingDrouart et al. 2014), to find the bolomet-ric quasar luminosities listed in Table1 of between 6.6 × 1045 and 5.6 × 1047 erg s−1. These estimates are uncertain by factors of a few (Drouart et al. 2014) for two main reasons: First, the AGN torus model adopted by Mullaney et al. (2011) assumes
relatively high dust temperatures, which would maximize the FIR AGN luminosity by a factor of ∼ 2 at the expense of the FIR luminosity from star formation, which would be underesti-mated by a similar factor. However, if the torus component is not sufficiently extended, or if a significant part of the star forma-tion occurs in companion galaxies, we would overestimate the starburst and underestimate the AGN component (Drouart et al. 2016). Second, as already pointed out byDrouart et al. (2014, their Appendix C), the adopted AGN spectral shape used for the bolometric correction is also uncertain by factors of a few. We adopted their favored bolometric correction factor 6 obtained from the classical QSO template byElvis et al.(1994); the tem-plate ofRichards et al.(2006) would have resulted in a bolomet-ric correction factor of 5. For four galaxies from the present sam-ple Nesvadba et al. (2011a) estimated bolometric luminosities from the luminosity and width of the broad nuclear Hα line, find-ing values between log Lbol = 46.6 and 46.8 erg s−1, consistent with X-ray constraints in the two cases where X-ray constraints were available. Generally, these estimates are in the lower range of the log Lbol = 46.6 to 47.4 erg s−1found with the approach of
Drouart et al.(2014). Therefore, we cannot exclude that we over-estimate our bolometric AGN luminosities by factors of a few. In the present case, however, we wish to distinguish between the impact of quasar radiation and radio jets, which means that this is a conservative choice that maximizes the potential impact of the quasar radiation.
In Fig.4we compare the far-infrared luminosities from the quasar and from star formation in our targets, finding that both are quite similar, about few 1012L for most targets. It is, how-ever, also interesting to compare the kinetic power released by the starburst, estimated in the way described in Sect.5, with that from the AGN, assuming that 5% of the bolometric AGN power is turned into mechanical energy of the gas. Figure4shows that the kinetic energy from the AGN radiation exceeds that produced by star formation by one to two orders of magnitude.
The AGN could therefore unbind the gas at least in some of the sample. This is also shown in the middle left panel of Fig.3
where we show the kinetic energy of the gas in each AGN host galaxy as a function of the bolometric AGN luminosity. The red solid line shows where the ratio of both is unity, and the dark blue dashed lines indicate conversion efficiencies between 0.1 and 10% between bolometric luminosity and gas kinetic energy. The dark blue line shows the 5% efficiency suggested by the
black-hole bulge mass relationship. If this efficiency is approx-imately correct, then the AGN should provide sufficient energy to unbind the gas in about two-thirds of our sample.
It is, however, still a matter of active debate among observers and modelers whether feedback efficiencies as high as a few per-cent are not unrealistically high. Observations of molecular gas in very dense, vigorously star-forming circumnuclear environ-ments of nearby AGN/starburst composites suggest that simi-larly high conversions are necessary if the AGN is to dominate the observed gas kinematics. In turn, observations of UV ab-sorption lines in FeLoBALs only find efficiencies between 0.1 and 1% (Moe et al. 2009;Dunn et al. 2010;Bautista et al. 2010). FeLoBALs are thought to trace winds with particularly high dust column densities where the energy deposition efficiencies should thus be high over comparably large radii. In Fig.3this range cor-responds to the light blue dashed region. We label all galaxies that fall into or below this region in this diagram, and we return to a more detailed discussion of their properties below (Sect.8). In addition to the energy transfer, the quasar radiation also in-jects momentum into the gas. Each time a photon is scattered on a gas or dust particle, a momentum of hν/c is transferred, leading to a total momentum transfer of ξLbol/c, where the “momentum boost” ξ corresponds to the number of scatterings suffered by a photon before it escapes, depending on the wavelength of the photon and the optical depth along the path.
In the middle right panel of Fig.3 we show the momen-tum of the gas as a function of the momenmomen-tum from the quasar radiation for different assumptions of ξ between ξ = 1 and ξ = 20. Most smoothed particle hydrodynamic models find that momentum transfer of up to 20 Lbol/c is necessary to ex-plain efficient AGN feedback as implied by the black hole–bulge scaling relations, but make simplified assumptions, for example on the radiative transfer or the energy and momentum transfer from the hot AGN wind onto the ambient gas. The recent mod-els ofZubovas & King(2012) andFaucher-Giguère & Quataert
(2012), which combine the effects of the acceleration of gas in an expanding blastwave and radiation pressure, suggest a mo-mentum boost of about ξ = 10, highlighted as a blue solid line in Fig.3.
Analytical work and hydrodynamic models taking radiative transfer explicitly into account find, however, that most AGN host galaxies, except perhaps in the densest star-forming re-gions in ULIRGs, globally may only reach a much lower to-tal momentum transfer of about Lbol/c (red line in Fig.3; e.g.,
Murray et al. 2005; Novak et al. 2012;Krumholz & Thompson 2013). In an adaptive-mesh simulation with a simplified but nonetheless explicit radiation transfer method,Bieri et al.(2017) recently found a rapid decrease from about 30 to less than 1 × Lbol/c within the first 107 yr after the ignition of the ra-diative AGN. The reason is that the radiation escapes relatively easily after the AGN has blown low-density channels into the dense gas clouds by which it is initially enshrouded. This is also more in line with the observations of FeLoBALs. Likewise,
Veilleux et al.(2013) suggested that molecular outflows from the highest density inner regions of nearby ULIRGs harboring pow-erful, dust-enshrouded AGN, which are likely driven mainly by radiation pressure, may subside once the AGN has cleared a path through the ambient dust and gas clouds. Nonetheless, radiation pressure and disk winds could perhaps play a role during early feedback phases in our galaxies before the winds have broken away from the direct surroundings of the AGN in the central re-gions of the host galaxy. While a momentum boost of ξ= 10−20 would appear sufficient to power the observed outflows in about half of our sample; with ξ = 1, the obscured quasars in our
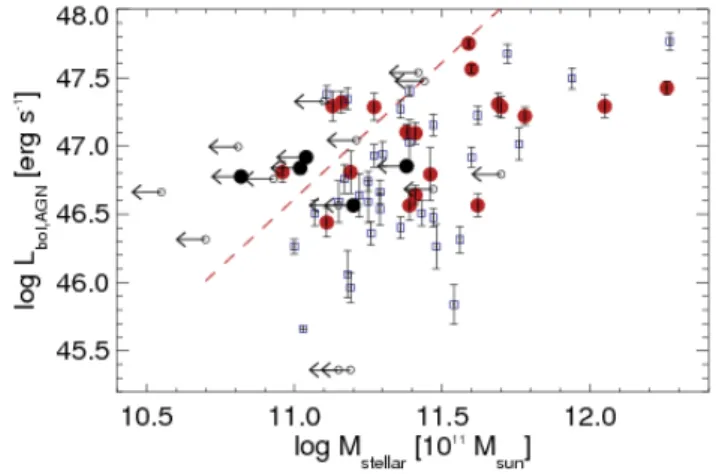
Fig. 5.Critical AGN luminosity for radiatively driven quasar winds in the model ofMurray et al.(2005) as a function of stellar mass. Large filled red dots and filled black dots show galaxies from our sample with measurements and upper limit of stellar mass, respectively. Small empty blue boxes and small empty black dots show the HeRGE galaxies without SINFONI observations and with measurements and upper lim-its on stellar mass, respectively. Quasar luminosities were taken from
Drouart et al.(2014) and correspond to their AGN component of the FIR luminosity, which was scaled by a factor of 6 to approximate the bolometric QSO luminosity. The dashed red line shows the critical lu-minosity at which the momentum carried by the quasar radiation may balance gravity (seeMurray et al. 2005, for details).
galaxies would be too weak for all but three sources with mea-surements of Lbol (and one with an upper limit) to explain the observed gas kinematics. We have labeled these galaxies indi-vidually in Fig. 3, and discuss their specific properties in more detail in Sect.8after examining the role of the radio jets.
The same is found when comparing the AGN bolometric luminosities in our galaxies with those required to balance the gravitational potential of the host galaxy through radiation pres-sure (but not necessarily, to remove the gas through an outflow).
Murray et al.(2005) introduced such a quantity for a model of the combined feedback from the radiation produced by AGN and star formation. They find that in the most fortuitous case, when the surroundings of the AGN are optically thick, the AGN must emit a critical luminosity Lc = 4 fgcσ4/G that depends on the gas fraction, fg, and stellar velocity dispersion, σ; G is the gravitational constant.
Using the stellar mass estimates of Seymour et al. (2007) andDe Breuck et al.(2010) typically of a few 1011 M , and the molecular, atomic, and warm ionized gas mass estimates of, e.g.,
Emonts et al.(2014),Gullberg et al.(2016), andNesvadba et al.
(2016), we find that the typical gas fractions in HzRGs are about 10%. Adopting the virial theorem to estimate σ from the same stellar masses by setting M = cσ2 r
e/G, we find σ = 300−350 km s−1for galaxies with M
stellar= 2−4 × 10¹¹ M (see alsoNesvadba et al. 2011b). c is a constant that depends on the radial mass profile. We use c = 5 (Bender et al. 1992), and adopt re = 2 − 3 kpc for the effective radius of the galaxy. In Fig.5 we show where the bolometric AGN luminosity of our galaxies falls relative to the stellar mass and the critical lumi-nosity implied byMurray et al.(2005, red dashed line). All but seven sources have AGN that would not be luminous enough to exceed the critical luminosity to unbind the gas.
7. Radio jets
Centimeter radio jets are powered by the synchrotron emission from relativistic particles, with an emissivity that depends on the
surrounding gas density and magnetic field strength, and is dif-ficult to quantify accurately from first principles. Therefore, a number of empirical measures have been developed to estimate the kinetic power of a radio jet from the observed monochro-matic radio power at a given frequency. To estimate the global impact of the radio jets on the gas, we rely upon the relationship ofCavagnolo et al.(2010), who measured the mechanical work done by radio jets in massive galaxy clusters to inflate cavities in the intracluster medium, thereby providing empirical estimates of the work done by the jet against the surrounding gas.
The radio power of the entire SINFONI sample, including the 24 galaxies discussed here, has already been derived byN16
by interpolating the observed multifrequency radio fluxes in the NASA/IPAC Extragalactic Database NED. Results for individ-ual targets are given in their Table 3. We summarize here only the global results for our present targets in the form of the green histograms in Fig. 4. The left panel shows the distribution of the radio power at rest-frame 1.4 GHz. To ease the comparison with the far-infrared luminosity from star formation and AGN, we also measure the radio luminosities in solar units, finding that our sources fall into a range of log P1.4 = 1010−1012 L (which corresponds to 1027−29W Hz−1 at 1.4 GHz in the rest-frame). Our sources thus include some of the most powerful radio sources known at their redshift. Nesvadba et al. (2016) also demonstrate that these estimates are in good agreement with the empirical calibration of, e.g.,Willott et al.(2000), and also detailed studies of the X-ray and radio spectral properties in two nearby isolated radio galaxies (Harwood et al. 2016). They are conservative estimates, in that they predict a jet ki-netic power that is about 0.2−0.3 dex lower than estimates by
Turner & Shabala (2015). The latter take into account that the radio emission should become fainter as the radio lobes expand (see alsoKaiser & Alexander 1997).
The right panel of Fig.4shows the kinetic power of the ra-dio jets obtained with theCavagnolo et al.(2010) approach. The values are about an order of magnitude greater than those of the bolometric quasar power, and about three orders of magnitude greater than the kinetic power of the star formation.
In the lower left panel of Fig.3we compare the kinetic en-ergy of the gas with that provided by the radio jet. The solid red and blue dashed lines in the right panel show energy conversion efficiencies between 0.1 and 100%. The jets provide sufficient kinetic energy to explain the gas kinematics in all sources with a wide range of efficiencies. Since this energy comes from an ex-tended radio jet, it is being deposited locally into the interstellar gas, which should make the energy transfer particularly efficient (e.g.,Mukherjee et al. 2016).
To estimate the momentum carried by the radio jet, we use the calibration ofCavagnolo et al.(2010) already discussed above, and use pjet = Ejet/v, with v = βc. Observations of compact steep spectrum radio galaxies in the nearby Universe, which are good candidates for being in an early phase of jet activity, where the jet interacts strongly with the dense circum-nuclear gas, suggest β = 0.01−0.1 (e.g.,Readhead et al. 1996;
Owsianik & Conway 1998;Harwood et al. 2013). Most suitable for our purposes is to provide firm lower limits to the momentum injection from the jets, and we therefore adopt β= 0.1. Keeping in mind that the observed velocities of entrained clouds are lower than the expansion velocity of the hot cocoon gas by at least factors of a few (Cooper et al. 2008; Gaibler et al. 2009), and that we observe velocities of up to ∼2500 km s−1for the warm ionized clouds in our SINFONI sample, jet expansion veloci-ties much smaller than 0.01c do not seem very likely, unless the medium is very dense or clumpy, so that the jet finds it difficult to
escape. Hydrodynamic models, however, show, that during such phases jets are particularly efficient in imparting their momen-tum into the gas. As the jets push through low-density channels in such galaxies, their ram pressure produces mechanical advan-tages of factors of 10–100, so that the velocities of the entrained gas may reach velocities of a few 102−3 km s−1, as observed (N16), although the jet expansion velocity itself may actually be much lower (Wagner & Bicknell 2011;Wagner et al. 2012). As a result, the galaxies would fall into a very similar range in Fig.3, although the physics behind the gas acceleration would be more complicated.
The momentum of the gas as a function of the momentum provided by the radio jet in our sources is shown in the bottom right panel of Fig.3. The black dashed region in Fig.3 shows the range in the diagram where a jet expansion velocity of less than 0.01c would be required, which we consider unlikely. All galaxies fall below this range, i.e., within a region of the diagram where the momentum of the gas can be plausibly powered by the radio source. We note that galaxies with greater jet expansion velocity transfer less of their momentum into the gas, so that it is not unphysical to find galaxies which fall formally in the range where vjet > c. In this case, additional effects, perhaps due to geometry or clumpiness of the gas, could make the momentum transfer less efficient than implied by our simplified assumptions.
8. Ambiguous cases
Our sample includes six targets, for which the simple energy and momentum considerations presented above cannot distin-guish between AGN bolometric and radio power as the main driver of the gas kinematics. Both radio source and quasar radi-ation seem powerful enough to explain their observed gas kine-matics (either kinetic energy, momentum, or both), even when adopting the relatively low energy and momentum transfer e ffi-ciencies suggested by FeLoBAL observations and the most de-tailed hydrodynamic models (Moe et al. 2009;Dunn et al. 2010;
Bautista et al. 2010; Krumholz & Thompson 2012; Bieri et al. 2017).
These six targets are among those for which we measured the lowest kinetic energy and momentum in our SINFONI data sets. Three of these targets, MRC 2224−273, MRC 0114−211, and TN J2007−1316, are not spatially well resolved, so that beam smearing might lower their velocity measurements and thus their kinetic energy and momentum estimates. This is in particular the case for TN J2007−1316, which has one of the lowest velocity gradients measured in our entire sample,∆v = 100 km s−1(N16). PKS 0529−549 and 3C 257, in contrast, have well-resolved emission-line regions, and radio jets that are still confined within the extended emission line gas. Both galaxies show kinematic disturbances associated with the extended radio emission, which suggests that most of the energy injection comes from the radio source.
The sixth source, USS 0211−122 has very low line widths in the extended gas, and pronounced blue wings in the [OIII]λλ4959, 5007 line profiles (N16). This is unusual com-pared to the remaining sample of HzRGs with SINFONI data fromN16, where line profiles are generally broad, reflecting the large line widths and strong velocity gradients over most of the bright emission-line gas, but do not show pronounced secondary components, as are commonly found in quasars. Collet et al.
(2016) propose that this could be an intrinsic difference between radio galaxies and quasars, perhaps indicating different radial sizes of the outflows. If this is correct, then USS 0211−122 could well be a source where the energy injection from the bolometric
Fig. 6. Ratio of the kinetic energy (left) and momentum (right) transferred into the gas through AGN radiation and radio jet as a function of those observed in the gas. The dashed line shows where both are equal. We label individual targets, for which a simple comparison of the energy and momentum input rates do not favor either radiation or jets as the main injection mechanism.
quasar radiation exceeds that from the radio jet. This could also explain why surveys of large samples of typically unresolved quasar spectra find that broad, blueshifted wings appear more as-sociated with radio-quiet than radio-loud AGN (Heckman et al. 1984; Greene & Ho 2005; Woo et al. 2016), whereas detailed observations of individual galaxies with radio-loud AGN find perturbed kinematic features preferentially along the radio jet axis (e.g.,Husemann et al. 2013).
In Fig. 6 we show the ratio between the energy and mo-mentum injection from radiation and jets as a function of gas kinetic energy. The figure shows that the expected energy and momentum injection related to the jet is typically higher by at least factors of a few than those from the AGN radiation. MRC 0114−211, PKS 0529−549 and 3C 257, are, in fact, among the galaxies, where the power of the radio jet is particularly strong compared to the bolometric power. It would not be ob-vious why the gas kinematics in these sources should be dom-inated by the radiation rather than the jet if the opposite were the case in most of the other sources, as suggested by Fig.3. In USS 0211−122, however, the source with particularly high rest-frame UV polarization (Vernet et al. 2001) already discussed in Sect.5, the bolometric power is greater than the radio power, and therefore the mechanism powering the gas kinematics remains more ambiguous.
9. Discussion and conclusions
We used observations of the kinematics of warm ionized gas, and the far-infrared and centimeter radio spectral energy distri-bution of 24 powerful radio galaxies at z ∼ 2 to compare the rates of kinetic energy released by star formation, quasar radiation, and radio jets with the energy input rates required to power the observed gas kinematics. All galaxies have far-infrared spectral energy distributions measured with Herschel/PACS and SPIRE photometry, which Drouart et al. (2014) decomposed into an AGN and star formation component (decompositions for indi-vidual targets are shown in their Fig. D.1). They have also been observed with SINFONI to infer the kinematics of the warm ionized gas (Nesvadba et al. 2016). We use standard techniques from the literature to estimate the kinetic energy and momen-tum released by star formation, radiation from the buried AGN, and radio jets, and to make a comparison with the kinetic energy and momentum found in the gas. We also take into account that the efficiency of the energy and momentum transfer from each source to the gas is unlikely to be unity, and compare this with
several assumptions given in the literature. Our understanding of AGN feedback is still evolving very rapidly, and our goal was to capture the main streams of the current discussion in our analysis while also providing observational constraints that are generic enough to be useful for comparison with future theoretical work. We find that the kinetic energy produced by starburst-driven winds falls short of what is required to drive the observed gas kinematics in agreement with previous results for individual sources (Nesvadba et al. 2006;Seymour et al. 2012). For radia-tive AGN feedback (“quasar feedback”) the potential of produc-ing the observed gas kinematics is more ambiguous and depends on the assumed efficiency with which the gas is being acceler-ated. For the most optimistic assumptions, AGN radiation could be behind the gas kinematics in about two-thirds of our sources. For models including more explicit descriptions of the radiative transfer, lower efficiencies are found. In this case, the quasar emission would generally not be sufficient to power the kine-matics of the warm ionized gas. In six galaxies with low gas kinetic energy and momentum, AGN radiation could be enough to power the kinematics even with these relatively low injection rates; however, the specific properties of these sources suggest nonetheless that the radio jet is probably more effective. One no-table exception is USS 0211−122, which has unusual [OIII] line profiles more reminiscent of quasars than radio galaxies, and which also has a low expected rate of jet-to-AGN energy and momentum.
Radiation pressure also seems insufficient to unbind the gas from galaxies with stellar masses as high as in our targets. The radio jets appear capable of providing sufficient energy and mo-mentum to produce the highly energized, extended emission-line regions we observe in these galaxies.
The analysis presented here is complementary to that of
Nesvadba et al.(2016), who analyzed the detailed properties of 49 HzRGs including the 24 we discuss here, which also have the Herschelfar-infrared photometry necessary for a detailed discus-sion of the energy produced by AGN and star formation. They found several signatures, e.g., a general co-alignment of radio jet axis and major axis of the extended emission-line regions, and abrupt changes in velocity or line widths associated with the jet direction or radio features, which also suggest that the radio jet is the main source of energy and momentum injection.
We emphasize that our results do not imply that AGN radi-ation and star formradi-ation have no effect at all on their surround-ing gas. With an analysis of the global gas properties like the
one done here, we cannot probe further than to identify the most powerful mechanism. Nevertheless, our results do not require us to assume more complex scenarios, e.g., a conspiracy of gas ac-celeration through radiation and jets, as would be the case if no single mechanism were able to provide sufficient momentum and energy by itself. Detailed, high-resolution studies of radio-loud quasars at low redshift currently paint a mixed picture; some au-thors have found that radiation dominates (e.g., ?), and others at-tribute a larger role to the radio jet (e.g.,Husemann et al. 2013). Our results for this particular moment in the evolution of our sources are also independent from timescale or duty cycle considerations because we observe the impact of each source in situ, and at the same moment when they are acting on the same gas reservoir. With jet lifetimes of a few 106−7 yr (e.g.,
Blundell & Rawlings 1999), and star formation timescales of at least a few 108 and perhaps even up to 109 yr (Rocca-Volmerange et al.2013), it is clear that we are witnessing these processes at a peculiar moment in time, most likely when the active formation phase of the host galaxy is nearly terminated (e.g.,Nesvadba et al. 2011a;Drouart et al. 2014). While star for-mation and AGN radiation have probably affected the host evo-lution prior to this phase, they have not removed the gas we see in these targets now. Our results therefore suggest that the ra-dio jet dominates the final “sweeping clean” of gas from these very massive galaxies. This is also consistent with the result pre-sented in Fig.5that AGN with radiative power of 1046−47erg s−1, in the range of the most luminous AGN at these redshifts, do not seem able to overcome the gravitational potential of galax-ies with M ≥ 1011 M through the momentum carried by their bolometric radiation alone. In earlier stages of assembly of our galaxies, and lower mass galaxies generally, the relative balance of star formation, AGN radiation, and radio jets, might therefore be very different.
Making this comparison for the present set of galaxies was relatively simple because the sources are well extended and the radio sources are bright enough that their kinetic power domi-nates globally over other mechanisms. However, as one moves down the radio luminosity function, this becomes more di ffi-cult, as can be seen from a very similar analysis performed byNesvadba et al.(2011b) andPolletta et al.(2011) for two of the brightest obscured quasars from the Spitzer SWIRE survey (Polletta 2008). The obscured quasars in these sources are about as powerful as the ones we discuss here, but their radio sources are about four orders of magnitude fainter than the brightest sources we discuss here (Sajina et al. 2007). Nonetheless, their gas kinematics seem to be dominated by the radio jets, contrary to AGN selected, for example, in the optical or X-ray. Much deeper and more detailed analyses with high-resolution radio data will be required to study galaxies where the energy output from star formation, quasar, and jets are more balanced. How-ever, this will be a long-term effort, as currently, no general, reliable, uncontested methods exist to distinguish between star formation and AGN in faint high-redshift radio sources. ALMA, the next generations of ELTs and JWST in the optical and near-infrared, and radio facilities like LOFAR and SKA will undoubt-edly play a large role in disentangling the relative contribution of each process for the regulation of the gas kinematics in the gen-eral population of high-redshift AGN host galaxies.
Acknowledgements. We thank the anonymous referee for insightful comments that helped improve the paper, and the staff at Paranal observatory and at ESA for their assistance with obtaining the data on which this work is based. NPHN also wishes to express her gratitude to M. D. Lehnert for very interesting and inspiring comments on the draft of this paper, and his continuous advice and guidance in the more than 10 yr of previous collaboration, that also form the
basis of the present analysis. She wishes to thank ESO for supporting this study through DGDF grant 14/10, and for the hospitality of the staff in Garching during the extended visit that ensued. PNB is grateful for support from the UK STFC via grant ST/M001229/1. The Herschel spacecraft was designed, built, tested, launched and operated under a contract to ESA managed by the Herschel/Planck Project team by an industrial consortium under the overall re-sponsibility of the prime contractor Thales Alenia Space (Cannes), and includ-ing Astrium (Friedrichshafen) responsible for the payload module and for sys-tem testing at spacecraft level, Thales Alenia Space (Turin) responsible for the service module, and Astrium (Toulouse) responsible for the telescope, with in excess of a hundred subcontractors.
References
Archibald, E. N., Dunlop, J. S., Hughes, D. H., et al. 2001,MNRAS, 323, 417
Bautista, M. A., Dunn, J. P., Arav, N., et al. 2010,ApJ, 713, 25
Bender, R., Burstein, D., & Faber, S. M. 1992,ApJ, 399, 462
Bieri, R., Dubois, Y., Rosdahl, J., et al. 2017,MNRAS, 464, 1854
Blundell, K. M., & Rawlings, S. 1999,Nature, 399, 330
Buitrago, F., Conselice, C. J., Epinat, B., et al. 2014,MNRAS, 439, 1494
Carilli, C. L., Röttgering, H. J. A., van Ojik, R., Miley, G. K., & van Breugel, W. J. M. 1997,ApJS, 109, 1
Carilli, C. L., Harris, D. E., Pentericci, L., et al. 2002,ApJ, 567, 781
Cavagnolo, K. W., McNamara, B. R., Nulsen, P. E. J., et al. 2010,ApJ, 720, 1066
Chabrier, G. 2003,PASP, 115, 763
Cicone, C., Maiolino, R., Sturm, E., et al. 2014,A&A, 562, A21
Collet, C., Nesvadba, N. P. H., De Breuck, C., et al. 2015,A&A, 579, A89
Collet, C., Nesvadba, N. P. H., De Breuck, C., et al. 2016,A&A, 586, A152
Cooper, J. L., Bicknell, G. V., Sutherland, R. S., & Bland-Hawthorn, J. 2008,
ApJ, 674, 157
Dalla Vecchia, C., & Schaye, J. 2008,MNRAS, 387, 1431
De Breuck, C., van Breugel, W., Röttgering, H., et al. 2001,AJ, 121, 1241
De Breuck, C., Seymour, N., Stern, D., et al. 2010,ApJ, 725, 36
Di Matteo, T., Springel, V., & Hernquist, L. 2005,Nature, 433, 604
Drouart, G., De Breuck, C., Vernet, J., et al. 2014,A&A, 566, A53
Drouart, G., Rocca-Volmerange, B., De Breuck, C., et al. 2016,A&A, 593, A109
Dunn, J. P., Bautista, M., Arav, N., et al. 2010,ApJ, 709, 611
Elvis, M., Wilkes, B. J., McDowell, J. C., et al. 1994,ApJS, 95, 1
Emonts, B. H. C., Norris, R. P., Feain, I., et al. 2014,MNRAS, 438, 2898
Faucher-Giguère, C.-A., & Quataert, E. 2012,MNRAS, 425, 605
Gaibler, V., Krause, M., & Camenzind, M. 2009,MNRAS, 400, 1785
Greene, J. E., & Ho, L. C. 2005,ApJ, 630, 122
Gullberg, B., De Breuck, C., Lehnert, M. D., et al. 2016,A&A, 586, A124
Harwood, J. J., Hardcastle, M. J., Croston, J. H., & Goodger, J. L. 2013,
MNRAS, 435, 3353
Harwood, J. J., Croston, J. H., Intema, H. T., et al. 2016,MNRAS, 458, 4443
Hatch, N. A., Overzier, R. A., Röttgering, H. J. A., Kurk, J. D., & Miley, G. K. 2008,MNRAS, 383, 931
Hatch, N. A., Overzier, R. A., Kurk, J. D., et al. 2009,MNRAS, 395, 114
Hatch, N. A., Röttgering, H. J. A., Miley, G. K., et al. 2013,MNRAS, 436, 2244
Heckman, T. M., Miley, G. K., & Green, R. F. 1984,ApJ, 281, 525
Heckman, T. M., Armus, L., & Miley, G. K. 1990,ApJS, 74, 833
Heckman, T. M., Alexandroff, R. M., Borthakur, S., Overzier, R., & Leitherer, C. 2015,ApJ, 809, 147
Humphrey, A., Iwamuro, F., Villar-Martín, M., Binette, L., & Sung, E. C. 2009,
MNRAS, 399, L34
Husemann, B., Wisotzki, L., Sánchez, S. F., & Jahnke, K. 2013,A&A, 549, A43
Ivison, R. J., Morrison, G. E., Biggs, A. D., et al. 2008,MNRAS, 390, 1117
Kaiser, C. R., & Alexander, P. 1997,MNRAS, 286, 215
Kennicutt, Jr., R. C. 1998,ARA&A, 36, 189
Krumholz, M. R., & Thompson, T. A. 2012,ApJ, 760, 155
Krumholz, M. R., & Thompson, T. A. 2013,MNRAS, 434, 2329
Lehnert, M. D., & Heckman, T. M. 1996a,ApJ, 462, 651
Lehnert, M. D., & Heckman, T. M. 1996b,ApJ, 472, 546
Liu, G., Zakamska, N. L., Greene, J. E., Nesvadba, N. P. H., & Liu, X. 2013a,
MNRAS, 430, 2327
Liu, G., Zakamska, N. L., Greene, J. E., Nesvadba, N. P. H., & Liu, X. 2013b,
MNRAS, 436, 2576
McCarthy, P. J. 1999, in The Most Distant Radio Galaxies, eds. H. J. A. Röttgering, P. N. Best, & M. D. Lehnert, 5
Moe, M., Arav, N., Bautista, M. A., & Korista, K. T. 2009,ApJ, 706, 525
Mukherjee, D., Bicknell, G. V., Sutherland, R., & Wagner, A. 2016,MNRAS, 461, 967
Mullaney, J. R., Alexander, D. M., Goulding, A. D., & Hickox, R. C. 2011,
MNRAS, 414, 1082
Nesvadba, N., De Breuck, C., et al. 2016, A&A, accepted
Nesvadba, N. P. H., Lehnert, M. D., Eisenhauer, F., et al. 2006,ApJ, 650, 693
Nesvadba, N. P. H., Lehnert, M. D., De Breuck, C., Gilbert, A., & van Breugel, W. 2007,A&A, 475, 145
Nesvadba, N. P. H., Lehnert, M. D., Davies, R. I., Verma, A., & Eisenhauer, F. 2008a,A&A, 479, 67
Nesvadba, N. P. H., Lehnert, M. D., De Breuck, C., Gilbert, A. M., & van Breugel, W. 2008b,A&A, 491, 407
Nesvadba, N. P. H., Neri, R., De Breuck, C., et al. 2009,MNRAS, 395, L16
Nesvadba, N. P. H., De Breuck, C., Lehnert, M. D., et al. 2011a,A&A, 525, A43
Nesvadba, N. P. H., Polletta, M., Lehnert, M. D., et al. 2011b,MNRAS, 415, 2359
Novak, G. S., Ostriker, J. P., & Ciotti, L. 2012,MNRAS, 427, 2734
Overzier, R. A., Harris, D. E., Carilli, C. L., et al. 2005,A&A, 433, 87
Owsianik, I., & Conway, J. E. 1998,A&A, 337, 69
Pentericci, L., Van Reeven, W., Carilli, C. L., Röttgering, H. J. A., & Miley, G. K. 2000,A&AS, 145, 121
Polletta, M. 2008,A&A, 480, L41
Polletta, M., Nesvadba, N. P. H., Neri, R., et al. 2011,A&A, 533, A20
Readhead, A. C. S., Taylor, G. B., Pearson, T. J., & Wilkinson, P. N. 1996,ApJ, 460, 634
Reuland, M., Röttgering, H., van Breugel, W., & De Breuck, C. 2004,MNRAS, 353, 377
Richards, G. T., Lacy, M., Storrie-Lombardi, L. J., et al. 2006,ApJS, 166, 470
Rocca-Volmerange, B., Drouart, G., De Breuck, C., et al. 2013,MNRAS, 429, 2780
Sajina, A., Yan, L., Lacy, M., & Huynh, M. 2007,ApJ, 667, L17
Seymour, N., Stern, D., De Breuck, C., et al. 2007,ApJS, 171, 353
Seymour, N., Altieri, B., De Breuck, C., et al. 2012,ApJ, 755, 146
Sharma, P., Roy, A., Nath, B. B., & Shchekinov, Y. 2014,MNRAS, 443, 3463
Silk, J., & Rees, M. J. 1998,A&A, 331, L1
Strickland, D. K., & Heckman, T. M. 2009,ApJ, 697, 2030
Sun, A.-L., Greene, J. E., Zakamska, N. L., & Nesvadba, N. P. H. 2014,ApJ, 790, 160
Tadhunter, C., Dicken, D., Morganti, R., et al. 2014,MNRAS, 445, L51
Taniguchi, Y., Ohyama, Y., Murayama, T., et al. 2001,ApJ, 559, L9
Turner, R. J., & Shabala, S. S. 2015,ApJ, 806, 59
Veilleux, S., Cecil, G., & Bland-Hawthorn, J. 2005,ARA&A, 43, 769
Veilleux, S., Meléndez, M., Sturm, E., et al. 2013,ApJ, 776, 27
Vernet, J., Fosbury, R. A. E., Villar-Martín, M., et al. 2001,A&A, 366, 7
Villar-Martín, M., Vernet, J., di Serego Alighieri, S., et al. 2003,MNRAS, 346, 273
Wagner, A. Y., & Bicknell, G. V. 2011,ApJ, 738, 117
Wagner, A. Y., Bicknell, G. V., & Umemura, M. 2012,ApJ, 757, 136
Willott, C. J., Rawlings, S., & Jarvis, M. J. 2000,MNRAS, 313, 237
Woo, J.-H., Bae, H.-J., Son, D., & Karouzos, M. 2016,ApJ, 817, 108
Zirm, A. W., Overzier, R. A., Miley, G. K., et al. 2005,ApJ, 630, 68
![Figure 1 summarizes the kinematic properties of the warm ionized gas in our galaxies, which has already been presented in greater detail by N16, in the form of three histograms: we show the average and maximal FWHM measured from [OIII]λ5007 in our SINFONI](https://thumb-eu.123doks.com/thumbv2/123doknet/13593416.423209/4.892.71.430.117.374/summarizes-kinematic-properties-galaxies-presented-histograms-measured-sinfoni.webp)