Publisher’s version / Version de l'éditeur: PERD/CHC Report 5-109, 2000-03
READ THESE TERMS AND CONDITIONS CAREFULLY BEFORE USING THIS WEBSITE.
https://nrc-publications.canada.ca/eng/copyright
Vous avez des questions? Nous pouvons vous aider. Pour communiquer directement avec un auteur, consultez la première page de la revue dans laquelle son article a été publié afin de trouver ses coordonnées. Si vous n’arrivez pas à les repérer, communiquez avec nous à PublicationsArchive-ArchivesPublications@nrc-cnrc.gc.ca.
Questions? Contact the NRC Publications Archive team at
PublicationsArchive-ArchivesPublications@nrc-cnrc.gc.ca. If you wish to email the authors directly, please see the first page of the publication for their contact information.
NRC Publications Archive
Archives des publications du CNRC
For the publisher’s version, please access the DOI link below./ Pour consulter la version de l’éditeur, utilisez le lien DOI ci-dessous.
https://doi.org/10.4224/12340977
Access and use of this website and the material on it are subject to the Terms and Conditions set forth at Experimental Investigation of Ice Rubble Behaviour and Strength in Punch Tests
Azarnejad, A.; Brown, T.
https://publications-cnrc.canada.ca/fra/droits
L’accès à ce site Web et l’utilisation de son contenu sont assujettis aux conditions présentées dans le site LISEZ CES CONDITIONS ATTENTIVEMENT AVANT D’UTILISER CE SITE WEB.
NRC Publications Record / Notice d'Archives des publications de CNRC:
https://nrc-publications.canada.ca/eng/view/object/?id=762b6b44-e21c-45ec-92c9-dbd49e9f6db7 https://publications-cnrc.canada.ca/fra/voir/objet/?id=762b6b44-e21c-45ec-92c9-dbd49e9f6db7
Experimental Investigation of Ice Rubble
Behaviour and Strength
In Punch Tests
By
A. Azarnejad and T. G. Brown Department of Civil Engineering
The University of Calgary
Submitted To
National Research Council of Canada Ottawa, Canada
PERD/CHC Report 5-109
Abstract
The report summarises the results from three series of plunge tests on ice rubble
conducted at the University of Calgary, and interpretation of these results. The tests were conducted as two-dimensional plane strain experiments in a transparent tank that
permitted video recording of the rubble behaviour during the tests. The majority of the tests were conducted using standard fresh-water ice cubes manufactured using
commercial ice making machines, while the most recent tests were conducted using larger ice pieces. The observations of the behaviour of the rubble during the tests suggested that there was a significant difference in behaviour observed at low and high loading speeds. At low speeds, well-defined failure planes were observed, and, for unconsolidated rubble, the behaviour could be described as purely frictional. As the ice was permitted to
consolidate, the addition of local regelation altered the value of the angle of friction, but the observed behaviour was little changed. Over the range of low speed tests ( to 40 mm/sec) there was no appreciable effect of speed on friction angle. However, there is some effect of rubble thickness. At high speeds of loading, no clearly defined failure planes were observed. The failure could be described as gradual, with the disturbance of the ice rubble taking place within the mass of the rubble. The analogy used for the interpretation of the strength of the rubble (plate pull-out in granular materials) was not applicable to these tests. The analysis of these results, and the extension of the test programme for the larger ice pieces, is on-going.
1. INTRODUCTION 1
2. TEST PROGRAM DESIGN 3
2.1. Rational for Tests 3
2.2. Description of Test Apparatus 3
3. DESCRIPTION OF TESTS 6
3.1. Test Program 6
3.2. Data Recording 7
3.3 Recent Test Results 7
4. ANALYSIS 8
4.1. Background 8
4.2 Plunge Tests 10
4.3 Review of Results 12
4.3 Analysis of Behaviour 14
4.4 Large Block Test Results 18
5. CONCLUSIONS AND RECOMMENDATIONS 32
5.1 Conclusions 32
5.2 Recommendations 33
6. ACKNOWLEDGEMENTS 34
List of Tables
Table 4.1 Large Block Test Matrix 19
Table 4.2 Large Block Test Results 19
List of Figures
Figure 2.1 Test Apparatus 5
Figure 4.1 Load and deflection versus time for open rubble tests 20
Figure 4.2 Load and deflection versus time for ice block tests 20
Figure 4.3 Inertial load (peak - residual) versus speed for ice block tests 21
Figure 4.4 Load versus stroke for an ice block and ice rubble test with the same thickness 21
Figure 4.5 Failure planes according to Meyerhof 22
Figure 4.6 Load versus stroke for 0 aging tests with different thickness 23
Figure 4.7 Load versus stroke for 1 hour aging tests with different thickness 24
Figure 4.8 Load versus stroke – zero aging, large blocks 25
Figure 4.9 Load and deflection versus time for ice rubble tests 26
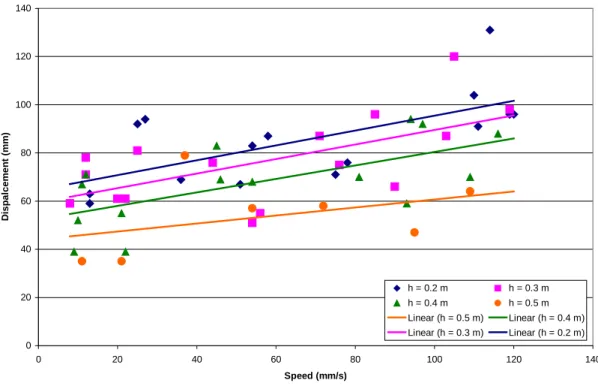
Figure 4.10 Displacement at peak load – Age 0 hours 27
Figure 4.11 Displacement at peak load – Age 1 hour 27
Figure 4.12 Shear strength versus test speed 28
Figure 4.13 Shear strength versus thickness 29
Figure 4.14 Friction angle versus test speed 30
Figure 4.15 Friction angle versus thickness (test speed 9 to 15 mm/sec) 31
1.
INTRODUCTION
This report describes the results of the third phase of an on-going programme of research into the behaviour and properties of ice rubble during a vertical plunge test. Previous in-situ testing of model ice rubble has usually involved either vertical plunge tests through the rubble, or horizontal shear box testing; in both cases there is considerable uncertainty regarding the behaviour of the ice rubble, and specifically, the nature of the failure planes. The previous tests (Brown and Azarnejad, 1997, 1999) provided considerable insight into the behaviour of rubble ice. The present report describes more in-depth analysis of the previous test results, and describes some preliminary tests using differently sized ice pieces.
As a reference test for the strength of ice rubble in model ridges, the plunge test has some attractions, as it can be conducted away from the test location of the ridge, disturbs only a small portion of the rubble, and leaves the ice largely in place. The disadvantage of the plunge test is that the nature of the failure planes is unknown, although underwater video has been used on some of the previous tests (McKenna et al, 1995). As the nature of the failure plane is an important determinant of the inherent behaviour of ice rubble, it was decided that a series of tests executed under plane strain conditions might provide some understanding of the failure planes. The tests were conducted with artificial fresh water ice.
This report briefly describes the development of the test apparatus, the instrumentation, and the conduct of the previous tests. It also provides a more detailed analysis and summary of the test results, including analysis of some of the principal effects. The results of the new experiments are presented as an appendix to the report.
Following this introduction, Chapter 2 describes the test program, Chapter 3 a description of the tests, while Chapter 4 presents the analyses. Finally Chapter 5 presents the conclusions and some recommendations.
2.
TEST PROGRAM DESIGN
2.1. Rational for Tests
The rational for the tests was to design a test which would closely approximate the in-situ plunge tests as conducted on model rubble formations, in such a manner that the characteristics of the failure planes could be identified. Because it is more difficult to identify failure planes when they are circular, it was decided to conduct the tests using a rectangular platen which spanned the full width of the test apparatus, thus reducing the test from three-dimensions to two dimensions. The test tank was constructed using plexiglass which permitted the observation of the failure planes from the sides of the test apparatus. Otherwise, the tests were run in much the same way as the IMD tests, with the load and displacement of the platen being measured.
2.2. Description of Test Apparatus
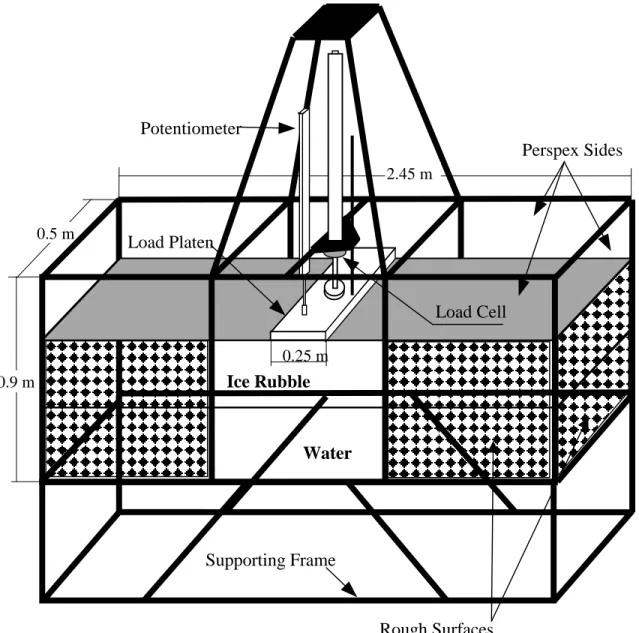
The ice rubble tests were conducted in the cold room located in the Geotechnical Lab in The University of Calgary. The test apparatus is shown in Figure 2.1. The tests were conducted in a 0.5 m × 0.9 m × 2.45 m perspex tank supported by a steel frame which also supported the loading device. The tank dimensions were designed such that there was enough buoyancy force and friction on the non-loaded portion of the rubble to resist the applied loads. Friction at the ends of the tank (Figure 2.1) was artificially increased by gluing small rectangular pieces of perspex to the walls of the tank. The middle part of the tank was kept clear to avoid interfering with the failure mode of the rubble, and to make it possible to see the failure mode.
Load was applied through a rectangular platen attached to one end of a hydraulic ram, and monitored using a 2 kN load cell. In order to increase the accuracy of the measured loads,
the capacity of the load cell was reduced and it was placed as close as possible to the platen. The hydraulic ram had a maximum stroke and rate of 0.75 m and 0.12 m/s
respectively. The platen was 0.25 m by 0.5 m and machined from 0.019 m (3/4″) thick
aluminum plate. The longer side of the platen covered almost the whole width of the tank, leaving only a small gap at the two ends to avoid friction. Displacement of the platen was measured using a linear potentiometer with a maximum stroke of 0.355 m.
The ice rubble, with ice pieces that were in the order of 5 to 20 mm, was obtained from ice machines in the Faculty of Engineering, and stored in a freezer prior to tests. The tank was filled with fresh water, and then the required amount of ice was placed to the desired depth. Thickness of the ice rubble was measured with a ruler and kept uniform in the middle part of the tank. A thermocouple measured the room temperature. Most of the tests were documented using a video camera.
During the last year, a new ice making machine was purchased for this test programme specifically to consider the effect of ice piece size on the results, and the relation between ice piece size and the rubble depth. The new ice piece dimensions are 35 x 35 x 15 mm.
Figure 2.1 Test Apparatus 0.5 m 2.45 m 0.9 m Water Perspex Sides Load Cell Potentiometer Load Platen Supporting Frame 0.25 m Ice Rubble Rough Surfaces
3.
DESCRIPTION OF TESTS
3.1. Test Program
There were three main variables in the test program:
1) Rubble thickness (0.2, 0.3, 0.4 and 0.5m),
2) ageing of rubble (0, 1, 2, and 3 hours),
3) velocity of indentor (9 to 120 mm/s).
Prior to each test setup, the consolidated layer was broken and the ice rubble was stirred to break the bonds between the ice pieces and provide a uniform thickness in the middle part of the tank. The room was subsequently kept at a constant temperature for the required number of hours of ageing. It was observed in the previous test program that for consolidation periods greater than one hour, the consolidated layer became relatively thick and caused flexural failure of this layer. Therefore for the longer curing periods (two hours or more), the consolidated layer was cut with a saw along the long (0.5 m) sides of the platen, across the width of the tank, before applying the load. The cuts were made as close to the platen as possible, while still ensuring that there was no interaction between the isolated portion of the consolidated layer and the rest on the consolidated layer. Generally the saw cut was within 5 mm of the edge of the platen.
Because of ongoing problems with the cold room in which the tests are conducted, the only tests conducted in the current programme were the zero-hour ageing tests. To carry out these tests, the water temperature is first lowered by melting ice in the tank, and then the ice for the rubble is placed to the desired depth. The zero-hour test is then conducted immediately. The maximum velocity of the hydraulic ram was 120 mm/s. Tests were conducted with speeds of approximately 15, 25, 40, 55, 75, 90, 100, 115 mm/s. In the present series, the speeds used were the highest and lowest of these, and an intermediate speed of 75 mm/sec.
3.2. Data Recording
During the tests, the data corresponding to time, platen force, and platen displacement were acquired at 30 Hz using DATASCAN 7010 data acquisition system. The system was controlled by a computer using LABTECH NOTEBOOK. Subsequent data processing was performed by MICROSOFT OFFICE.
In order to obtain the maximum deflection at the time of peak load, a time for zero deflection was selected by examining the figures and the data. The recorded
displacement at this time was then subtracted from the recorded displacement at the time of maximum load.
3.3 Recent Test Results
The acquisition of an ice machine, modified to create ice blocks larger than those used for the two previous test programmes, allows examination of the effect of piece size on the observed behaviour and measured strength. Because of failure of the cooling system in the cold room, only a limited number of tests have been completed. The results for rubble thicknesses of 20 and 30 cm and speeds of ~10 mm/sec, and ~110 mm/sec are provided in Appendix A to this reports. All tests were conducted at zero hours ageing. The details of the results, and comparisons between results with the two different ice sizes, are discussed in the next Chapter.
4.
ANALYSIS
4.1. Background
Determining the strength properties of ice rubble is an important factor in estimating the loads due to interactions between offshore structures and unconsolidated ice ridges. Most of the currently available theories assume that the rubble behaves as a Mohr-Coulomb material in which the shear strength (τ) is assumed to consist of cohesion (c) and friction (φ) components, where σ’ is the normal pressure on the failure plane.
φ σ
τ=c+ ’tan (4.1)
This occurred initially because of the similarities in form between ice rubble and geotechnical materials. Experiments to measure the properties of ice rubble have been undertaken since the 1970’s. The results of laboratory investigations are mainly reported in terms of φ and c and indicate a very wide range in strength properties. Although the Mohr-Coulomb theory has some attractions, the physics of resistance is not the same for ice and soils, and the differences in behaviour should be considered when interpreting the test results.
In soils the attraction between ions is the origin of the cohesive behaviour and it is not affected much by other factors, whereas in ice, freezing bonds the ice particles and the bond strength can depend on many parameters such as normal pressure, contact area, contact period, and salinity. Ettema and Schaefer (1986) conducted experiments on freeze bonding between the ice blocks and concluded that all of the above mentioned parameters affect the bond strength. The effect of loading rate on freeze bond strength is not well understood. In the experiments of Ettema and Schaefer the results were not much different for two different loading rates of 0.44 and 0.84 mm/s. However the adfreeze tests show stress rate dependence (Cammaert et al, 1986).
Cohesive resistance in soils is always present and exists simultaneously with frictional resistance. In ice the freezing bonds have to be broken before the friction is mobilized. The peak failure load may be governed either by the initial freeze bond failure along the whole failure planes or the resistance during the motion. The resistance during the motion may have components due to both friction and freeze bond between the ice pieces. Under higher confining stresses, crushing and flexural failure of ice pieces may also contribute to the initial or post yield shear strength. In 1991, Ettema and Urroz reviewed the published data on ice rubble friction angle. According to this review the reported
values for friction angle of ice rubble often exceed 45o and are larger than those reported
for other geotechnical materials like sand and gravel. The contact friction angle of
unbonded ice blocks is less than 5o (Hobbs, 1974) and depends on contact geometry and
thermodynamic conditions. Ettema and Urroz argued that the reported values for ice rubble friction angle might include the influence of freeze bonding and ice piece deformation (crushing and/or flexure). They also suggested that term usually described as ice rubble cohesiveness should be replaced with term (or terms), that more accurately account for freeze bonding and ice piece deformation.
In a report submitted to National Energy Board (1995), Croasdale et al discuss the initial and post yield strength of ice rubble. They explained that:
“The initial yield strength of rubble is controlled by the initial static frozen bonds which impart cohesion to the rubble. There is compelling evidence that first year rubble may exhibit extreme variations in response to natural variations in rubble formation and aging conditions. Bonding may be extremely variable, ranging from slush to that of porous ice. The most important controls affecting bonding are: rubble temperature at the time of formation, water salinity, sail height, and keel depth.”… “The post yield shear strength of broken, disturbed ice rubble is dominated by contact friction, interlocking and strain rate effective stress dependent cohesive bond that is derived from a dynamic freeze bonding mechanism.”
Croasdale et al. suggested that the total friction angle be determined from:
φ = φc + φs (4.2)
where φc denotes the residual friction ( Terminology of Ettema and Urroz , 1989) and φs is
the additional component due to sintering.
Since freezing bonds and interlocking are significant components of initial and post yield shear strength of ice rubble, it is important to study the physical and thermal process’ both in rubble fields and laboratory experiments. Depending on aging and thermal conditions the freezing bonds develop, and the shape of the blocks change. They might lose the sharp corners or regelate and form larger pieces. Hydrodynamics and loading rates can also affect the strength properties, failure mode, and load magnitudes. The effect of all of these factors is not entirely known and the wide range in published data can be due to differences in thermal conditions, aging time, loading rates, grain geometry, packing, and the presence of water (dry or submerged test) and brine.
4.2 Plunge Tests
The inconsistency in the laboratory test results has led to the examination of methods for in-situ testing of rubble properties, both in the field, and in ice tanks, on model rubble formations. The plunge test is one of the methods that are used for in-situ measurement of ice shear strength. The field plunge tests were first conducted by Lepparanta and Hakala (1992) in the Baltic Sea. They measured the strength of several first-year ridges and reported average strengths from 1.5 kPa to over 4 kPa. Since then the test method has been studied and modified (Croasdale, 1996). More recently in a program funded by Exxon and National Energy Board (Canada) plunge tests were conducted both in field and laboratory (Bruneau et al., 1998). The field tests were performed at Confederation Bridge site in Canada and the Sea of Okhotsk in Russia. The laboratory tests were conducted in the ice basin at the Institute for Marine Dynamics.
The plunge test, as used by IMD, is based on the application of a vertical load through a circular platen on the top surface of the rubble. The platen is pushed down through the rubble at a constant speed while the load and displacement of the platen are measured. Because there is usually a consolidated layer at the surface, this layer is cut round the circumference of the platen before the test, but otherwise, the rubble is not modified. The tests are found to be quite repeatable, and thus provide a useful indication of the strength of rubble. The field tests also have the advantage that they can be conducted away from the ridge location or structure, disturb only a small portion of the rubble, and leave the ice largely in place. However, because the tests are conducted within a larger rubble formation, not much is learnt concerning the failure process. Understanding the failure behaviour is necessary for interpretation of test results and underwater video, as used in some of the tests, can provide only limited information regarding the behaviour.
The first series of University of Calgary tests (phase I) were conducted in early 1997 and a summary of results was presented in IAHR Ice Symposium, 1998 (Azarnejad and Brown, 1998). Although those tests provided considerable insight into the behaviour of rubble ice, it was clear that a more rigorous test program was required. For the second series of tests, conducted in 1998, the test apparatus was improved to provide better control over speed and fewer fluctuations in the recorded loads. The main variables in both test series were: thickness (0.2 to 0.5 m), aging (0 to 3 hours), and speed (9 to 120 mm/s). In Phase II test program, the tests were conducted at a range of speeds whereas in the first series the apparatus allowed only for the maximum and minimum values of speed. In Phase II also a large number of tests were conducted at zero aging, and a number of ice block tests were performed to identify the inertial component of the recorded loads. Later tests suggested that the longer duration test results (2 to 3 hours) were affected by adfreeze between the ice rubble and the sides of the tank. For this reason, the longer duration tests of phase I and II were not used for the analysis. These tests were summarized in Azarnejad and Brown, (1999a).
More than 100 tests at different speeds ranging from 9 to 120 mm/s were conducted on ice rubble during the test program. Twenty-six tests were conducted with a rubble depth of 20 cm., 35 tests with a rubble depth of 30 cm., 33 tests with a rubble depth of 40 cm and 11 tests at 50 cm. The consolidation periods ranged from 0 hour to 3 hours. Most of the 0 hour tests were conducted immediately after a previous test at the same speed but with longer ageing, before any consolidation had occurred. However, the rubble was stirred to break the bonds between the ice pieces and provide a uniform thickness in the middle part of the tank. In the second test program a large number of tests were performed at zero ageing. It was believed that in this case the shear resistance was less affected by the freeze bonds and behaviour was frictional. In the most recent test programme, 8 tests, all at zero hours ageing were conducted. The test matrix and peak load results are summarised in Table 4.1. Each test was duplicated once, and the repeat tests show remarkable consistency.
4.3 Review of Results
It was observed in phase I of the test program, that both failure mode and measured loads were affected by test speed. The loading rate dependency of measured loads can be attributed to:
1- Inertia component due to acceleration of ice rubble,
2- Effect of high pore pressures that do not have time to dissipate at high loading rates,
3- Loading rate dependence of freeze bond shear strength, and
4- Change of failure mode.
made in the freezer from the same rubble (with the same porosity) and had dimensions of 22×28×45 cm. It covered almost the whole width of the tank (49 cm) without any frictional resistance.
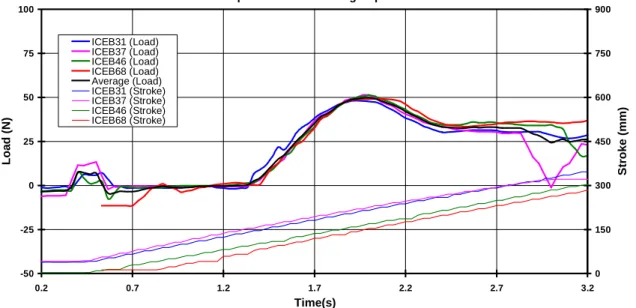
Figures 4.1 and 4.2 show a superposition of load plots for open water and ice block tests. The loads are 5 point moving averages and correspond to different tests with the same speed. The superposition is performed on the base of the same initial load and approximately same time of load increase. It can be seen that there is a good match between different tests.
Figures 4.1 and 4.2 show that the load plots consist of an ascending portion, a peak load, a descending portion and a residual load. The same pattern was also observed in the ice rubble tests. With the improved test apparatus the load fluctuations were smaller than those seen during the phase I program. However, since still some fluctuations in the range of ±2 N existed, a five point moving average was used. The values for the residual load were estimated from an average load for the period when the load remains almost at a constant level. It is apparent from these figures that there are fairly significant hydrodynamic and buoyant forces associated with the movement of the platen and the ice under the platen. For the high speed tests (100 to 120 mm/sec), these forces are 50N and 75N respectively. As the residual forces are a measure of the buoyancy effect, the difference between the peak and the residual is a measure of the hydrodynamic component.
For each ice block test, the value of the peak load minus residual was obtained and plotted against the test speed (Fig. 4.3). Best-fit curves were also plotted using both linear and quadratic relationships. It can be seen that they are very close and the linear curve shows good correlation. Although the intercept is not zero, the value is small in comparison to inertial forces for the actual tests.
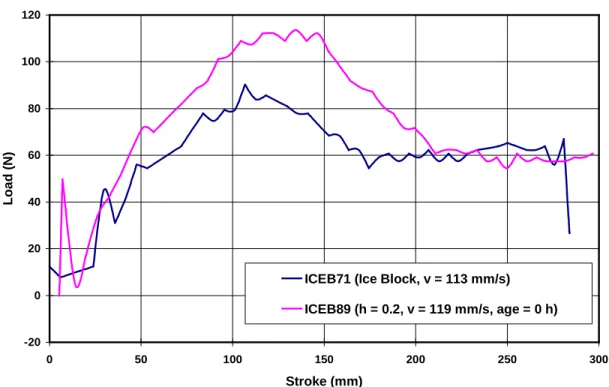
Figure 4.4 shows a comparison between the load-stroke curves obtained from an ice block test and an ice rubble test with zero aging and a rubble thickness of 0.2 m. It can be seen
that the residual loads are the same for both tests. For larger thicknesses the equation will underestimate the load especially for low speed test where the whole block moves. However, in the low speed tests the inertial component is negligible. The linear equation obtained from the ice block tests was used to determine the inertia force for subsequent ice rubble tests and was subtracted from the peak minus residual force. The displacements corresponding to peak loads for both the ice block and ice rubble tests were in the same range, justifying the direct subtraction.
4.3 Analysis of Behaviour
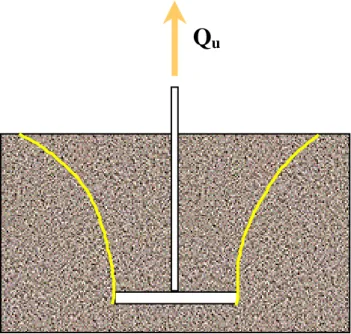
For the interpretation of the measured forces in terms of the rubble properties it is necessary to have an understanding of the failure process. Usually the rubble properties are obtained from plunge test using Meyerhof’s theory (Meyerhof and Adams, 1968) based on the strength of horizontal plate anchors in soils (see for example McKenna, 1996). Meyerhof’s theory is based on the assumption that the failure occurs along a plane that deviates from the vertical according to a curve that intersects the free surface at an angle related to the friction angle (Fig. 4.5). The visual observations from the video record indicate that this assumption is appropriate for the slow speed tests. A pair of flashlights was used at the other side of tank that clearly highlighted the ice particles and failure process.
In the slow tests a rectangular or even in some cases a trapezoidal plug of undisturbed ice covering the whole rubble depth moved down with the platen. The failure occurred primarily at the edges of the plug and the surrounding ice in the tank remained almost undisturbed. In the region of the failure planes the ice particles moved and rolled in a width of approximately two to three ice grains.
The failure was more complicated in the fast tests. Compared to the slow tests a larger area of ice both under the platen and in the surrounding ice was disturbed. There was a wedge of rubble ice moving with the platen that in most cases was triangular but did not cover the whole depth. As the platen moved down one could see the development of a bulge at the bottom surface of the ice without a distinct plug being formed. At the end of
bottom of the rubble. The behaviour of the ice at the bottom of the rubble did not necessarily match the failure mechanisms within the rubble. The failure in this case can be best described as a progressive failure. Therefore it may not be correct to use Meyerhof’s theory for the fast tests. At the other speeds the failure was somewhere between the two extreme cases.
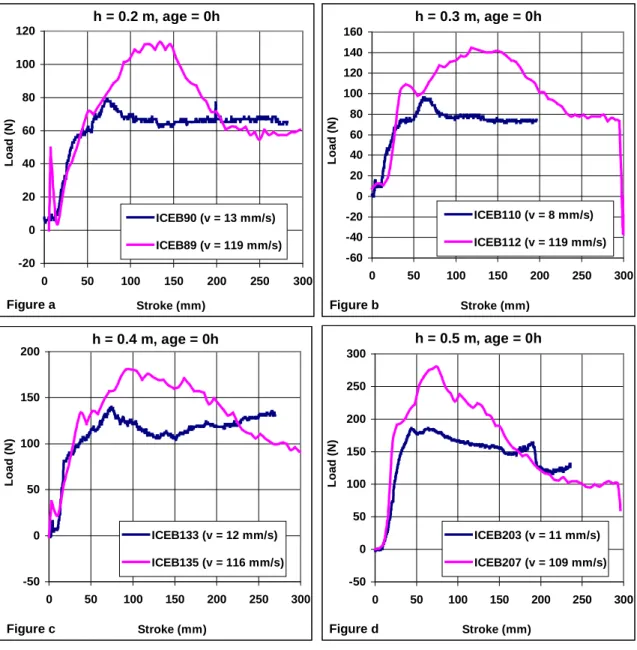
Figures 4.6 and 4.7 show comparisons between load versus stroke curves obtained from fast and slow tests for four different rubble thickness, and for 0 and 1 hour aging respectively. All tests are from phase 2, utilizing the smaller ice blocks. It can be seen that both the magnitude of the peak load and the shape of the curves differ. Since the curves show the measured values, the fast tests include an inertia force component that is considered in the analysis of the results. But even after removing the inertia component, the peak loads were generally higher in the fast tests. Figure 4.8 shows the same comparisons for fast and slow speed tests for the larger ice blocks, used in Phase 3.
The difference in the shape of the curves agrees with the observations of failure modes. For the slow tests where a rectangular or trapezoidal plug moves down with the platen, the peak load occurs at a smaller displacement. After the plug is separated from the rest of the rubble the resistance is minimal. Therefore the descending part of the curve is smaller, and the residual load is maintained for the rest of the experiment. In the fast tests, however, the peak load occurs at a larger displacement. Due to progressive failure there is more resistance as the platen moves down. Thus the descending part of the curve covers a larger displacement and the residual loads are smaller compared to slow tests.
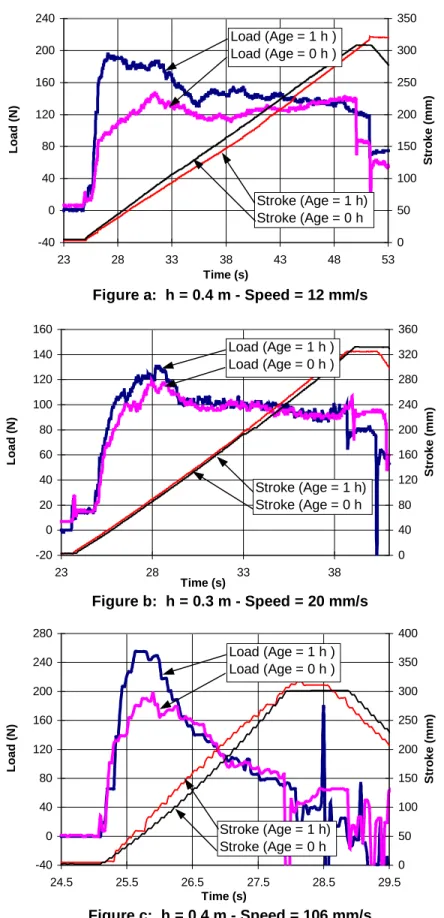
Now consider the slow tests where a rectangular or trapezoidal plug moves down with the platen. The applied force has to first overcome the freeze bonds between the plug and the surrounding rubble and then friction during the motion. The frictional resistance however, may also have a component due to freeze bonding of the rolling and moving ice particles. Figures 4.9a-c shows samples of plots for load and displacements versus time for two slow and one fast test. Each figure shows two curves corresponding to a one hour
aging test and the zero aging test conducted immediately after that. Since most of the freeze bonds are broken in the first test, the behaviour in the zero aging test is expected to be mainly frictional (considering the total friction angle [Equation 4.2]).
It can be seen that although the residual loads are the same at each pair of tests, the peak loads and the load curve patterns differ. The initial freeze bond failure is usually associated with a sharp increase in the load plots. When the peak load corresponds to the initial freeze bond failure, the displacement at peak is usually smaller. This kind of behaviour can be seen in the one hour aging test at Figure 4.9a. When the peak load is associated with the frictional resistance the failure occurs later as can be seen in the zero aging test of the same figure. Figure 4.9a is shown as an example for the initial freeze bond failure, but in the majority of one hour tests the failure did not occur in the initial part of the curve. Figure 4.9b shows another example of slow tests where both of the failures occur at a larger displacement. Figure 4.9c is an example of a fast test. Comparing the one hour tests with the zero hour tests, it can be seen that the initial portion of the curves has the same slope, but that this slope is sustained to higher loads for the one hour tests. The tests in Fig. 4.9a were conducted immediately after the tests in Fig. 4.9c. Note that the residual load (which is related to the size of the plug under the platen) is much larger in the slow test.
Shear resistance = Peak load sidual load Inertia load
bh
−Re −
2 (4.3)
Figures 4.10 and 4.11 show the displacement at peak load versus test speed for 0 and 1 hour aging tests respectively. The linear trend lines show an increase in displacement with test speed. It can be seen that with increasing the thickness the displacement at peak decreases. Figures 4.6 and 4.7 also show that with increasing thickness the peak load moves to the initial part of the curves which corresponds to freeze bond failure rather than frictional resistance. Also with more aging the displacements corresponding to the peak
Considering the above discussion the results of the tests are presented in two different forms: shear strength, and angle of friction. The shear strength is obtained from:
Shear strength = (Peak – Residual – Inertial)/2bh (4.4)
where b is the width (0.49 m) and h is ice thickness. Figures 4.12.a to 4.12.d show the variation of shear strength with test speed for different thicknesses and two periods of aging. The linear best fits are also shown. It can be seen that there is an increase in shear strength with both speed and aging period and that the increase with speed is almost linear. Figures 4.13.a to 4.13.c show shear strength versus thickness for zero and one hour aging at three different speeds. The best fits show an increase in shear strength with thickness but in some cases the number of data points, especially for 0.5m thickness, is not enough to define a reliable relationship. This trend reflects the effect of normal pressure that can affect both frictional and freeze bonding resistance.
As mentioned earlier visual observations regarding the failure process show that it is reasonable to use Meyerhof’s theory to obtain the friction angle at slow tests. The effect of the freeze bonding on the frictional behaviour will be minimum for the zero aging. It took about 5 to 10 minutes to stir the ice rubble and prepare it for a test. According to experiments of Ettema and Schaefer (1986) even during this time some freeze bonds may develop. The angle of friction was obtained from the following equation given by Meyerhof for a strip footing:
Qu = 2ch + γh2 Kutan φ + W (4.5)
where γ is the specific weight, W is the weight of lifted soil, and Ku is the nominal uplift
coefficient of earth pressure on vertical plane through footing edge. Ku is relatively
constant for a wide range of φ and may for all practical purposes taken as 0.95. In this
case it was assumed that the behaviour is purely frictional (c = 0) and Qu -W is equal to
obtained for friction angle were plotted against speed for different thicknesses (Figs. 4.14.a to 4.14.d). It is interesting that the trends are very similar for different thicknesses and they all intercept with the vertical axes around 30 degrees. Although the linear best fits show an increase with speed, it can be seen that friction angle in most of the cases are almost constant for the slow tests (velocity < 40 mm/s). The friction angles shown in Figure 4.14, based on Meyerhof’s theory, are really only valid for the low speed tests. The increase in the values in higher speed may be due to a change in the nature of the failure and thus, the friction angle for higher speed tests should be obtained from another theory, more suitable for that form of failure.
The friction angles from the tests with rate below 40 mm/s were plotted against thickness and the results are shown in Fig. 4.15. For zero aging the results show a constant angle of 36.5° for all of the thicknesses. For one hour aging the intercept is around 46.5° with slight increase with thickness. Since the peak load in most of the one hour tests seems to correspond to frictional resistance, the difference between the zero and one hour aging can be attributed to the effect of freeze bonding on the friction. The increase of angle with thickness for the one hour tests may also reflect the effect of the normal pressure on the freeze bonds.
4.4 Large Block Test Results
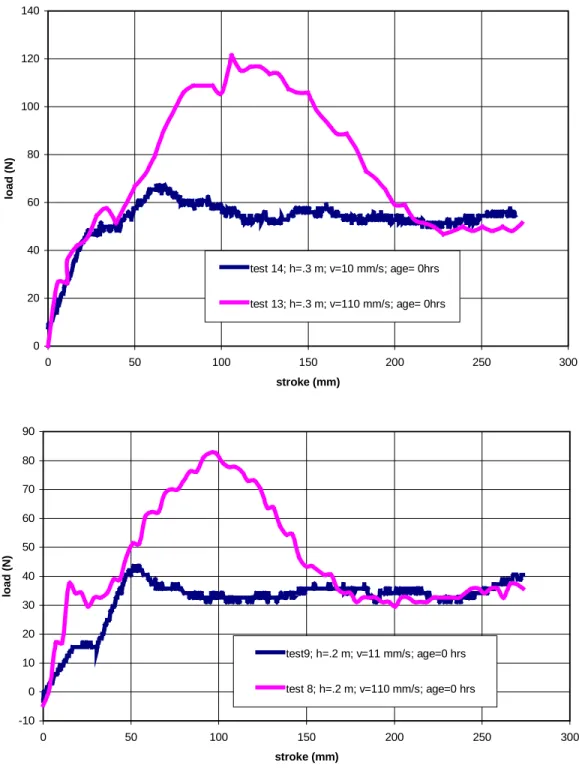
Although only 8 tests were conducted with the larger ice blocks, the results confirm the findings obtained with the smaller blocks. Figure 4.16 plots the shear strength obtained against speed and gives best fit lines that very closely match those shown in Figure 4.12. At this stage there is insufficient data points to provide comparisons between the two block sizes; at this stage there do not appear to be significant differences between the two sets of results.
Table 4.1 Large Block Test Matrix Test No. h (m) Age (hr) Rate (mm/s) T (°C) Date Data file Peak Load (N) Displ. (mm) Time to Peak (sec) Lar8 0.2 0 110 1 01/21 Water8 82.5 94.7 0.85 Lar9 0.2 0 11 1 01/21 Water9 43.5 53.3 5.0 Lar10 0.2 0 110 1 01/21 Water10 77.8 104.6 0.93 Lar12 0.2 0 11 1 01/21 Water12 48.7 55.7 5.0 Lar13 0.3 0 110 1 01/21 Water13 121.4 105.9 0.93 Lar14 0.3 0 10 1 01/21 Water14 66.9 64.9 6.4 Lar15 0.3 0 109 1 01/21 Water15 126.0 109.5 1.0 Lar16 0.3 0 12 1 01/21 Water16 68.5 65.5 5.5
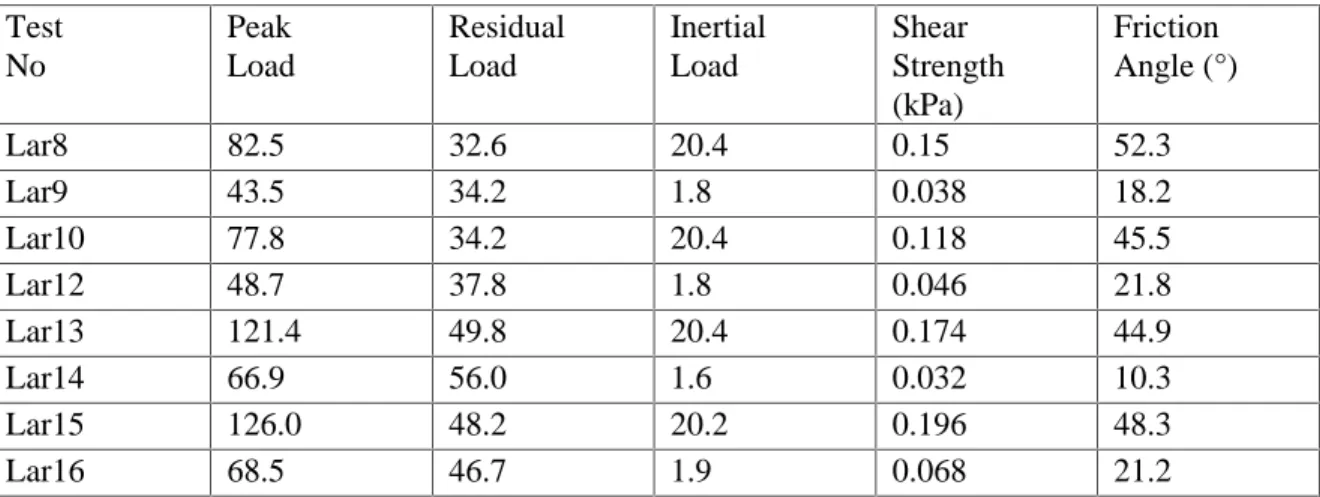
Table 4.2 Large Block Test Results
Test No Peak Load Residual Load Inertial Load Shear Strength (kPa) Friction Angle (°) Lar8 82.5 32.6 20.4 0.15 52.3 Lar9 43.5 34.2 1.8 0.038 18.2 Lar10 77.8 34.2 20.4 0.118 45.5 Lar12 48.7 37.8 1.8 0.046 21.8 Lar13 121.4 49.8 20.4 0.174 44.9 Lar14 66.9 56.0 1.6 0.032 10.3 Lar15 126.0 48.2 20.2 0.196 48.3 Lar16 68.5 46.7 1.9 0.068 21.2
Open Water Tests - High Speed -50 -25 0 25 50 75 100 0.2 0.7 1.2 1.7 2.2 2.7 3.2 Time(s) Loa d (N) 0 150 300 450 600 750 900 S tro ke ( mm) ICEB31 (Load) ICEB37 (Load) ICEB46 (Load) ICEB68 (Load) Average (Load) ICEB31 (Stroke) ICEB37 (Stroke) ICEB46 (Stroke) ICEB68 (Stroke)
Figure 4.1 - Load and deflection versus time for open water tests.
Ice Block Tests - High Speed
-50 -25 0 25 50 75 100 0.5 1 1.5 2 2.5 3 3.5 Time(sec) Loa d (N) 0 50 100 150 200 250 300 350 S tro ke ( mm) ICEB71 (Load) ICEB81 (Load) ICEB88 (Load) ICEB55 (Load) Average (Load) ICEB81 (Stroke) ICEB71 (Stroke) ICEB55 (Stroke) ICEB88 (Stroke)
y = 0.0003x2 + 0.1486x + 0.5509 y = 0.1885x - 0.3222 R2 = 0.9177 0 5 10 15 20 25 30 0 20 40 60 80 100 120 Speed (mm/s) P eak R esi dual ( N ) Peak-Residual Poly. (Peak-Residual) Linear (Peak-Residual)
Figure 4.3 - Inertial load (peak - residual) versus speed for ice block tests.
Figure 4.4 - Load versus stroke for an ice block test and ice rubble test with the same thickness
-20 0 20 40 60 80 100 120 0 50 100 150 200 250 300 Stroke (mm) Load ( N )
ICEB71 (Ice Block, v = 113 mm/s)
Q
uFigure 4.6 - Load versus stroke for 0 aging tests with different thickness h = 0.2 m, age = 0h -20 0 20 40 60 80 100 120 0 50 100 150 200 250 300 Stroke (mm) Loa d (N) ICEB90 (v = 13 mm/s) ICEB89 (v = 119 mm/s) Figure a h = 0.3 m, age = 0h -60 -40 -20 0 20 40 60 80 100 120 140 160 0 50 100 150 200 250 300 Stroke (mm) Loa d (N) ICEB110 (v = 8 mm/s) ICEB112 (v = 119 mm/s) Figure b h = 0.4 m, age = 0h -50 0 50 100 150 200 0 50 100 150 200 250 300 Stroke (mm) Loa d (N) ICEB133 (v = 12 mm/s) ICEB135 (v = 116 mm/s) Figure c h = 0.5 m, age = 0h -50 0 50 100 150 200 250 300 0 50 100 150 200 250 300 Stroke (mm) Loa d (N) ICEB203 (v = 11 mm/s) ICEB207 (v = 109 mm/s) Figure d
Figure 4.7 - Load versus stroke for 1 hour aging tests with different thickness h = 0.2 m, age = 1h 0 20 40 60 80 100 120 140 0 50 100 150 200 250 300 Stroke (mm) Loa d (N) ICEB225 (v = 12 mm/s) ICEB147 (v = 98 mm/s) Figure a h = 0.3 m, age = 1h -20 0 20 40 60 80 100 120 140 160 180 0 50 100 150 200 250 300 Stroke (mm) Loa d (N) ICEB127 (v = 11 mm/s) ICEB111 (v = 112 mm/s) Figure b h = 0.4 m, age = 1h -50 0 50 100 150 200 250 300 0 50 100 150 200 250 300 Stroke (mm) Loa d (N) ICEB132 (v = 11 mm/s) ICEB130 (v = 116 mm/s) Figure c h = 0.5 m, age = 1h -200 -100 0 100 200 300 400 500 0 50 100 150 200 250 300 Stroke (mm) Loa d (N) ICEB206 (v = 108 mm/s) ICEB202 (v = 11 mm/s) Figure d
Figure 4.8 Load versus Stroke - zero aging, large blocks 0 20 40 60 80 100 120 140 0 50 100 150 200 250 300 stroke (mm) lo ad (N ) test 14; h=.3 m; v=10 mm/s; age= 0hrs test 13; h=.3 m; v=110 mm/s; age= 0hrs -10 0 10 20 30 40 50 60 70 80 90 0 50 100 150 200 250 300 stroke (mm) lo ad (N ) test9; h=.2 m; v=11 mm/s; age=0 hrs test 8; h=.2 m; v=110 mm/s; age=0 hrs
Figure a: h = 0.4 m - Speed = 12 mm/s -40 0 40 80 120 160 200 240 23 28 33 38 43 48 53 Time (s) Loa d (N ) 0 50 100 150 200 250 300 350 Stro ke (mm) Load (Age = 1 h ) Load (Age = 0 h ) Stroke (Age = 1 h) Stroke (Age = 0 h Figure b: h = 0.3 m - Speed = 20 mm/s -20 0 20 40 60 80 100 120 140 160 23 28 33 38 Time (s) Loa d (N ) 0 40 80 120 160 200 240 280 320 360 Stro ke (mm) Load (Age = 1 h ) Load (Age = 0 h ) Stroke (Age = 1 h) Stroke (Age = 0 h Figure c: h = 0.4 m - Speed = 106 mm/s -40 0 40 80 120 160 200 240 280 24.5 25.5 26.5 27.5 28.5 29.5 Time (s) Loa d (N ) 0 50 100 150 200 250 300 350 400 Stro ke (mm) Load (Age = 1 h ) Load (Age = 0 h ) Stroke (Age = 1 h) Stroke (Age = 0 h
Figure 4.10 - Displacement at Peak Load - Age = 0 hours 0 20 40 60 80 100 120 140 0 20 40 60 80 100 120 140 Speed (mm/s) D isp alcem en t (m m ) h = 0.2 m h = 0.3 m h = 0.4 m h = 0.5 m Linear (h = 0.5 m) Linear (h = 0.4 m) Linear (h = 0.3 m) Linear (h = 0.2 m)
Figure 4.11 - Displacement at Peak Load - Age = 1 hour
0 20 40 60 80 100 120 0 20 40 60 80 100 120 140 Speed (mm/s) D isp alcem en t (m m ) h = 0.2 m h = 0.3 m h = 0.4 m h = 0.5 m Linear (h = 0.5 m) Linear (h = 0.4 m) Linear (h = 0.3 m) Linear (h = 0.2 m)
Figure 4.12 - Shear strength versus test speed. Fig. a: - h = 0.2 m y = 0.0013x + 0.0142 R2 = 0.8665 y = 0.0015x + 0.0582 R2 = 0.8928 0 0.05 0.1 0.15 0.2 0.25 0.3 0 50 100 150 Speed (mm/s) S h ear st ren g th ( kP a) 0 hours 1 hour Fig. b: - h = 0.3 m y = 0.0009x + 0.0523 R2 = 0.5613 y = 0.0015x + 0.0695 R2 = 0.8044 0 0.05 0.1 0.15 0.2 0.25 0.3 0 50 100 150 Speed (mm/s) S h ear st ren g th ( kP a) 0 hours 1 hour Fig. c: - h = 0.4 m y = 0.0014x + 0.077 R2 = 0.4242 y = 0.002x + 0.1726 R2 = 0.2951 0 0.1 0.2 0.3 0.4 0.5 0.6 0 50 100 150 Speed (mm/s) S h ear st ren g th ( kP a) 0 hours 1 hour Fig. d: - h = 0.5 m y = 0.0027x + 0.0767 R2 = 0.8638 y = 0.0012x + 0.3456 R2 = 0.222 0 0.1 0.2 0.3 0.4 0.5 0.6 0 20 40 60 80 100 120 Speed (mm/s) S h ear st ren g th ( kP a) 0 hours 1 hour
Figure 4.13 - Shear strength versus thickness.
Figure a: - test speed = 9 to 15 mm/s
y = 0.1183x + 0.041 R2 = 0.0262 y = 0.8688x - 0.1365 R2 = 0.6032 0 0.05 0.1 0.15 0.2 0.25 0.3 0.35 0.4 0.45 0.15 0.2 0.25 0.3 0.35 0.4 0.45 0.5 0.55 Thickness (m) Sh ear stren g th (kPa) 0 hours 1 hour
Figure b: - test speed = 46 to 65 mm/s
y = 0.5463x - 0.0439 R2 = 0.6798 y = 0.4558x + 0.0138 R2 = 0.5839 0 0.05 0.1 0.15 0.2 0.25 0.3 0.35 0.15 0.2 0.25 0.3 0.35 0.4 0.45 0.5 0.55 Thickness (m) Sh ear stren g th (kPa) 0 hours 1 hour
Figure c: - test speed = 98 to 120 mm/s
y = 0.4295x + 0.0746 R2 = 0.2772 y = 1.1376x - 0.0697 R2 = 0.8385 0 0.1 0.2 0.3 0.4 0.5 0.6 0.15 0.2 0.25 0.3 0.35 0.4 0.45 0.5 0.55 Thickness (m) Sh ear stren g th (kPa) 0 hours 1 hour
Figure 4.14 - Friction angle versus test speed. Figure a: - h = 0.2 m y = 0.3461x + 30.393 R2 = 0.883 y = 0.2352x + 51.675 R2 = 0.924 0 10 20 30 40 50 60 70 80 90 0 50 100 150 Speed (mm/s) Fr ic tion a ngle (de g re e ) 0 hours 1 hour Figure b: - h = 0.3 m y = 0.2469x + 31.623 R2 = 0.508 y = 0.2641x + 40.868 R2 = 0.8031 0 10 20 30 40 50 60 70 80 0 50 100 150 Speed (mm/s) Fr ic tion a ngle (de g re e ) 0 hours 1 hour Figure c: - h = 0.4 m y = 0.3177x + 29.083 R2 = 0.5038 y = 0.1971x + 50.376 R2 = 0.3199 0 10 20 30 40 50 60 70 80 0 50 100 150 Speed (mm/s) Fr ic tion a ngle (de g re e ) 0 hours 1 hour Figure d: - h = 0.5 m y = 0.3735x + 31.291 R2 = 0.6963 y = 0.043x + 66.366 R2 = 0.1207 0 10 20 30 40 50 60 70 80 0 20 40 60 80 100 120 Speed (mm/s) Fr ic tion a ngle (de g re e ) 0 hours 1 hour
y = -2.1431x + 36.522 R2 = 0.0003 y = 22.803x + 46.697 R2 = 0.0463 0 10 20 30 40 50 60 70 80 0.15 0.2 0.25 0.3 0.35 0.4 0.45 0.5 0.55 Thickness (m) Fr ic ti on angl e ( d egr ee) 0 hours 1 hour
Figure 4.15 - Friction angle versus thickness (speed = 9 to 15 mm/s) .
Figure 4.16 Shear strength for large block tests
y = 0.0014x + 0.0348 R2 = 0.9568 y = 0.0009x + 0.0318 R2 = 0.9396 0 0.05 0.1 0.15 0.2 0.25 0 20 40 60 80 100 120 Speed (mm/sec)
Shear Strength (kPa)
Thickness 0.2 Thickness 0.3
5. CONCLUSIONS
AND
RECOMMENDATIONS
5.1 Conclusions
This report describes a series of tests on model fresh water ice rubble which were designed to measure the strength of the rubble under conditions in which the nature of the failure planes could be observed. This would then permit conclusions to be drawn regarding the behaviour of the rubble during the tests, and the geometry of the failure planes. In this respect, the program continues to be a success.
It was observed that failure mode depended on the test speed. At slow rates a rectangular or trapezoidal plug of ice which encompassed the entire depth was pushed down by the platen and the failure occurred mainly along the surface of this plug. The surrounding ice in the tank was almost undisturbed. Therefore it was concluded that it is possible to use Meyerhof’s theory and obtain the friction angle from the slow tests. The results with the assumption of pure friction showed a constant angle of friction of about 37 degrees for zero aging. For one hour aging the friction angle was about 47 degrees with an slight dependence on thickness. The one hour aging test results show the effect of freeze bonding developments on the ice rubble properties. The failure at higher test rates was more complicated and requires further analysis. Some additional testing of model fresh water ice rubble is also required before the properties can be fully defined.
The test program has shown that the plunge test used for reference testing of model rubble in ice tank tests may be a useful tool, but that information on the characteristics of the failure planes is essential. The early tests using the larger ice blocks suggest that there is an effect of piece size. Further testing using the larger block sizes needs to be undertaken before this effect can be fully quantified.
5.2 Recommendations
The analysis of the results of the first two phases of the work has provided interesting insight into the behaviour of rubble at low speeds. At higher speeds, the behaviour is not yet fully understood, and a means of interpreting the strength of rubble has not been determined. Similarly, the effect of aging periods in excess of one hour is not fully understood, partly because of the need to carry out more controlled experiments without adfreeze to the tank sides.
The effect of piece size, and its relation to the overall scale of the experiments needs to be further investigated based on the early tests reported on here. While it may not be necessary to completely duplicate the full set of tests, sufficient tests should be carried out to clearly define the effect of piece size.
The plane strain nature of the experimental apparatus provide an ideal means of observing interaction behaviour. It is suggested that the tank be used for horizontal indentation tests that would be used to observe the ice behaviour in interactions between wide structures and a rubble field. One disadvantage of the apparatus is the inability to control normal stress. One promising experimental approach that would permit different confining stresses and be able to view the failure planes is through the use of process tomography. As the University of Calgary has one of the most advanced laboratories equipped to do process tomography, we believe that some pilot tests should be carried out to assess the use of this technique.
6.
ACKNOWLEDGEMENTS
The authors would like to acknowledge the support of The Program for Energy Research and Development for supporting this work through NRCC Contract Number: 337884. The authors would also like to express their appreciation for the support of Dan Tilleman, Ghaiss Hajj, and David MacGillvary for their help in modifying the test system, handling the ice, and carrying out the tests. Drs. Jeff Weaver and Bob Frederking have provided useful advice and guidance throughout the work – the authors appreciate their input and advice.
References
Azarnejad A. and Brown T.G., 1999. “Experimental Investigation of Ice Rubble Behaviour and Strength in Punch Tests”, Report submitted to National Research Council of Canada, Ottawa, Canada.
Azarnejad A. and Brown T.G., 1998. “Observations of Ice Rubble Behaviour in Punch
Test”, (Ice In Surface Waters, Editor Hung Tao Shen.) Proc. 14th International
Symposium on Ice Potsdam, New York, Vol.1 pp 589-596.
Brown T.G. and Azarnejad A., 1997. “Experimental Investigation of Ice Rubble Behaviour and Strength in Punch Tests”, Report submitted to National Energy Board (Canada), Calgary, Alberta.
Bruneau S.E., Crocker G.B., McKenna R.F., Croasdale K.R., Metge M., Ritch R., and Weaver J.S., 1998. “Development of Techniques for Measuring In Situ Ice Rubble Shear
Strength”,. Proc. 14th International Symposium on Ice Potsdam, New York, Vol.2.
Ettema, R. and Schaefer, J. A., 1986. “Experiments on Freeze-bonding Between Ice Blocks in Floating Ice Rubble”, Journal of Glaciology, Vol.32, No. 112, pp397-403.
Ettema, R. and Urroz-Aguirre, G. E., 1991. “Friction and Cohesion in Ice Rubble
Reviewed”, Proc. 6th Specialty Conference on Cold Regions Engineering, February,
pp316-325.
McKenna, R. F., 1996. “Shear Strength of Model ice Rubble from Punch Tests”, Contract Report for Institute for Marine Dynamics, NRCC, C-Core Publication 96-C13.
Croasdale, K. R., 1996. “In-Situ Testing of Ice Rubble Properties”, Report submitted to The National Energy Board, (Canada), Calgary, Alberta.
Lepparanta M. and Hakala, R., 1992. “The Structure and Strength of First-Year Ridges in the Baltic Sea”, Cold Regions Science and Technology, 20, pp295-311.
Meyerhof, G. G. and Adams, J. I., 1968. “The Ultimate Uplift Capacity of Foundations”, Canadian Geotechnical Journal, Vol. 5, No. 4, pp225-241.
Appendix A
Result Plots for all Tests Listed by Test Number