Publisher’s version / Version de l'éditeur:
Canadian Journal of Civil Engineering, 26, August 4, pp. 395-401, 1999-08-01
READ THESE TERMS AND CONDITIONS CAREFULLY BEFORE USING THIS WEBSITE. https://nrc-publications.canada.ca/eng/copyright
Vous avez des questions? Nous pouvons vous aider. Pour communiquer directement avec un auteur, consultez la première page de la revue dans laquelle son article a été publié afin de trouver ses coordonnées. Si vous n’arrivez pas à les repérer, communiquez avec nous à PublicationsArchive-ArchivesPublications@nrc-cnrc.gc.ca.
Questions? Contact the NRC Publications Archive team at
PublicationsArchive-ArchivesPublications@nrc-cnrc.gc.ca. If you wish to email the authors directly, please see the first page of the publication for their contact information.
NRC Publications Archive
Archives des publications du CNRC
This publication could be one of several versions: author’s original, accepted manuscript or the publisher’s version. / La version de cette publication peut être l’une des suivantes : la version prépublication de l’auteur, la version acceptée du manuscrit ou la version de l’éditeur.
For the publisher’s version, please access the DOI link below./ Pour consulter la version de l’éditeur, utilisez le lien DOI ci-dessous.
https://doi.org/10.1139/cjce-26-4-395
Access and use of this website and the material on it are subject to the Terms and Conditions set forth at
Performance of pavement crack sealants in cold urban conditions
Masson, J-F.; Collins, P.; Légaré, P-P.
https://publications-cnrc.canada.ca/fra/droits
L’accès à ce site Web et l’utilisation de son contenu sont assujettis aux conditions présentées dans le site LISEZ CES CONDITIONS ATTENTIVEMENT AVANT D’UTILISER CE SITE WEB.
NRC Publications Record / Notice d'Archives des publications de CNRC:
https://nrc-publications.canada.ca/eng/view/object/?id=45265f89-979c-42dc-861e-36243ba939f9 https://publications-cnrc.canada.ca/fra/voir/objet/?id=45265f89-979c-42dc-861e-36243ba939f9Performance of pavement crack sealants in cold
urban conditions
J-F. Masson, P. Collins, and P-P. Légaré
Abstract: Twelve bituminous hot-pour crack sealants were evaluated over four years in temperatures ranging from
–40°C to +40°C. Each sealant was evaluated over 900 linear meters of transverse and longitudinal routs of 12 × 12 mm2, 19 × 19 mm2, and 40 × 10 mm2(width × depth). Results show that sealant source, rout size, and rout orientation affected sealant performance, i.e., debonding and pull-out levels. Debonding levels were 0–50% and pull-out levels 0–30%. Sealant failure was proportional to rout width; it was lowest in 12 mm wide routs and highest in 40 mm wide routs. This result is attributed to the proportional exposure of sealants to slow moving traffic. The increase of sealant failure over time was also found to be nonlinear. Three stages were identified in the failure–time plot. In stage 1, failure is rapid; in stage 2, it plateaus; and in stage 3, it increases again. Failure in stage 1 is thought to be related mainly to a weak sealant – asphalt concrete interface, whereas that in stage 3 is thought to be related to sealant weathering and stiffening. It was also found that standard test results correlate poorly with field performance.
Key words: pavement, crack sealing, sealant, performance, cold weather, failure.
Résumé : Douze mastics bitumineux ont été évalués sur une période de quatre ans sous des températures allant de
–40°C à +40°C. Chacun a été évalué sur 900 mètres linéaires de fraisures transversales ou longitudinales de 12 × 12 mm2, 19 × 19 mm2et 40 × 10 mm2(largeur × profondeur). Les résultats démontrent que la provenance du mastic, la taille de la fraisure et son orientation ont eu un effet sur la performance du produit, c.-à-d. sur les niveaux de décollement et d’arrachement. Les niveaux de décollement variaient entre 0 et 50% et les niveaux d’arrachement, entre 0 et 30%. La performance des mastics était inversement proportionnelle à la largeur des fraisures; elle était meilleure dans les fraisures de 12 mm de largeur que dans celles de 40 mm. Le plus grand taux de rupture des mastics de 40 mm correspond à leur exposition à la circulation. On a aussi constaté que l’aggravation de la rupture des mastics dans le temps était non linéaire. Trois stades ont été mis en évidence dans le graphique rupture–temps. Au premier stade, la rupture est rapide, au deuxième elle se stabilise et au troisième, elle reprend. On croit que la rupture observée au premier stade est attribuable en premier lieu à la faiblesse de l’interface mastic-béton bitumineux, alors que celle constatée au troisième stade serait due au vieillissement et au durcissement du mastic. On a aussi constaté que les résultats des essais normalisés concordaient mal avec la performance en service.
Mots clés : chaussée, fissure, mastic, bouche-fissures, calfeutrage, scellement, performance, rupture, basse température.
Masson et al. 401
Introduction
The sealing of cracks in roadways is a common preven-tive maintenance technique (Chehovits and Manning 1984; Chong 1990; Eaton and Ashcraft 1992; Hubrecht 1986; Knight 1985; LCPC 1981; Tessier 1990). Many studies on bituminous crack sealants pertain to their performance on rapid ways located in regions experiencing “warm winters,” that is, with minima of about –5°C (Erickson 1992; Evers 1991; Ward 1993). Little is known about the performance of
sealants on roadways experiencing minima of –35°C or lower (Belangie and Anderson 1985; Chong and Phang 1988; Lupien et al. 1987); and even less is known about per-formance in cold urban conditions (Chai 1989). The latter conditions are common and most demanding. Light and heavy vehicles stop, accelerate, and turn over the sealant and it is subjected to shear forces almost inexistent on rapid ways. Cold urban conditions can significantly limit the num-ber of sealant materials that perform well over many years and, thus, prevent the ingress of water and incompressible materials into the roadway base.
To select sealant for use in cold temperatures, 1-year field tests (Pearson and Lynch 1992) and modified or extended ASTM standard specification (Belangie and Anderson 1985; City of Montreal 1991; Quebec Ministry of Transportation 1996) have been used. In either case, the selection of sealant for use in a cold climate has remained a difficult task. In an effort to better understand the deterioration of sealant performance in cold urban conditions, we monitored the debonding and pull-out lengths of twelve bituminous crack sealants installed in Montreal, Canada, where streets have a bituminous overlay and a concrete base, and where yearly
Received September 21, 1998.
Revised manuscript accepted December 22, 1998.
J-F. Masson and P. Collins. Institute for Research in
Construction, National Research Council Canada, Ottawa, ON K1A 0R6, Canada.
P-P. Légaré. Service des travaux publics et de
l’environnement, 999 Louvain E., Montréal, QC H2M 1B3, Canada.
Written discussion of this article is welcomed and will be received by the Editor until December 31, 1999 (address inside front cover).
air temperatures vary from –40°C to +40°C. We compared the short-term (1-year) and mid-term (4-year) failure levels and determined the effect of rout size on sealant perfor-mance. From the data for eleven sealants, installed in three rout sizes with two orientations (transverse and longitudi-nal), we sought trends in the increase of failure over time. In the end, we compared the 4-year field performance with standard test results.
Experimental investigation
Sealant materials
The twelve sealants selected for this study were those available to Montreal contractors. Sealants were from Can-ada, U.S.A., France, and the Netherlands. All sealants but one were purported to meet or exceed the ASTM D3405 specification, but only five did in fact meet the specification (Table 1). Nonetheless, all sealants were retained for field trials to compare the standard test results with field perfor-mance.
For application, the sealants were heated in one of two melters. Melter A was not equipped with an automatic tem-perature controller, whereas melter B had a controller. Both reservoirs had a capacity of 1325 L. After each day of oper-ation, remaining sealant was pumped out of the melter, which was refilled the next morning with a new sealant.
Preparation and installation
Cracks were sealed after they were routed, cleaned, and heat treated. A single contractor installed all the sealants. Twenty-four kilometers of cracks with little branching were selected for sealing. Cracks smaller than 4 mm in width were routed to 12 × 12 mm2. Large cracks, 10–15 mm in width, were routed to 40 mm wide by 10 mm deep. Other cracks were routed to 19 × 19 mm2. In all cases, the ratio of rout width to crack width was about 3; and in the absence of a bond breaker, the percent adhesion area at the bottom of the routs varied little. Three routers were used concurrently, each with the cutters set to the predefined rout geometry. The routers were of the impact type and equipped with
car-bide tipped rotating star-shaped cutters (Masson 1997). The cutters were changed after every 3–4 km of routing.
Routs were cleaned with a mechanical sweeper and vac-uum cleaned until no dust could be detected with the hand or eye. Before being filled with sealant, the routs were heated with a hot-air lance (Eaton and Ashcraft 1992; Smith and Romine 1993) from L/A Manufacturing, Co., Model B. The sealant was poured to a level just even with the pavement surface.
Surveys
The sealants were installed in autumn, when average air temperature was about 13°C. Debonding and pull-out lengths were periodically measured with a measuring wheel. Full-depth and partial-depth debonding were not differenti-ated. The percent failure lengths were recorded according to rout size and orientation. The reported average failure lengths are weighed averages, not arithmetic means, calcu-lated from the failure lengths in individual rout sizes and orientations. An example of the calculations will be found in Table 3.
The first field survey was completed after 3 months of service, when the lowest temperature had reached –5°C. Other surveys were done in spring, after 7, 18, 32, and 44 months of service. During the four winters of this study, air temperatures reached –33°C to –40°C.
The cyclic closing and opening of the cracks was also measured during one year. Thirty-six routs, twelve of each rout size, were monitored once a week by measuring the dis-tance between Parker–Kalon nails placed on either side of the rout. The measurements of horizontal crack displace-ments were used to calculate the percent sealant elongation in the various routs. These displacements are for asphalt concrete overlaying a Portland cement concrete base.
Results and discussion
In this study, the practice of an experienced contractor was monitored closely but without our intervention. It was observed that sealants were sometimes heated above the rec-ommended installation temperature, and that in other in-stances, the rout was overheated because of an improper use of the hot-air lance. These observations catalyzed studies on the use of the hot-air lance (Masson and Lacasse 1999) and
© 1999 NRC Canada
396 Can. J. Civ. Eng. Vol. 26, 1999
Sealant Penetration (<90 dmm)*, † Flow (<3 mm)* Resilience (>60%)* Bond (3 cycles)* A 86 0.5 57 No B 68 0.5 64 Yes C 78 0 59 Yes D 67 0.5 62 Yes E‡ 104 1 73 Yes F 122 2 42 Yes G 50 0.5 51 No H 93 0.5 48 Yes J 66 6 48 Yes K 67 0 64 Yes L 76 0.5 63 Yes M 53 0.5 61 Yes
*ASTM D3405 requirements. Levels beyond acceptable limits are
underlined.
†1 dmm = 0.1 mm.
‡Meets ASTM D1190 specification. Table 1. Standard test results.
Before first winter After first winter Sealant Debonding Pull-out Debonding Pull-out
A 1 <1 12 9 B 5 <1 5 <1 C 15 <1 26 16 D 7 <1 10 1 E 1 <1 11 1 F 2 <1 19 4 G 3 <1 24 3 H 7 <1 13 2 J 1 <1 8 6 K 2 1 2 2 L 1 <1 8 3 M <1 <1 7 2
sealant heating practices (Masson et al. 1998). Here the per-formance of sealants in the 11 km of routs (about 900 m per sealant) where sealant installation was acceptable is re-ported, rather than over the total 24 km of routed cracks.
Short- and mid-term performances
The initial survey was carried out three months after in-stallation and did not reveal substantial sealant pull outs or appearance changes, but it showed that most sealants exhib-ited some debonding when exposed for several weeks with temperatures down to –5°C (Table 2). After exposure to temperatures of –35°C during the first winter, sealants then showed a marked increase in debonding and pull-out length from previous levels (Table 2). At that point, sealant C had showed exceedingly high failure levels and was deemed in-appropriate for further study.
Sealant performance continued to deteriorate with time. Subsequent surveys showed that sealants weathered and changed significantly; their surface showed cracks, scratches, and pin-holes due to intrusion of stones and fine particles. Each spring, survey showed that debonding and pull-out
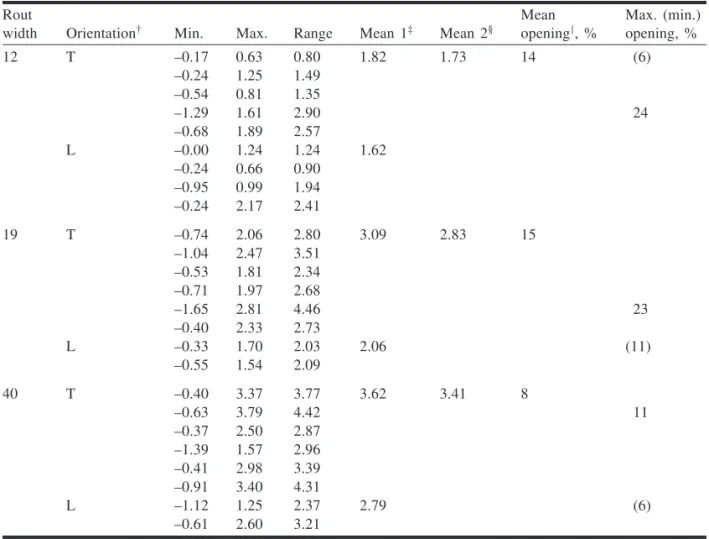
levels could increase significantly during winter. Tables 3 and 4 show the four-year percent failure lengths for trans-verse and longitudinal routs, and total percent failures of the sealants. The latter shows the wide spectrum of perfor-mance, or lack of it, that can be expected from different products. This is consistent with the observations of others (Lynch and Janssen 1997). Here, debonding levels ranged from 0 to almost 50% and pull-out levels ranged from 0 to 30%, depending on rout size and sealant source. The results also show that with few exceptions, and irrespective of rout size, sealant in transverse cracks are more susceptible to fail-ure than that in longitudinal cracks, probably because trans-verse cracks open wider than longitudinal ones (Table 5). No attempts were made to correlate individual sealant per-formance with the opening of the various routs because too little data was available for a meaningful analysis of such performance.
The effect of rout size on performance can conveniently be looked at when failures in the transverse and longitudinal routs are combined (columns 8–10, Tables 3 and 4). With a 1% (10 m) difference deemed significant, each sealant and
Transverse routs* Longitudinal routs* Combined orientations Wt. avg.† (%) Sealant 12 19 40 12 19 40 12 19 40 A 14 16 17 4 6 9 7 10 14 11 B 22 22 31 13 21 15 16 21 24 22 C‡ 32 29 35 18 6 9 26 24 27 26 D 20 25 33 12 16 23 15 20 30 22 E 12 16 31 3 13 24 9 14 28 20 F 19 16 19 8 9 22 14 13 19 15 G 30 42 47 30 29 32 30 36 40 36 H 16 9 20 0 6 5 13 8 15 9 J 15 13 17 7 5 6 14 11 16 13 K 29 36 27 8 9 26 17 24 27 21 L 10 8 7 3 5 6 7 5 7 6 M 19 19 21 12 11 16 15 14 17 16 *12: 12 × 12 mm2; 19: 19 × 19 mm2; 40: 40 × 10 mm2(width × depth). †Weight average: wt. avg. =Σ(pL
i)/Lt, where p is the percent failure in rout i of length Liand Ltis the total rout
length, e.g., sealant A, [(0.14 × 87 m) + (0.16 × 188 m) + (0.17 × 216 m) + (0.04 × 165 m) + (0.06 × 222 m) + (0.09 × 139 m)] / 1017 m = 0.11.
‡Results after the first winter; monitoring discontinued thereafter.
Table 3. Percent debonding length of crack sealants after four winters.
Transverse routs* Longitudinal routs* Combined orientations
Wt. avg. (%) Sealant 12 19 40 12 19 40 12 19 40 A 19 15 20 4 12 15 9 13 18 14 B 0 2 1 0 0 0 0 1 1 1 C 31 19 14 6 1 3 21 16 11 16 D 3 12 6 4 3 5 3 7 6 6 E 5 1 4 1 0 1 3 1 3 2 F 11 9 3 6 4 20 9 4 5 5 G 17 7 30 8 9 15 13 8 24 14 H 10 5 10 0 1 1 8 3 7 4 J 18 10 15 3 7 6 15 9 14 12 K 9 24 5 3 5 12 5 16 16 11 L 7 4 2 0 16 0 4 14 1 10 M 3 5 11 1 4 2 2 5 5 5 *12: 12 × 12 mm2; 19: 19 × 19 mm2; 40: 40 × 10 mm2(width × depth). Table 4. Percent pull-out length of crack sealants after four winters.
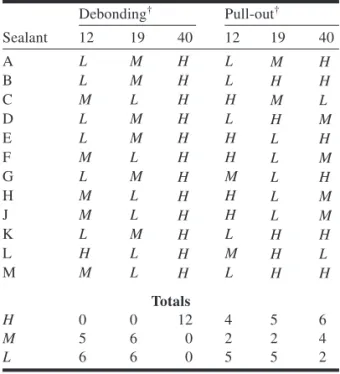
rout size combination was compared and qualified as low, medium, or high. The results are shown in Table 6. Unex-pectedly, they revealed that sealants in routs of 12 × 12 mm2 debonded less than sealants in routs of 40 × 10 mm2.
Based on numerical models (Kuri and Tons 1992; Tons 1962; Wang and Weisgerber 1993), sealants in 40 mm wide routs, with a width-to-height ratio, W/H, of 4 should have performed better than sealants in 12 or 19 mm wide routs, with W/H = 1. Factors peculiar to field conditions, not in-cluded in the models, are most likely responsible for the dis-crepancy between the observed and expected performances. Some factors can readily be excluded. Table 5 shows, for ex-ample, that differences in percent crack opening and associ-ated tensile stresses cannot account for the discrepancy. Sealants in 40 mm wide routs had been exposed to only half the extension of other sealants. Sealant adhesion at the rout bottom also does little to explain the inconsistency, as it can only account for greater cohesive failure due to an increase in stress immediately above the crack (Wang and Weisgerber 1993). Moreover, the relative adhesion area amongst the routs had been held constant by adjusting the ratio rout width to crack width to about 3. Consequently, factors other than sealant adhesion to asphalt concrete and the tensile (compressive) stress induced by the crack opening (closing) influenced sealant performance.
Sealant aging and unaccounted shear stresses at the seal-ant surface can explain the discrepancy between the ob-served and expected performances. Wider sealants are subjected to more weathering and may age more quickly. Sealants can lose a substantial amount of plasticizing oil within a single year (Masson and Lacasse 1997) and the rel-ative loss of oil may be greater in the largest sealant. In the urban setting, the shear stress at the sealant surface possibly play a dominant role, however. With the current practice, the sealant is most often leveled with the pavement surface. Consequently, it may be sheared by tires from vehicles that move slowly, stop, accelerate, and turn while in contact with the sealant surface. The large surface and the exposure of the 40 mm wide sealant to shear stresses would also explain its tendency towards greater pull-out levels (Table 6).
Performance trends
In service, sealants do not remain unchanged as they are exposed to water, sunlight, and freezing and thawing cycles. They weather like other bituminous materials (Minkarah et al. 1992; Petersen 1984). As a result, they may harden (Bahia and Anderson 1991) and loose elasticity in cold tem-peratures. For that reason, sealants are sometimes selected based on field tests, the one-year test being most common (Pearson and Lynch 1992). Figure 1, with a trend typical of
© 1999 NRC Canada
398 Can. J. Civ. Eng. Vol. 26, 1999
Rout
width Orientation† Min. Max. Range Mean 1‡ Mean 2§
Mean opening2, % Max. (min.) opening, % 12 T –0.17 0.63 0.80 1.82 1.73 14 (6) –0.24 1.25 1.49 –0.54 0.81 1.35 –1.29 1.61 2.90 24 –0.68 1.89 2.57 L –0.00 1.24 1.24 1.62 –0.24 0.66 0.90 –0.95 0.99 1.94 –0.24 2.17 2.41 19 T –0.74 2.06 2.80 3.09 2.83 15 –1.04 2.47 3.51 –0.53 1.81 2.34 –0.71 1.97 2.68 –1.65 2.81 4.46 23 –0.40 2.33 2.73 L –0.33 1.70 2.03 2.06 (11) –0.55 1.54 2.09 40 T –0.40 3.37 3.77 3.62 3.41 8 –0.63 3.79 4.42 11 –0.37 2.50 2.87 –1.39 1.57 2.96 –0.41 2.98 3.39 –0.91 3.40 4.31 L –1.12 1.25 2.37 2.79 (6) –0.61 2.60 3.21
*From opening in April when the weekly average temperature was 7°C. †T, transverse; L, longitudinal.
‡Mean according to orientation and rout width. §Mean according to rout width.
2
Mean percent opening (mean 2 / rout width).
the observed time-dependent performance, shows that seal-ant failure did not increase linearly and that a one-year test would have failed to accurately predict a longer-term perfor-mance. The increase in sealant failure could typically be di-vided in three stages. The initial stage, a steeply rising slope, covered the first year of service. This stage was followed by a period of nearly two years where pull-out lengths re-mained fairly constant. In the final stage, from 32 months to 44 months in the example, the failure increased again, with that in the 12 mm wide rout exceeding that in the others.
The change in sealant performance is evidently more complex than anticipated. The grouping of 66 failure curves (eleven sealants, three rout geometries, two orientations) such as those in Fig. 1 allowed for highlighting recurrent trends. These are shown in Figs. 2 and 3. Pull-out trends were labeled P1 to P4 (Fig. 2) and debonding trends were la-beled D1 to D4 (Fig. 3). In the best case, failure levels re-mained low and increased quasi-linearly (P1, P2, D3). In contrast, failure could reach a plateau after a one- or two-year period of rapid failure (P3, D4). In cases where final failure levels were high (D1, D2, P4), initial sealant failure was high and the plateau was short.
The exact reasons for the changes in failure rates remain unknown, but they are likely linked to specific components in the sealant – asphalt concrete system, namely, the inter-face and the sealant itself. Excessive sealant stiffness and a weak interface may be responsible for the initial and rapid increase in debonding. A weak interface may result from in-terfacial defects such as microcracks at the asphalt concrete surface and voids due to dust or incomplete sealant wetting. Sealant weathering and stiffening may be responsible for the later increase in debonding. On this ground, an extended first phase would be characteristic of stiff sealants, or alter-natively of an aged and brittle pavement, whereas an
ex-tended second phase, a long plateau, would be characteristic of a better sealant.
Sealant selection for long-term performance
To estimate long-term performance and rank the twelve sealants, the 4-year pull-out and debonding levels were con-sidered. For that purpose, a performance index was calcu-lated. A simple addition of the respective debonding and pull-out levels would have implied that both types of fail-ures were equally damaging to pavements, and would have underestimated the effect of pull-outs on pavement degrada-tion. Consequently, pull-out lengths were given more weight than debonding lengths in the determination of a perfor-mance index. To that effect, the following equation was used:
PI = 100 – (D + nP)
where PI is the sealant performance index; D is the percent debonded length of the sealant; P is the percent pull-out length; and n is an integer that accounts for the effect of pull-outs over debonding on performance.
Given that the absence of sealant over 1 m of crack may allow the ingress of sand and stones that can damage the pavement during its expansion (Peterson 1982), and also al-low the penetration of much more water than a simple seal-ant debonding over the same length, a value of n = 4 was thought reasonable. The approach is admittedly simplistic and the choice of n subjective, but it allowed us to fairly ap-preciate the performance of the sealants and it made for an easy comparison of the individual performances (values of n < 4 provided a similar ranking of materials but the differ-ence of PI between the sealants was somewhat reduced).
Accordingly, sealants could be ranked in decreasing order of field performance and the performance compared to ASTM test results (Table 7). Little correlation between field and laboratory test results could be found, which is consis-tent with the work of others (Lynch and Janssen 1997).
Seal-Debonding† Pull-out† Sealant 12 19 40 12 19 40 A L M H L M H B L M H L H H C M L H H M L D L M H L H M E L M H H L H F M L H H L M G L M H M L H H M L H H L M J M L H H L M K L M H L H H L H L H M H L M M L H L H H Totals H 0 0 12 4 5 6 M 5 6 0 2 2 4 L 6 6 0 5 5 2 *12: 12 × 12 mm2; 19: 19 × 19 mm2; 40: 40 × 10 mm2. †L, M, and H represent low, medium, and high failure
levels, respectively.
Table 6. Frequency of failure levels in different
routs.*
ants H and E, which showed good field performance, failed to meet the requirements of the specification. In contrast, Sealant K, which met the standard requirements, showed poor field performance. In the end, average performers (e.g., Sealants M, L, D) were more likely to meet the ASTM D3405 specification than sealants at the performance limits, the good and the poor sealants. The usefulness of the speci-fication in selecting good sealants, those required for de-manding conditions, may thus be questioned. The results for penetration can be especially misleading. It has been shown by Lu and Isacsson (1997) that there is little correlation be-tween the performance of polymer-modified bitumens, e.g., crack sealants, and their penetration values. The existing
specification limits the penetration to 90 dmm but three of the four best performers in this study exceeded that limit.
Conclusions
Twelve bituminous crack sealants were installed in routs of 12 × 12 mm2, 19 × 19 mm2, and 40 × 10 mm2(width × depth), and evaluated over 4 years in an urban setting with air temperatures ranging from –40°C to +40°C. The pave-ment, in which crack opening ranged from 6% to 24%, was a bituminous overlay with a concrete base. The short-term (1-year) and mid-term (4-year) debonding and pull-out lev-els were compared; the effect of rout size on performance was determined; failure trends were identified, and overall performance was compared with standard test results.
Sealant performance was found to vary tremendously from one product to the next. The four-year debonding lev-els varied from 0 to 50% whereas pull-out levlev-els varied from 0 to 30%, depending on sealant shape (rout size) and crack orientation. Relative failure levels often correlated with seal-ant width, overall performance increasing in the order 40 mm < 19 mm < 12 mm. The trend follows the increased exposure of sealants to weathering and slow moving traffic.
Sealant debonding and pull-out did not increase linearly, as three stages were identified in the time–failure curve. In stage 1, failure increased rapidly. In stage 2, little failure oc-curred and in stage 3, failure increases again but at a slower rate than in stage 1. Failures in stage 1 are thought to be re-lated to a weak sealant – asphalt concrete interface whereas those of stage 3 are thought to be related to sealant weather-ing and stiffenweather-ing.
It was also found that sealants with either good or poor field performance failed to meet the requirements of the ASTM D3405 specification. Sealants demonstrating average performance were more likely to meet the specification.
In corollary to this study, it can be said that crack sealing is still an evolving technique. This method of preventive maintenance has been shown to extend the service life of rapid ways, which translates into economic benefits. These
© 1999 NRC Canada
400 Can. J. Civ. Eng. Vol. 26, 1999
Fig. 2. Pull-out trends for sealants in Montreal. The trends
occurred with equal frequency.
Fig. 3. Debonding trends for sealants in Montreal. Occurrences
were 40%, 8%, 33%, and 19% for trends D1, D2, D3, and D4, respectively. Sealant Performance index 4-year performance ASTM acceptance* H 75 Good No B 74 Yes E 72 No F 65 Average No M 64 Yes L 54 Yes D 54 Yes J 39 Poor No K 35 Yes A 33 No C† 10 Very poor No G 8 No *From Table 1.
†After one year of service.
Table 7. Sealant acceptance based on standard and
benefits are identical in the urban setting, but the service conditions are different. For maximum benefits, it is re-quired that sealant installation be adapted to urban condi-tions and that installacondi-tions suitable for rapid ways not be used indiscriminately in the city, the rout size being a case in point. The existing sealant specification also does little to provide maximum benefits. To select sealants adapted to the demanding cold urban conditions, a performance-based specification is required.
References
Bahia, H.U., and Anderson, D.A. 1991. Isothermal low-temperature physical hardening of asphalt cements. Proceedings of the International Symposium on Chemistry of Bitumens, Rome, Italy, Vol. 1, pp. 114–147.
Belangie, M.C., and Anderson, D.I. 1985. Crack sealing methods and materials for flexible pavements. Utah Department of Trans-portation, Salt Lake City, Utah, Report FHWA/UT-85/1. Chai, J. 1989. Crack sealing test program. 1986 test sealants, final
report. Pavement Managements Systems, The City of Edmonton Transportation Department, Edmonton, Alta.
Chehovits, J., and Manning, M. 1984. Materials and methods for sealing cracks in asphalt concrete pavements. Transportation Research Record 990, Transportation Research Board, Washing-ton, D.C., pp. 12–19.
City of Montreal. 1991. Specifications for crack sealing in Montreal. Public Works Service, Montreal, Que.
Eaton, R.A., and Ashcraft, J. 1992. State-of-the-art survey of flexi-ble pavement crack sealing procedures in the United States. Cold Regions Research & Engineering Laboratory, U.S. Army Corps of Engineers, Hanover, N.H., Report 9218.
Erickson, D.E. 1992. Crack sealing effectiveness. Washington State Department of Transportation, Washington, D.C., Report WA-RD256.1.
Evers, R.C. 1981. Evaluation of crack-sealing compounds for asphaltic pavements. Ontario Ministry of Transportation and Communications, Toronto, Ont., Project No. 33, Interim Report No. 1.
Hubrecht, L. 1986. Réparation des joints de construction dans les revêtements asphaltiques. Centre de recherches routières, Brussels, Belgium.
Khuri, F.M., and Tons, E. 1992. Comparing rectangular and trape-zoidal seals using the finite element method. Transportation Research Record 1334, Transportation Research Board, Wash-ington, D.C., pp. 25–37.
Knight, N.E. 1985. Sealing cracks in bituminous overlays of rigid bases. Transportation Research Record 1041, Transportation Research Board, Washington, D.C., pp. 75–81.
LCPC. 1981. Scellement des fissures. Laboratoire Central des Ponts et Chaussées, Paris, France.
Lu, X., and Isacsson, U. 1997. Characterization of styrene-butadiene-styrene polymer modified bitumens — comparison of conventional methods and dynamic mechanical analyses. Jour-nal of Testing and Evaluation, 25(4): 383–390.
Lupien, C., Roireau, M., and Vézina, D. 1987. Crack sealing: an evaluation of a few compounds and a variety of application conditions. Paving in Cold Areas, 1(3): 689–718.
Lynch, L.N., and Janssen, D.J. 1997. Sealant specifications: past, present, and future. Proceedings of the Pavement Crack and Joint Sealants for Rigid and Flexible Pavements Conference, United States Army Engineer Waterways Experiment Station, Airfields and Pavements Division, Vicksburg, Miss., pp. 5–23. Masson, J-F. 1997. Effective sealing of pavement cracks in cold
ur-ban environments. Institute for Research in Construction, National Research Council Canada, Ottawa, Ont.
Masson, J-F., and Lacasse, M.A. 1997. Towards a performance-based specification for bituminous crack sealants used in ur-ban conditions. Proceedings of the Pavement Crack and Joint Sealants for Rigid and Flexible Pavements Conference, United States Army Engineer Waterways Experiment Station, Airfields and Pavements Division, Vicksburg, Miss., pp. 152–167. Masson, J-F., and Lacasse, M.A. 1999. The effect of the hot-air
lance on the adhesion of sealants used in roadway maintenance. Journal of Transportation Engineering, 125: In press.
Masson, J-F., Lauzier, C., Collins, P., and Lacasse, M.A. 1998. Sealant degradation during the crack sealing of pavements. Jour-nal of Materials in Civil Engineering, 10(4): 250–255. Minkarah, I., Cook, J.P., and Rajogopal, A.S. 1992. Applicability
of artificial weathering tests for performance evaluation of elastomeric sealants. In Science and technology of building seals, sealants, glazing, and waterproofing. Vol. 2. ASTM STP 1200. Edited by J.M. Klosowski. American Society for Testing and Materials, Philadelphia, Pa.
Pearson, D.C., and Lynch, D.F. 1992. The quality of rubberized asphalt crack sealer for asphalt pavements supplied in 1991. Ontario Ministry of Transportation, Toronto, Ont., Report MI-154. Petersen, J.C. 1984. Chemical composition of asphalt as related to
asphalt durability: state of the art. Transportation Research Re-cord 999, Transportation Research Board, Washington, D.C., pp. 13–30.
Peterson, D.E. 1982. Resealing joints and cracks in rigid and flexi-ble pavements. NCHRP Synthesis of Highway Practice 98, Transportation Research Board, Washington, D.C.
Quebec Ministry of Transportation. 1996. Specifications for crack sealing in the Province of Quebec. Québec, Que.
Smith, K.L., and Romine, A.R. 1993. Materials and procedure for sealing and filling cracks in asphalt-surfaced pavements. Strate-gic Highway Research Program, National Research Council, Washington, D.C., Report SHRP-H-348.
Tessier, G.R. 1990. Guide de construction et d’entretien des chaussées. Association Québecoise des Travaux Routiers, Montreal, Que.
Tons, E. 1962. Geometry of simple joint seals under strain. New joint sealants: criteria, design, and materials. Publication No. 1006, Building Research Institute, Washington, D.C., pp. 41–61.
Wang, C.P., and Weisgerber, F.E. 1993. Effects of seal geometry on adhesive stresses in pavement joint seals. Transportation Research Record 999, Transportation Research Board, Washington, D.C., pp. 64–70.
Ward, D.R. 1993. Evaluation of crack sealant performance on Indiana’s asphalt concrete surfaced pavements. Indiana Depart-ment of Transportation, Indianapolis, Ind.