Publisher’s version / Version de l'éditeur:
Vous avez des questions? Nous pouvons vous aider. Pour communiquer directement avec un auteur, consultez la première page de la revue dans laquelle son article a été publié afin de trouver ses coordonnées. Si vous n’arrivez pas à les repérer, communiquez avec nous à PublicationsArchive-ArchivesPublications@nrc-cnrc.gc.ca.
Questions? Contact the NRC Publications Archive team at
PublicationsArchive-ArchivesPublications@nrc-cnrc.gc.ca. If you wish to email the authors directly, please see the first page of the publication for their contact information.
https://publications-cnrc.canada.ca/fra/droits
L’accès à ce site Web et l’utilisation de son contenu sont assujettis aux conditions présentées dans le site
LISEZ CES CONDITIONS ATTENTIVEMENT AVANT D’UTILISER CE SITE WEB.
Materials Research Society Symposium Proceedings, 137, pp. 59-73, 1989
READ THESE TERMS AND CONDITIONS CAREFULLY BEFORE USING THIS WEBSITE. https://nrc-publications.canada.ca/eng/copyright
NRC Publications Archive Record / Notice des Archives des publications du CNRC :
https://nrc-publications.canada.ca/eng/view/object/?id=4350659c-67e2-46a3-ab9b-b87b149543ea
https://publications-cnrc.canada.ca/fra/voir/objet/?id=4350659c-67e2-46a3-ab9b-b87b149543ea
NRC Publications Archive
Archives des publications du CNRC
This publication could be one of several versions: author’s original, accepted manuscript or the publisher’s version. / La version de cette publication peut être l’une des suivantes : la version prépublication de l’auteur, la version acceptée du manuscrit ou la version de l’éditeur.
Access and use of this website and the material on it are subject to the Terms and Conditions set forth at
The Porosity and pore structure of hydrated Portland cement paste
S e r
T H 1
--N 2 l d
National Research
C o d
national
n o
,
1
6
4
1
Council
Canada
de mdmches
Canada
c.
2
BLDG
Institute for
Research in
recherche en
institut de
- .-
Construction
construction
The
Porosity and Pore
Structure of
Hydrated
Portland Cement Paste
by R.F. Feldman
ANALYZED
Reprinted from
Materials Research Society S mposium
Proceedings. Vol. 137, "Pore gtructure
and Permeability of Cementitious Materials"
p. 59-73
(IRC Paper No.
1641)NRCC 31 116
N R C
-
CIBTII R C
i
7.1L I B R A R Y
. .
Abstract
Pore structure examination by the a p p l i c a t i o n of s e v e r a l t e e h n i q w s on hydrated portland cement i s described, h i g h l i g h t i n g the special properties of i n t e r l a y e r space. The properties o f water a d other adsorbates held i n the i n t e r l a y e r space a r e emphasized.
L1auteur d 6 c r i t i c i d i v e r s e s techniques employees Dour dgtewinar
-- ~ -~- A p
l a s t r u c t - '
-
--time Lespropri6t F & 1"eau
THE POROSITY AND PORE STRUCTURE OF HYDRATED PORTLAND CEMENT PASTE
R.F. FELDMAN
National Research Council of Canada, Institute for Research in Construction. Building Materials Section, Ottawa KIA OR6. Canada
I
INTRODUCTIONI Pore structure and the surface area of the pores are the most important
characteristics controlling the properties of porous materials. Many techniques,
i
based largely on nitrogen or water vapour isotherms or mercury porosimetry, havebeen used to determine the pore structure of solids. Values obtained from these methods have been relatively reliable for materials with pore structures that remain stable on removal or addition of water.
Hydrated portland cement, however, is a very unstable material and hence knowledge of the relation between porosity and mechanical properties needed for engineering design presents difficulties. Used as a displacement fluid, water always gives a higher porosity for 0-dried hydrated Portland cement than other media such as mercury, nitrogen, methanol, propanol, pentane and helium [I]. Many of the properties of hydrated portland cement are measured after drying, but thls leads to decomposition of the hydrates. In addition changes in porosity, surface area, and other physical properties will occur when this system is dried; ii water is used for measurement, rehydration of the decomposed hydrates may make
' results difficult to interpret.
The solvent exchange [3, 4, 51 technique using several alcohols and other
organic solvents may reduce the amount of change to the pore structure during removal of water but in this technique it is difficult to differentiate between the various types of water that are replaced.
Other techniques have been used to study pore structure of hydrated cement paste or the state of the water in the pores besides simple displacement methods. Some of these are as follows: nuclear magnetic resonance, low angle x-ray scattering, quasi-elastic neutron scattering, differential thermal analysis, water and methanol sorption with associated length and modulus of elasticity changes and the helium flow technique which enables the calculation of the hydraulic radius of the internal structure [6.
7.
Other measurements have shown that the size of the entrances of pores is affected by stress [8].The results using a variety of techniques have made it clear that most previous workers have included interlayer space and in some cases the space occupied by more strongly held hydrate water as a part of the pore structure. This is not satisfactory, and a more specific description of the types of spaces that may be regarded as pore spaces is needed. Much work has been done in this regard
[A.
It is more realistic to consider the concept of pore water as follows: water that can be removed from a porous body without significant changes in dimensions (ie.i
only changes that can be described as Bangham type) or mechanical rigidity (nochange in modulus of elasticity) and cannot be described as structural water of the unit cell, is considered as pore water.
This paper will describe pore structure examinations by the application of several techniques on hydrated portland cement, highlighting the special properties of interlayer space by which it can be distinguished from normal pores, and the special properties of water or other adsorbates held in the interlayer space.
- - . -. - . .-
60 I
I
P
Applicability of various liquids and techniques for pore structure determination is described as follows.
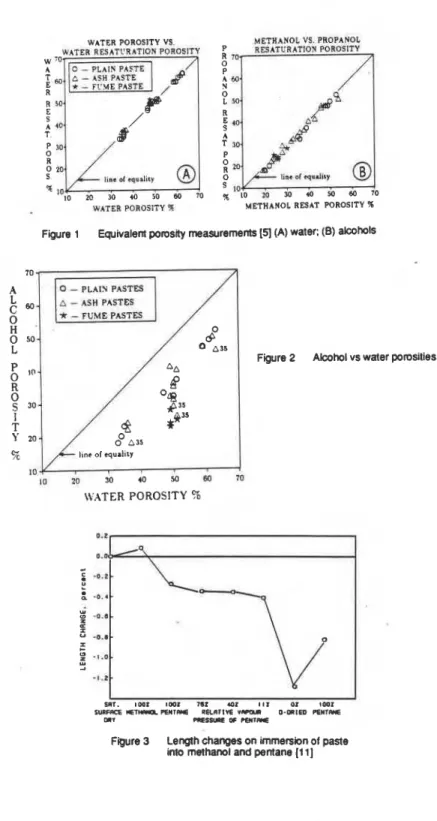
A comparison of porosity determinations by the above methods regardless of paste type and curing conditions, shows that in some cases similar results may be obtained. The porostty determined by the loss of evaporable water (water porosity) is the same as that determined by drying the sample and then rewetting with water
[5,
7 ,
(Figure 1 a). In addition, a good one-to-one correlation also is found between methanol and propanol resaturation porosities (termed alcohol porosity) where drying is carried out initially (Figure 1b).
The alcohol porosity is plotted versus the water porosity in Figure 2. Lower porosities with alcohol illustrate the inabiltty of alcohol to enter the interlayer I
structure after the hydrated cement paste has been dried. The pastes prepared with silica fume and fly ash cured for 90 days at 35OC are the furthest from the line of equality [5] indicating a low Ca(OH)2 content with attendant isolated pores [9].
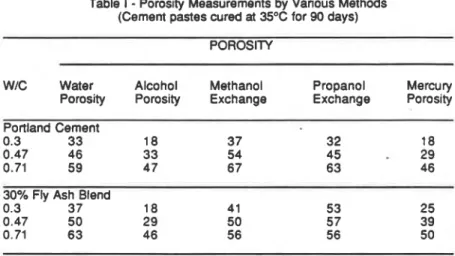
The water and alcohol porosities for a portland cement paste and a fly ash blend are presented in Table 1 at three water cement ratios [5]; the water porosities are always greater. Results obtained from methanol and propanol exchange and mercury intrusion are included in the table and will be discussed later.
Table I
-
Porosity Measurements by Various Methods(Cement pastes cured at 35°C for 90 days)
POROSITY
W/C Water Alcohol Methanol Propanol Mercury
Porosity Porosity Exchange Exchange Porosity
Portland Cement
0.3 33 18 37 32 18
0.47 46 33 54 45
-
290.71 59 4 7 67 63 46
30% Fly Ash Blend
0.3 3 7 18 41 53 25
0.47 50 29 50 57 39
0.71 63 46 56 56 50
-
This is performed by immersing saturated, surface dry specimens into alarge volume of dry solvent [3, 4, 51 and measuring the weight change. Some
results [5] are presented in Table I. The scatter in some cases is large because of the difficulties in establishing surface drying conditions. It is clear in comparing the results that the concept that all the water in plain or blended hydrated cement pastes can be exchanged by alcohol is valid, since the solvent exchange porosity is similar to the water porosity.
'+Ll
,;.-
ojo
$ la 10 WATER POROSITY % METHANOL VS. PROPANOLL;w.nR;;q
R 7 P A 60 S A T 30 P 0 R Ua. cd q.di&y s 10 % lo 20 30 (0 50 Bb 10 METHANOL RESAT F'OROSITY %Figure 1 Equivalent pomsity measurements
(51
(A) water: (B) alcohols0
*
-
FUME PASTESl o w
WATER POROSITY 4
Figure 2 Alcohol vs water pomslies (51
)
I I
511. I W I l r n l 162 a 1 111 0 1 ID01
SWFACE MET- R I I l R * E I K R l l V 6 V ( C ( U 0-mIED R I I T r Y E mr C I E S S U ~ ~ OF PENTRE
Figure 3 Length changes on immersion of paste
62
Table II
-
Young's Modulus of Water-Saturated and Solvent Exchanged Paste (W/C = 0.8) kglcm2 x 104 [i 0]Specimen # Water Methanol Pentane D-dried
Saturated Exchanged Exchanged
1 0.6792 0.5726 0.6704 0.7635 2 0.6292 0.51 41 0.6565 0.8374 3 0.6820 0.4680
---
---
4 0.6356 0.5056 0.5484 0.8956 5 0.6972 0.5468 0.6562 0.9697 6 0.6880 0.4918 0.5897 0.7663 Mean 0.6685 0.5165 0.6242 0.8463 % Change Relative to Water Saturated State---
-22.7 -6.7 +26.5The influence of solvents on pore structure may be illustrated from the following obsewations.
Results of Young's modulus measurements are presented In Table 11 [I 01. The water saturated specimens were immersed consecutively in dry methanol, dly pentane and then 0-dried. After each srage. Young's modulus was measured. Immersion in methanol produced a decrease of Young's modulus of 22.7% with respect to the water-saturated specimens, while this decrease was reduced to only 6.7% after immersion in pentane: D-drying resulted in an increase of 26.5%.
Attendant length changes are presented in Figure 3 [I I]. When the water saturated specimens are immersed in alcohol, an ex~ansion of 0.085% occurs; on immersion in pentane a shrinkage of 0.36O/0 occurs. ~eduction of pentane relative vapour pressure to 11% results in a shrinkage of 0.136% and D-drying results in a further shtinkage of 0.844%. Reimmersion In pentane results in an expansion of 0.43%.
Direct 0-drying of specimens containing methanol from 1 1 % relative pressure results in approximately 1.3 to 1.5% shnnkage. This compares to approximately 1.0% shrinkage under similar conditions wtth water occupying the interlayer spaces. These results indicate that the solvent exchanges positions with the water in the interlayer space. In the case of methanol, the expansion is a resun of the greater size of the methanol molecule and its polar nature, The greater separation of the sheets results in a reduction of the Young's modulus. The shrinkage after replacement with pentane and the increase in Young's modulus is consistent with
the interlayer penetration concept. The final increase in Young's modulus together with the attendant large shrinkage on Ddrying has not been observed previously when water was removed from the interlayer spaces. This may be due to the interaction of methanol with calcium ions residing between the sheets [I 2-1 41.
It is concluded that the solvent replacement method does not differentiate between normal pores and interlayer spaces, but is useful in detecting changes to the hydrated portland cement paste structure due to various drying pre-treatments. The technique may also be used for drying but it is clear that both the introduction and removal of the solvent imposes its own imprint on the pore structure.
* 5 0 I I
5
OROlHIRY PORlUW CLMW P 4 5 X WIC 111 IS'C C b R-
-
WEN-DRIED-
-
SOLVENT-REPLACED R, THRESHOLD RADIUS-
-
-
u 0-.
. ' " ' I"
l o 1 I o2 10' I o4 PORE RADIUS, iFigure 4 Typical Hg porosimetry results for ovendried and solvent replaced ordinary portland cement paste (151 . .
BLENDED CEMENT PASTE WIS
.
0.d7. 3sec CURE-
-
WEN-DRIED- -
SOLVENT-REPLACED Figure 5 TypicalHg pomsimetry results for ovendried and solvent replaced blended cement Paste I1 51 10' PORE RADIUS. i 0 1st I N T R U S I O N 2nd I N T R U S I O N D E R I V A T I V I
Figure 6
.
Hg intrusion and derivative for fly ash and cement blend hydrated for 2 years at 35°C [16]This technique Is well known and gives a measure of both porosity and pore- size distribution of hydrated portland cement. However, like most techniques, drying of the specimen is necessary in order to make a measurement. Marsh et al. (1 57 have measured pore-size distribution for propan-2-01 dried specimens and spec~mens dried directly in an oven at 10S°C. The results for ordinary portland cement and a tty ash blend are presented in Figures 4 and 5 respectively, for the two drying procedures. For the ordinary cement, after two months hydration there is a reduced slope for oven-dried specimens below 80
A
pore radius; but overall, the distribution curves are not significantly different. However, for the one day non- blended speamens and the fly ash blends, there are large differences as there are for the threshold diameters, Rt in Figure 5.The effect of the mercury intrusion pmcess on the microstructure has been investigated (161. Specimens that had been intruded with mercuv were reintruded. This was performed by removing the mercury by extended distillation. The
repeated intrusion showed that in most samples of the plain portland cement
paste,
the pore-size distribution did not change much, but for all the blends major differences occurred. The results shown in Figure 6 display a change in character of the curve from convex to concave to the pore diameter axis, and an intrusion threshold at a much higher pore diameter. This was explained [16] on the basis that the hydrated blended cement pore structure is made up of relatively large but discontinuous thin-walled pores. During mercury intrusion, these pores were disrupted at high pressure and subsequently intruded by
Hg.
These pores are filled at much lower pressures during reintrusion.The work of Day 151 presented in Table I illustrates the effect of disruption. For normal pastes, the mercury porosity is similar to the alcohol porosity, but for the
fly ash blend, the mercury porosity is considerably greater, despite the small size of the alcohol molecule.
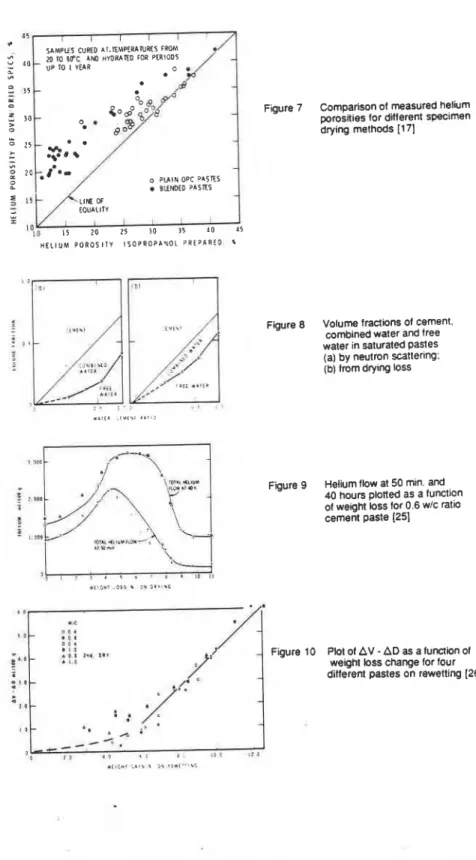
The harsher technique of direct oven drying migM result, in some instances, In the same damage that occurs during mercury intrusion. This was shown by Marsh and Day [I
7 .
They compared helium porosities for ordinary or blended portland cement pastes dried by direct oven heating and by propan-2-01 treatment. Results in Figure 7 show that higher porosities are obtained for rhe blends by the direct oven-drying technique, whereas for ordinary cement paste the poroslty values are fairly similar.Roy and Parker [la] prepared specimsns of Type I1 cement and 60:40 blend of slag with the cement. They dried them by three different methods: freeze-dried, vacuum dried at 80°C for 2 hours and dried with acetone followed by room temperature vacuum drying. The three methods were reported to show little difference in the pore structures when determined by Hg porosimetry. The critical radius (radius at maximum dVIdP) of a cement paste was shown to correspond with the microstructure of the material. They found it possible to resolve the critical radius with the scanning electron microscope and it was about the average distance between fibres.
Midgley and lllston [I91 dried pastes for mercury intrusion measurements in vacuum at 105OC and for electron microscopy by solvent replacement with ether. Comparisons made of pore radii by these techniques found surprising equivalence of pores above 100 A radius, suggesting that different drying techniques may mainly affect pores less than 100 A radius. More research is needed on the 'relationship between the change in the micro pores with a given drying technique
Neutron inelastic scattering is sensitive to the mobility of atomic nuclei, especially those of hydrogen. Thus a bound molecule may be distinguished readily from a mobile one. This is very important since a pore volume
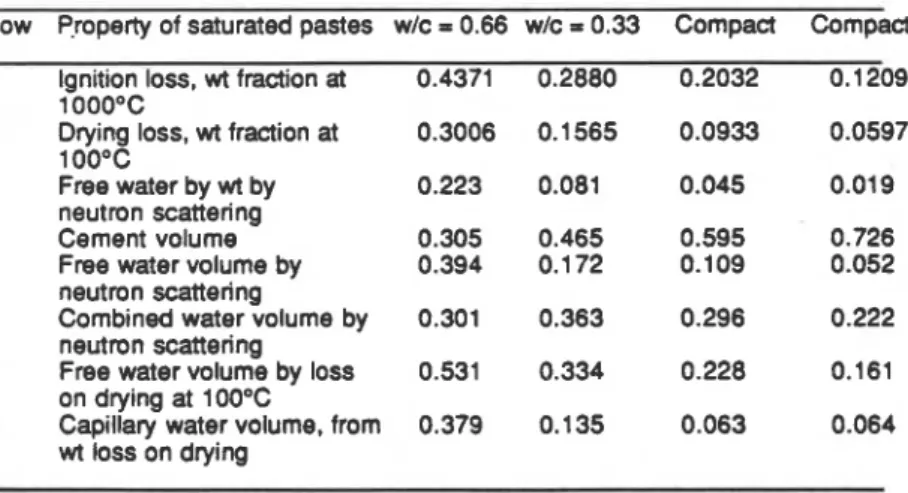
determination on a specimen of hydrated portland cement paste may be carried out without drying it. Table Ill contains a summary of experimental measurements on four saturated cement samples. approximately two years old [20].
Table Ill
-
Estimation of free and combined water by neutron scattering and conventional methodsRow Property of saturated pastes wlc = 0.66 wlc = 0.33 Compact Compact 1 Ignition loss, wt fraction at 0.4371 0.2880 0.2032 0.1209
1 OOO0C
2 Drying loss, wt fraction at 0.3006 0.1565 0.0933 0.0597
1
oo0c
3 Free water by wt by 0.223 0.081 0.045 0.019
neutron scattering
4 Cement volume 0.305 0.465 0.595 0.726
5 Free water volume by 0.394 0.172 0.109 0.052
neutron scattering
6 Combined water volume by 0.301 0.363 0.296 0.222
neutron scattering
7 Free water volume by loss 0.531 0.334 0.228 0.161
on drying at 100°C
8 Capillary water volume, from 0.379 0.135 0.063 0.064
wt loss on drying
The weiaht loss bv drvina at 100°C and bv evacuation at room temwrature are consistehly greater than-the free water calculated from neutron s&ttering measurements on the saturated oastes (rows 2 and 3 resoectivehr). This can be explained if it is assumed that some conibined water is removed &ring drying. The volume fraction of free water calculated from the neutron scattering estimate of free water is approximately equal to the calculated capillary water content (rows 5 and 8). Other data [20] have shown that this capillary volume is approximately equal to the total pore volume available to liquid nitrogen in pre-dried pastes.
Thus, the free water volume determined by drying at 100°C is much higher than that by neutron scattering (rows 7 and 5 respectively). The overestimate of free water by conventional methods of drying is shown in Figure 8.
This technique may
be
used for specimens in a saturated state. Its application is based on the dependence of the exact resonance frequency upon the local magnetic field. Thus each proton in a material is in a net magnetic field slightly different from that due to a large magnet, and its resonance frequency differs from that of an isolated proton. Consequently, the absorption spectrum of a'5 , I I I I . SAMPUS CURED AT.TEMPERARIRES FROM
" 20 TO 8bC, AND HYDRAIID FOR PERIODS
- UP TO 1 YEAR
.A
.
-v'<
=
a
Figure 7 Comparison of measured helium poroslies for diferent specimen drying methods [I 71
-
o PLAIN OPC P A S K S SLLNDED PASTES -
H E L I U M P O R O S I T Y I S O P R O P A N O L P R E P A R E D I
water in saturated pastes (a) by neutron scattering:
4.111 (b) from dry~ng loss
: .
j . , sFigure 9 Helium flow at 50 min. and
40 hours plotted as a function of weight loss for 0.6 w/c ratio cement paste (251 I I .I< 3 " - 3 0 . . O I r 4 , . I )
.
,
II.. I*.
/* Figure 10 P!OI of AV-
ADas a ~IJ~I&I~ of
s g O -
. 1 , 0/.'
weight loss change for four different pastes on rewetting [26]- I t -
-
I I -. .
-
-
1 v -.
1 3'---<.
,:
4 3.,
9 I, 1 I f I .,,i*r :.<r,
3" .t.f" * Cmaterial depends on the environment of the protons in the sample, and thus it indicates the mobility or state of binding. In the measurement of Tp! when the radiation is withdrawn, a tightly bound proton in a crystal lattice reacts much more strongly to the local restoring forces, than a more freely moving proton as a component of a liquid. This is manifested by a smaller T2, the time constant.
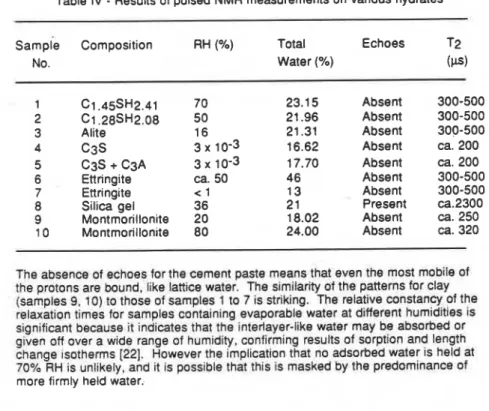
Measurements have been made on a variety of materials related to hydrated cement ie. silica gel and montmorillonite. Pulsed NMR results in Table 4 show the absence of echoes for pastes, samples 1 and 2 (up to 70% RH) in contrast to the presence of echoes for silica gel at a much lower humidity (211.
Table IV
-
Results of pulsed NMR measurements on various hydratesSample Composition RH (%) Total Echoes T2
No. Water (%) (F) C1.45SH2.41 C1.28SH2.08 Alite c 3 s C3S
+
C3A Ettringite Ettringite Silica gel Montmorillonite Montmorillonite 70 50 16 3 x 10⁻³ 3 x 10⁻³ ca. 50 < 1 36 20 80 Absent Absent Absent Absent Absent Absent Absent Present Absent Absent 300-500 300-500 300-500 ca. 200 ca. 200 300-500 300-500 ca.2300 ca. 250ca.
320The absence of echoes for the cement paste means that even the most mobile of the protons are bound, like lattice water. The similarity of the patterns for clay (samples 9, 10) to those of samples 1 to 7 is striking. The relative constancy of the relaxation times for samples containing evaporable water at different humidities is significant because it indicates that the interlayer-like water may be absorbed or given off over a wide range of humidity, confirming results of sorption and length change ~sotherms [22]. However the ~mplication that no adsorbed water IS held at
70% RH is unlikely, and it is possible that this Is masked by the predominance of more firmly held water.
This technique has demonstrated that some evaporable water is entrenched between sheets in the cement paste.
Winslow and Diamond [23] applied the low-angle x-ray technique to reference materials illite clay and activated charcoal and found similar surface areas to those found by Np-adsorption and water adsorption methods. This technique like the previous two discussed, can be performed on undried specimens, so is of special significance for hydrated portland cement.
The measured surface area of a series of portland cement pastes, hydrated to 86% at a w/c ratio of 0.4 are given i n Table 5. These areas are based on the
ignited weight, but if based on a gram of D-dried paste, the areas would be reduced by 209'0. It is apparent that the unsaturated specimens yield areas about 3.5 times higher than those of D-dried specimens. The surface area decreases further with increased severity of drying.
Table V
-
Surface areas (m21g) of 86% hydrated cement pastes at wlc = 0.4 [23]After preliminary treatment After resaturation
Treatment of
Sample 1 2 3 Av. 1 2 3 Av.,
Saturated 682 692 747 708 682 696 747 708 Equilibrated at 324 331 335 330 52% RH P-dried 261 268 288 272 694 700 697 D-dried 214 218 240 224 674 701 747 707 Oven dried, 168 177 195 180 664 602 688 651 1 0s0c Vacuum-oven 132 138 145 138 655 682 629 655
On resaturation, all the specimens recovered most, if not all their surface area, indicating that the phenomen occurring during drying with regard to the measurement of the total surface area are reversible. These results suggest that the surface area of the saturated paste (after correction for Ca(OH)2) is similar to the total surface (internal and external) estimated from structural considerations for
tobermorite gel [24j. This includes the surface area between every sheet separated
by interlayer water, and it is apparent that low-angle scattering can register interfaces that are only 3 and 4
A
apart. The reversibility of the high surface area of the dry state is undoubtedly due to re-penetration of water between the sheets assuggested by scanning isotherms of water adsorption [22]. Low-angle x-ray
scattering results thus indicate that a considerable poftion of the evaporable water is held between closely separated sheets, and that the water is able to re-open the sheets from a collapsed state.
flow
technlaue
This technique involves the normal pycnometric measurement of the solid
volume of a body when helium surrounding the body is compressed to 2 atm.
Immediately after this compression period, the rate at which helium penetrates the body under an absolute pressure of 2 atm is measured for a period of 40 hours [25].
The helium flow technique is capable of following changes to the solid structure during removal of water from at least 1 1 % RH to the Ddry condition.
Stepby-step removal of water from 11% RH condition is followed by
measuring an individual kinetic curve of helium inflow at each step. These curves are functions of the volume of vacated space and the size of the entrances. Collapse of the spaces or the entrances are indicated by a decrease in helium inflow rate. The effect of the withdrawal of water may be more clearly observed in Figure 9. The total inflow after abwt 99'0 moisture is withdrawn is less than that at the initial 11% condition, mainly because there is an abrupt reduction in inflow over a very low weight loss range. This is due to an abrupt (though incomplete) collapse
of the interlayer spaces at this stage of drying.
Removal of interlayer water leads to a change in solid volume (AV) and to a change in total helium inflow (AD). Solid volume includes interlayer spaces into which helium does not enter during the initial period of exposure to helium gas and its compression during the beginning of the experiments. When part of the vacated interlayer space has collapsed, resulting in a change in solid volume and helium inflow, an assessment of the space occupied by the water molecules can be made
by combining these parameters. Thus a parameter AV
-
AD is obtained. Anestimate of 1.20 glcm3 density for the interlayer was made from results obtained from these experiments.
Evidence presented earlier has shown that when strongly dried hydrated porttand cement is exposed to water vapour, water molecules re-enter between the sheets; if the material is exposed to high humidities, more water m019CuleS re-enter the structure. This can be confirmed by exposing the material to vanous humidities. Helium ftow increases with water re-entry and as interlayer spaces become filled,
helium inflow decreases. The AV
-
AD versus weight change plot for re-exposureto water vapour is presented in Figure 10 [26]. It records an increase, in AV
-
AD of only 1.75 cm31100 g of sample for a weight gain of up to 6.0% which occurs on exposure up to 42% RH and returning to 11% RH. Helium, up to this point, does not measure the volume of water that has entered the structure. Beyond 42% RH and 6.0% weight gain. the plot is linear, and helium now fully enters the StIUCtUre and measures the volume of water in the interlayer together with any remaining space. The value for the density of the water is again approximately 1.20 glmL. These results are in agreement with those obtained from low-angle x-ray scattering; regeneration of the very high surface area on rewetting, which is drastically reduced on D-drying indicates that water re-enters and re-opens the structure. Both these techniques show that a large portion of the evaporable water resides between the sheets.HYDRAULIC RADIUS
The hydraulic radius of a pore system is computed by dividing the total pore volume of the system by its total surface area. For hydrated portland cement prepared at wlc = 0.4, 0.6 and 0.8 the hydraulic radius was computed to be 39.4,
64.2 and 107.0
A
respectively. The pore volume of the Ddried paste wasdetermined by helium pycno;neter and the surface area by both nitrogen adsomtion and the helium inflow techniaue 161. This hydraulic radius thus represents the pore system excluding th'e ir&rlayer space.
(ii)
6
I
Hydraulic radius calculation for the interlayer space requires the surface
I area of the interlayer space and the corresponding volume. The low angle x-ray
scattering data provides a value for the surface area in the wet state. In a D-dried
I paste, the interlayer space is re-opened by exposure to 42% RH; at this condition,
helium can fully enter the interlayer space within 40 hours flow time so the volume of the interlayer space can be measured in the partially open or fully opened state.
RH, the helium pycnometric method gives a value of 1.35% water for the monolayer on the external surface of the Ddried material (corresponding to a 49 m21g surface area). On drying to 11 70 RH this sample retains 10.8% water [27. Thus, 10.8
-
1.35= 9.45% is retained in the interlayer structure. An occupied space of 2.4 cm~t100 g
was measured in the interlayer structure by helium inflow. Using 1.20 g / m 3 as the density of the water results in a volume of 10.28 cm3 as the internal space. The surface area of the total space is 670 m2Ig [23] resulting in a value of 670
-
49 =627 mz/g for the interlayer surface. and a hydraulic radius of 1.65
A.
Assuming that the spaces are bounded by 2 parallel plates, the average separation of the plates is 2 x 1.65A
= 3.3A.
This model is consistent with the internal system composed of layers separated by, on average, one water molecule at 11 % RH.The impact of this calculation on surface area may be shown by another simple calculation. If 9.45% of water is held as a single layer between two sheets, it will cover twice the normal area per molecule, ie. 10.8 x 2 A2 (0.216 n . m2). This results in a surface area of 687.2 m21g compared with 621 m21g given by low angle scattering. It is probable that more than one water molecule may be held between sheets in certain locations, making this calculation a good estimate.
. .
..
(iii) Fffect of on the h
-I The helium intake versus time curve at'a weight loss of 7.0% relative to the
11 % RH condition is presented in Figure 1 1 (81. Results are shown for samples under compressive stresses of 0, 7.1, 14.8 and 22.8 MPa. At 14.8 MPa the volume of helium intake atter 40 hours is reduced by almost 48% compared to that for the sample at no load. However at a load of 22.8 MPa a slight increase in helium intake takes place. The effect of stress on helium intake varies with the moisture content. At higher moisture losses the effect is generally greater; and generally the phenomenon is compatible with an interlayer model for pares: at the 11% RH
condition (zero moisture loss) there is little change in helium intake under applied stress since the spaces are largely occupied by water. As water is removed tfOm the interlayer space w~thout major collapse of the layered structure, the vacated space can be filled with helium. Applied stress can reduce the size of the entrances to the water vacated spaces and possibly lengthen them by bringing Surfaces at the entrances closer together, thereby reducing the rate of entry of helium. This effect reaches its maxlrnum at around 7?/0 weight loss and at moisture losses greater than 7% the difference between the stressed and unstressed Sample decreases abruptly since removal of water alone without application of Stress reduces the entrance size of the intertayer space.
It is impossible to account for the 48% reduction in helium intake by
assuming a simple fixed dimension cylindrical pore. But if local strains at the ends of layers are cons~dered to be derived from the partial collapse of water-vacated interlayer space, it can be understood how applied stress can Cause constriction of the entrances and reduct~on in helium intake of the magnitude observed in these experiments.
The dynamic methods of differential thermal analysis (DTA) and thermo-
gravimetric analysis are applied quite commonly in cement chemistry. The paste
I
systems comprising crystalline and ill-crystalline compounds contain different types of water which can be detected by thermal analysis. The techniques have beenused to distinguish interlayer from adsorbed water.
In a study of the state of water of bottle hydrated C3S [28], a procedure of conditioning was followed. Preparation A (stock material) is a hydrated material dried to 1
lqo
RH; preparation 8 is the D-dned sample A, and preparation C, the stock material conditioned to 100% RH. Each of these preparations was divided into small portions, and one portion (two portions for prepaiation B) placed in each of several desiccators conditioned at l l , 3 2 , 42,58,66,84 and 100% RH. One of the portions of preparation B was removed from each desiccator and placed in 11 %RH. The condition period at each humidity was two months.
Water content levels were determined for specimens by static heating in a vacuum at 1 OO°C. These results are plotted in Figure 12. Hysteresis and scanning loops are prominent and similar to those usually observed for water adsorption isotherms on hydrated portland cement [22]. DTA thermograms for preparation B (but for portland cement) equilibrated at various humidities to 100% RH are presented in Figure 13 (291. Two endothermic peaks, with peak temperatures varying in the range 65-80 and 90-105°C occur and grow simultaneously with increasing humidity. Preparation B series B(R) (all redried to 11% RH) shows clearly how 11% RH on the sorption isotherm is not a uniquely defined point as shown also by the scanning loops. The 90-105°C peak grows larger as the relative humidity to which the sample was exposed increases. The 65-80°C peak, on the other hand, is always reduced to a very small size on return to 11 % RH. It is evident that interlayer water re-enters D-dried hydrated C3S and hydrated portland cement paste throughout exposure from 0 to 100%RH.
CONCLUSIONS
Water plays a major role in influencing behaviour and performance of concrete and thus has an important role in determining the nature of hydrated cement paste. A large part of the water in hydrated portland cement exists between the interlayer sheets.
Both nuclear magnetic resonance and inelastic neutron scattering show that the mobility of a large part of the water in cement paste is restricted with respect to physically adsorbed water and therefore this water is similar to the interlayer water in clays. Measurements of Young's modulus reveal that interlayer water and some organic solvents behave as a solid, increasing the rigidity of the layered structure.
Helium inflow techniques and low-anole x-ray scattering methods permit determination of the surface area and hydraulic radius of the interlayer spaces. Both techniaues illustrate that when water is removed the structure colla~ses and when the water is re-introduced the structure expands. The interlayer water should thus not be regarded as pore water and interlayer spaces should not be regarded as part of the pore structure.
Organic solvents enter the interlayer structure during solvent replacement and may also expand and influence the structure in other ways.
In many instances initial drying by rapid evacuation of thin samples and final drying by moderate heat may be adequate for an estimate of pore volume and structure, but the volume of pores under 100
A
radius is altered by this technique. Mercury intrusion porosimetry in many instances may cause damage to the porous structure but in other instances may be an adequate method.REFERENCES
1. R.F. Feldman, Cem. Technol. 3, 5 (1 972).
2. R.F. Feldman. Highway Research Record. S!Q, 8 (1 971 ).
3. L.J. Parrott, Cem. Concr. Res. 11,651 (1981 ).
4. L.J. Parrott, Cem. Concr. Res.
s,
18 (1 983).5. R.L. Day and B.K. Marsh, Cem. Concr. Res.
U,
18 (1988). 6. R.F. Feldman, Cem. Concr. Res.u,
657 (1 980).7. V.S. Ramachandran. R.F. Feldman and J.J. Beaudoin, Concrete Science
-
A treatise on current research 1st edition. Heyden Press, London, 9 (1981). 8. R.F. Feldman and J.J. Beaudoin, Cem. Concr. Res.u,
470 (1 983). 9. R.F. Feldman and Huang Cheng-yi, Cem. Concr. Res.s,
765 (1985). 10. R.F. .Feldman, unpublished results.1 1 . R.F. Feldman, unpublished results.
12. R. Day, Cem. Concr. Res.
U,
841 (1981). 13. J.J. Beaudoin, Mats. & Struc.a,
27 (1 987). 14. R.F. Feldman, Cem. Concr. Res. 12,602 (1987).15. B.K. Marsh, R.L. Day, D.G. Bonnes and J.M. Illston, RlLEM Symposium on Principles and Applications of Pore Structural Characterization, Milan (1983). 16. R.F. Feldman, J. Amer. Ceram. Soc.
62
(1 ), 30 (1 984).17. B.K. Marsh and R.L. Day, Mat. Res. Soc. Symposium Proc. "Very High Strength Cement-based Materials,
42
(I), 113 (1985).18. D.M. Roy and K.M. Parker, Proc. of 1 st Int. Conf. on the Use of Fly-ash, Silica Fume, Slag and Other Mineral By-Products in Concrete, A.C.F. SP 79,1, 397 (1 983).
19. H.G. Midgley and J.M. Illston. Cem. Concr. Res.
fi
197 (1983). 20. D. Harris, C. Windsor and C. Lawrence, Mag. Concr. Res. a , 6 5 (1974). 21. P. Seligman. J. Res. Dev. Lab. Portland Cement Assoc.14.
52 (1 968). 22. R.F. Feldman, Intern. Symp. on the Chemistry of Cement3,
53 (1968). 23. D.N. Winslow and S.J. Diamond, Amer. Ceram. Soc.z,
193 (1 974). 24.S.
Brunauer, D.L. Kantro and L.E. Copeland, J. Amer. Chem. Soc.a,
123(1 958).
25. R.F. Feldman, Cem. Concr. Res. 1,285 (1 971). 26. R.F. Feldman, Cem. Concr. Res.
4,
1 (1973). 27. R.F. Feldman, Cem. Concr. Res. 3,777 (1 973).28. R.F. Feldman and V.S. Ramachandran, Cem. Concr. Res. 4,155 (1974). 29. R.F. Feldman and V.S. Ramachandran. Cem. Concr. Res. 1.607 (1971).
![Table II - Young's Modulus of Water-Saturated and Solvent Exchanged Paste (W/C = 0.8) kglcm2 x 104 [i 0]](https://thumb-eu.123doks.com/thumbv2/123doknet/14273844.490695/7.595.36.523.123.677/table-young-modulus-water-saturated-solvent-exchanged-paste.webp)
![Figure 6 . Hg intrusion and derivative for fly ash and cement blend hydrated for 2 years at 35°C [16]](https://thumb-eu.123doks.com/thumbv2/123doknet/14273844.490695/8.590.62.498.107.823/figure-hg-intrusion-derivative-cement-blend-hydrated-years.webp)
![Table V - Surface areas (m21g) of 86% hydrated cement pastes at wlc = 0.4 [23]](https://thumb-eu.123doks.com/thumbv2/123doknet/14273844.490695/13.590.66.547.200.403/table-v-surface-areas-hydrated-cement-pastes-wlc.webp)
