Publisher’s version / Version de l'éditeur:
Journal of the Illuminating Engineering Society, 22, 1, pp. 113-121, 1993
READ THESE TERMS AND CONDITIONS CAREFULLY BEFORE USING THIS WEBSITE. https://nrc-publications.canada.ca/eng/copyright
Vous avez des questions? Nous pouvons vous aider. Pour communiquer directement avec un auteur, consultez la première page de la revue dans laquelle son article a été publié afin de trouver ses coordonnées. Si vous n’arrivez pas à les repérer, communiquez avec nous à PublicationsArchive-ArchivesPublications@nrc-cnrc.gc.ca.
Questions? Contact the NRC Publications Archive team at
PublicationsArchive-ArchivesPublications@nrc-cnrc.gc.ca. If you wish to email the authors directly, please see the first page of the publication for their contact information.
NRC Publications Archive
Archives des publications du CNRC
This publication could be one of several versions: author’s original, accepted manuscript or the publisher’s version. / La version de cette publication peut être l’une des suivantes : la version prépublication de l’auteur, la version acceptée du manuscrit ou la version de l’éditeur.
Access and use of this website and the material on it are subject to the Terms and Conditions set forth at
The dilemma of emergency lighting: theory vs. reality
Ouellette, M. J.; Tansley, B. W.; Pasini, I. C.
https://publications-cnrc.canada.ca/fra/droits
L’accès à ce site Web et l’utilisation de son contenu sont assujettis aux conditions présentées dans le site LISEZ CES CONDITIONS ATTENTIVEMENT AVANT D’UTILISER CE SITE WEB.
NRC Publications Record / Notice d'Archives des publications de CNRC:
https://nrc-publications.canada.ca/eng/view/object/?id=48fffe84-e8d9-4d48-a37b-0d206cabe07c https://publications-cnrc.canada.ca/fra/voir/objet/?id=48fffe84-e8d9-4d48-a37b-0d206cabe07cT he dile m m a of e m e rge nc y light ing: t he ory vs. re a lit y
N R C C - 3 3 1 1 3
O u e l l e t t e , M . J . ; T a n s l e y , B . W . ; P a s i n i , I . C .
A u g u s t 1 9 9 3
A version of this document is published in / Une version de ce document se trouve dans:
Journal of the Illuminating Engineering Society, 22, (1), pp. 113-121, 93
http://www.nrc-cnrc.gc.ca/irc
The material in this document is covered by the provisions of the Copyright Act, by Canadian laws, policies, regulations and international agreements. Such provisions serve to identify the information source and, in specific instances, to prohibit reproduction of materials without written permission. For more information visit http://laws.justice.gc.ca/en/showtdm/cs/C-42
Les renseignements dans ce document sont protégés par la Loi sur le droit d'auteur, par les lois, les politiques et les règlements du Canada et des accords internationaux. Ces dispositions permettent d'identifier la source de l'information et, dans certains cas, d'interdire la copie de documents sans permission écrite. Pour obtenir de plus amples renseignements : http://lois.justice.gc.ca/fr/showtdm/cs/C-42
···
113
The Dilemma of Emergency Lighting:
Theory vs Reality
MJ. Ouellette (1), B.W. Tansley (2), and I. Pasini (3)
Introduction
One of the greatest responsibilities of building maintenance is the safety of occupants. There must always be enough illumination to enable orderly, accident-free evacuation from buildings. Webber/ then Ouellette and Rea2 consolidated several studies
from around the world3
-6 that show that under re· duced emergency lighting, performance is reduced and evacuees move more hesitantly and slowly.3 For example, at a mean of 0.16 lx, Boyce3 observed hesi· tant movement and collisions with furniture, jeopar-dizing the efficiency and possibly the safety of building evacuation. At yet lower levels of illumina-tion, Boyce3 observed confusion, reversals in direc· tion of movement, and dependence upon tactile cues for wayfmding.
North American occupation, building, and fire codes and standards provide specifications for emergency Ughting practice and maintenance. Cana-dian Occupational Safety a nd Health (COSH) regula· tions/ for example, specify that principal exit routes and other designated spaces require a mean* lighting level of at least 10 lx, as determined "by making four measurements at different places representative of the level of lighting 1 m above the floor of the area and; by dividing the aggregate of the result of those measurements by four:• Additionally, COSH regula· tions specify that in buildings constructed after Oc-tober 31, 1990, no point in the designated spaces shall be illuminated at less thaq..0.25 lx. The 1990 National Building Code of Canada 8 recommends that
prin-cipal exit routes and other designated spaces should have no less than 10 lx of emergency lighting on average at floor level. The US National Fire Protection Association also calls for 10 lx of emergency illumina-tion.9 The National Fire Code of Canada10 provides guidance on the maintenance and testing of
emergen-cy lighting equipment. Where emergenemergen-cy lighting is
powered by backup generator, it recommends that the generators be tested monthly and that a log of test results be maintained. Likewise, it recommends that
*The word mean in this paper refers to arithmentic mean, the most
com-mon and often misleading type of average. The word average is a generic term for any of arithmetic mean, セッュ・エイゥ」@ mean, harmonic mean, mode, and median---GU different estimators of central tendency.
Authors' affiliations: 1. National Research cッオョ」ゥセ@ Ottawa, Ontario, Canada. 2. Brian W. Tansley and Associates, Manotick, Ontario, Canada. J. Public Works Canada, Ottawa, . Ontario, Canada.
THIS PAPER IS AN IESNA TRANSACTION. IT WAS ORIGINALLY PRESENTED AT THE 1992 IESNA ANNUAL CONFERENCE.
individual battery·powered units shou ld be tested on a regular basis. The IESNA11 now recommends no less than an average of 5 lx along the centerlines of the floors of principal exit routes and designated spaces. It is anticipated12 that the next edition of the
IES Lighting Handbook will recommend no less than 10 lx on average, with no point less than 0.5 lx, and with a uniformity ratio (Emean to Em;n) not to exceed 100 to one.
Thus, in North America, recommendations seem to converge on an average level of 10 lx. But how com-mon is 10 lx in practice? How meaningful is it, and how practical is it to measure? Most importantly, how suitable are these regulations, standards, and recom-mendations for specifying an intended minimal level of safety in buildings? This paper presents the results and conclusions drawn from a comprehensive survey conducted in seven randomly selected buildings in Ottawa, Ontario, Canada, in an attempt to answer these questions.
Sample size effect
Foremost, it was necessary to determine the number of measurements needed to obtain a reasonable degree of confidence in the calculated mean
il-ャオュゥョ。ョ」セウN@ Pilot work revealed the following
statistics for the floor of a typical evacuation route il· luminated by two-lamp, 4-ft, recessed, overhead, fluorescent troffers on 45-ft centers: mean (Emean)
=
6.47 lx, and standard deviation (SD)=
6.39 lx. If the illuminances were distributed normally, then the per-cent critical significant difference, d, for Emean would have been13d
=
100 2 SDat the 95 percent confidence level (i.e., 19 times out of 20). For the n
=
58 measurements in the given space, d is 26 percent. Thus, one could expectEm••n
to be accurate to within 26 percent, 19 Limes out of20. Thble I displays values of d for other sample sizes, n. More than 1500 measurements were required to obtain an accuracy within 5 percent, 19 times out of 20. One should not treat these findings in a strict quantitative manner, however, because the observed illuminance measurements were not distributed normally. Skewed distributions of the type observed would require evenJiijf
.u. •'1 I" I ,::( ''·I ;: セ@'
, I , I114
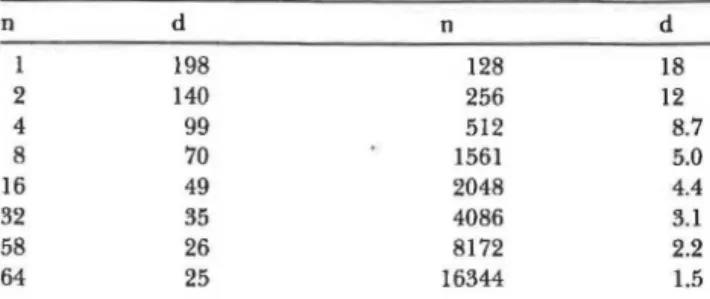
Table 1-Effect of sample size (n) on accuracy represented as percent significant difference (d)
n d n d 1 198 128 18 2 140 256 12 4 99 512 8.7 8 70 1561 5.0 16 49 2048 4.4 32 35 4086 3.1 58 26 8172 2.2 64 25 16344 1.5
more measurements to obtain the same level of con-fidence in the mean. Nevertheless, the findings rein-forced the need to collect a very large number of measurements. Most certainly, a random sample of size n
=
4, as specified in the COSH regulation,7 could not provide an accurate estimation of mean il-luminance in spaces comparable to the one described in this example. In the present survey, 4540 measurements were collected in an unbiased manner within the 7 buildings sampled.The buildings
Building 1 is a three-story building constructed in the 1970s. It has offices along the periphery and laboratory facilities within the central core. The offices are illuminated by a combination of day-light and ceiling· mounted fluorescent fixtures. The in· ner core doesn't require emergency lighting be-cause of its simplicity and smallness. Emergency lighting is provided primarily in the corridors, stairwells, and washrooms by ceiling-recessed fluores-cent 1-by-4-ft fixtures.
Building 2 is a 25·yr-old high-rise tower. The layout of each floor surveyed was similar, consisting of a cen-tral core of elevators, opening to a cencen-tral foyer, leading through short access hallways to the sur-rounding open-plan office space reaching to the building periphery. On some floors private offices were found in parts of the open-plan space, typically located on an outer wall. On all floors the corridors or walkways in the open-plan areas that would serve as emergency exit routes were defined by portable office dividers. Emergency lighting in this building con-sisted of a subset of the l·by-4-ft ceiling-recessed fluorescent fixtures used during regular operations. An exception was the cafeteria, a place of employee congregation, which had a combination of U-tube fluorescent lamps and mercury halide lamps in surface-mounted fixtures.
Building 3, a high-rise tower, was built in 1975 and consisted mostly of offices designed on open-plan grids leading from a central elevator core. Emergency lighting consisted of ceiling-mounted fluorescent luminaires spaced in a rectangular array. Principal
ex-Winter 1993 JOURNAL of the Illuminating Engineering Society
•···••···•···••···•·•••••···••··••··•·•
. it routes in the open·plan areas were defined by portable office dividers.
Building 4 is similar to Building 3 except that it was built in 1978. Floor spaces varies; the lower floors are substantially greater than those higher up.
Buildings 5 and 6, office towers constructed in 1978, have impressive architectural features includ-ing large atria, which provide daylight to elevator foyer areas and pedestrian walkways in publicly ac-cessible spaces. Surface-mounted luminaires doubled as emergency lighting in the elevator foyers. The rest of these buildings are primarily open-plan offices with emergency lighting consisting of recessed fluorescent luminaires arranged in a manner simi-lar to Building 2.
Building 7 is 33 yrs old and comprises five inter-connected buildings ranging from five to seven stories in height. It houses a mixture of open-plan and private offices. Its hallways are spacious and con-tained few obstructions.
Emergency lighting in all buildings was powered by central backup generators, except for Building 7. Building 7 was equipped with dual-head, wall-mounted, incandescent floodlights powered by local rechargeable batteries.
Procedure
The buildings were all surveyed at night. Three of them (2, 5, and 6) were studied during complete building power shutdowns with emergency lighting powered by central generators. In Buildings 1, 3, and 4 normal lighting circuits were switched off by maintenance personnel floor by floor to simulate power failure. Battery-powered units in Building 7 were evaluated by shutting off electrical circuits within the area under study and completing il-luminance measurements within 20 min.
Both visual inspection and illuminance measurements were performed. Three general features of the emergency lighting were assessed dur-ing visual inspection:
1. the fit of the ceiling luminaire plan to the floor plan, including emergency routes and furn -iture layout
2. the logic of the emergency route layout, including the prevalence and visibility of obstructions
3. the level of maintenance of the emergency lighting system as evidenced by the ease by which building operators could locate and identify the emergency lighting, the number of luminaires in need of service, and the area of evacuation routes where no emergency lighting was operational
In multistory buildings, visual inspection identified floors that appeared typical of the entire building.
...•...••...•..•
These floors were targeted for illuminance survey. Illuminance surveys in the targeted floors exhaustively* covered areas identified in Part 6.10 of the COSH regulations: "(a) exits and corridors; (b) principal routes providing access to exits in open floor areas; and (c) floor areas where employees nor· mally congregate:' Horizontal illuminance was measured photopically at 1 m above the floor along the centerline of the evacuation routes at 1-m inter· vals. Care was taken to avoid shadowing the il-luminance meter speciously. Measurements along level surfaces were collected with a Topcon Model IM-3 illuminance meter. Stairwells were sampled us-ing a Hagner model EC1-ES illuminance meter. Both instruments were cosine corrected and had been recently calibrated. In many floors, there were numerous areas where emergency illumination was below the limits of sensitivity of the illuminance meters (0.1 lx). Values below 0.1 lx were recorded as 0.1. In some local areas where illuminance did not vary by more than approximately 30 percent, data col· lection was expedited by recording, for each 1-m inter· val, the most common illuminance value observed within that local area. While this technique has drawbacks, it increased the amount of data the sur· vey team could collect within the time that the buildings were available.
Additionally, to assess the effects of measurement height, illuminance readings were obtained at both the floor level and at a height of I m at one of the sites. In this way, it was possible to later relate floor level measurements (e.g., as recommended in the National Building Code of Canada8
) to measurements col· lected at 1 m as specified in the COSH regulations.' Results
Visual inspection # ; .
Building 1, the smallest building studied, had good emergency lighting with recessed, ceiling· mounted fixtures centered every 45 ft. No areas were in near darkness, and the survey team had no difficulty maneuvering throughout the exit routes of this building.
Inspection of the office towers (Buildings 2-6) revealed that emergency lighting followed the same design on all floors: typically, eight luminaires were located at the corner of two concentric rectangles, with supplemental emergency lighting in the elevator lobbies and central core areas. This design provided
*One exception is the survey of Building I, which covered only one of the four similarly designed corridors.
**This point became apparent to one member of the survey team who, in spite of precautions, feU over a potted fern whik conducting measurements.
115
noticeably excellent lighting in the central areas, but a severe reduction of emergency lighting the farther one proceeded from the central core.
In a significant number of open-plan areas, discrepancies were found between the emergency luminaire locations on the ceiling and the emergency exit routes on the floor. Changes in the architectural layout and the furniture arrangements likely account for these inconsistencies. Quite commonly, a small private office or conference room enveloped a sole emergency fixture designed to service a much larger floor area. Consequently, emergency lighting was limited to the newly partitioned room while the larger zone remained in near darkness, typically an estimated 10-30 percent of the total floor area.
Wall-mounted battery units were found to be incon-sistently positioned for some open-plan office layouts, probably for similar reasons. High privacy panels in some . open-plan areas severely shaded exit routes from emergency illumination.
Emergency exit signs and exit routes in many of the open-plan areas were inconsistent. In extreme ex· amples, exit signs led to locked doors or cui-de-sacs. Here, the need for security and the need for emergen-cy egress appeared to conflict. In some buildings with complex open-plan layouts, there was no apparent principal exit route. Where one was apparent, it was sometimes overly complex. In some office areas, especially at night, it would be difficult for people to find their way to safety with the emergency lighting systems now in place.**
The building operations and maintenance person· nel were quite aware of the requirements to inspect, test, and maintain emergency generators. Typically, the personnel were not aware of the actual state of maintenance of the emergency luminaires, of the loca-tion of the emergency power panels, and of the ap· propriateness of the present emergency lighting layout. Many of the battery-powered units in Building 7 were connected to general-purpose circuits rather than to lighting circuits. Thus, if lighting failed in· dependently of the general-purpose circuits, the exit routes would not be lighted. There is considerable room for improvement regarding the maintenance of emergency lighting systems for ensuring safety during real emergency situations.
IUuminance measurements
Emergency lighting at all points in stairwells and stair landings consistently exceeded 10 lx, except for Building 7 in which electric emergency ャゥァィエゥセァ@ wa not provided in the stairwells. Emergency illumina· tion was generally at its maximum near the eleva£Or lobbies and central cores of aU buildings; diminishing as distance from the core increased.
JOURNAL of the Illuminating Engineering Society Winter 1993
116
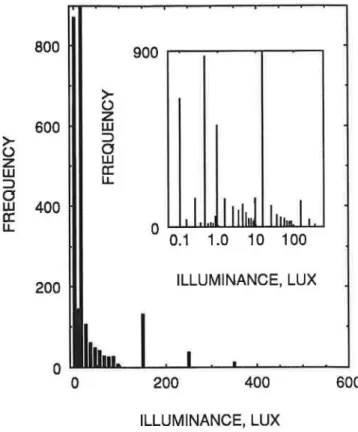
Figure 1 shows that illuminance data are highly skewed and variable. Similar distributions were observed in each surveyed floor of each building. For distributions of this kind where values differ so great· ly among themselves, a mean is paradoxically almost
800
900
セ@ 0z
600
w
>-
:::::> (.) 0z
w
wa:
:::::> LL 0w
400
a:
LL0
0.1
1.0 1 0 1 00
200
ILLUMINANCE, LUX0
0
200
400
600 ILLUMINANCE, LUXFigure 1-Linear and logarithmic (inset) frequency distributions from all buildings combined (n
=
4540)meaningless, 14 and may lead one to the wrong conclusions.
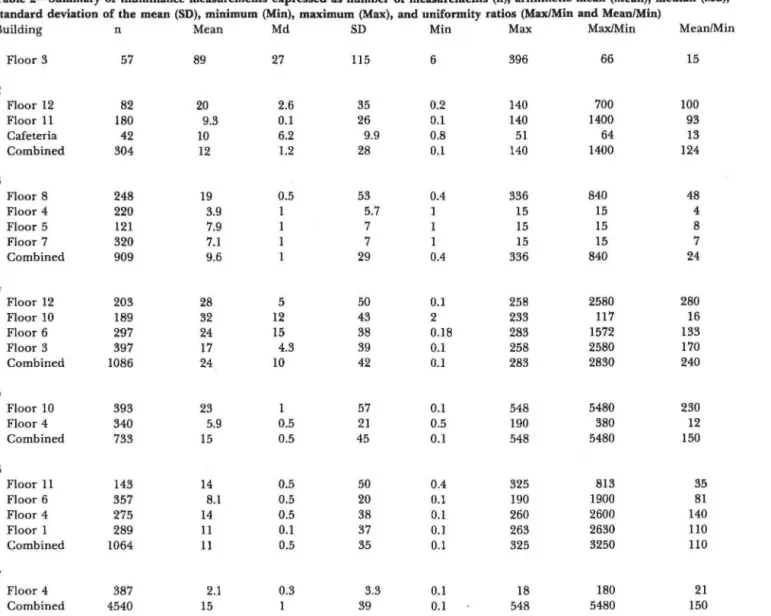
For example, the mean illuminance in six of the seven buildings exceeds or approaches 10 lx (Thble 2). The remaining building provides a mean of only 2.1 lx. These results alone might lead to the conclusion that the emergency lighting systems in most of the buildings performed well. In fact, most of the evacua-tion routes were well below 10 lx, and the mean was strongly influenced by the few brightly illuminated areas near and directly below the sparsely spaced luminaires. From the median of the combined data (Thble 2), exactly half of the measurements were at or below 1.0 lx. Therefore, when surveyed sparsely (e.g., only four random measurements), there is a high probability that the mean would be below 10 lx in these buildings.
Thble 3 represents the proportion of observations within the given illuminance ranges and can be used to predict the probability of any single measurement being within the given ranges. It shows, for example, that 66 percent of the combined measurements were Winter 1993 JOURNAL of the Illuminating Engineering Society
...
below 10 lx. It also shows that 15 percent of the measurements were below the COSH minimum of 0.25 lx for new buildings.
Discussion
The survey reveals several problems with the im-plementation of the current standards and regula-tions. Quite obviously, the presumed intended level of safety was not met in six of the seven buildings. More disturbing, however, is the realization that the buildings' shortcomings are not reflected in the com-prehensive illuminance measurements summarized in Thble 2. The survey demonstrates that we should not assume that the emergency lighting is sufficient simply because it provides a mean illuminance of 10 lx. We should not assume that emergency luminaires are now serving the exit routes simply because they did so at the time a building was commissioned. We should not assume that battery-powered units will start simply because they did so the last time their test buttons were pressed. They might not be trig-gered by lighting circuits. During routine power shut· downs, we should not assume that the exit routes are properly illuminated simply because the diesel generator started.
This survey, then, reveals more about the am-biguities and limitations of current emergency lighting regulations. Perhaps the most serious prob-lem is the futility of attempting to characterize emergency illumination in terms of a small number of "representative" measurements. The reasons for this are threefold.
First, because of the high variability in il-luminances, it is virtually impossible to pick four representative locations without first having ex-haustively sampled the entire space. This is an impor-tant consideration because the resulting mean can be distorted by the inclusion of a disproportionate number of exceptionally bright or exceptionally dark regions. This problem can only be resolved by sampling a very much larger number of points in an unbiased manner.
Second, large variances introduce large uncertain-ties in the accuracy of derived means. As calculated above, a sample size of four can give an uncertainty of 99 percent in the calculated mean illuminance of a typical exit route under emergency lighting.
Third, averaging is not meaningful for the highly skewed distributions typical of emergency lighting. Where the sources of illumination are few, il-luminance measurements tend to distribute by the in-verse square law and do not cluster about a central value. In these cases, arithmetic means can give grossly misleading estimates of central tendency. One solu-tion is to transform the observed data into a
distribu-...
117
fable 2-Summary of illuminance measurements expressed as number of measurements (n), arithmetic mean (Mean), median (Md), ;tandard deviation of the mean (SD), minimum (Min), maximum (Max), and uniformity ratios (Max/Min and Mean/Min)
3uilding n Mean Md SD Min Max Max/Min Mean/Min
l Floor 3 57 89 27 115 6 396 66 15 3 4 5 Floor 12 Floor II Cafeteria Combined Floor 8 Floor 4 Floor 5 Floor 7 Combined Floor I2 Floor IO Floor 6 Floor 3 Combined 82 180 42 304 248 220 I2I 320 909 203 I89 297 397 1086 20 9.3 10 I2 I9 3.9 7.9 7.I 9.6 28 32 24 17 24 2.6 O.I 6.2 1.2 0.5 I 5 I2 I5 4.3 10 35 26 9.9 28 53 5.7 7 7 29 50 43 38 39 42 0.2 0.1 0.8 0.1 0.4 1 0.4 0.1 2 0.18 O.I 0.1 140 140 51 140 336 15 15 15 336 258 233 283 258 283 700 1400 64 1400 840 15 15 15 840 2580 117 1572 2580 2830 IOO 93 I3 I24 48 4 8 7 24 280 16 133 170 240 Floor IO Floor 4 Combined 393 340 733 23 5.9 15 0.5 0.5 57 21 45 0.1 0.5 0.1 548 190 548 5480 380 5480 230 I2 150 6 7 Floor II Floor 6 Floor 4 Floor I Combined Floor 4 Combined 143 357 275 289 I064 387 4540 I4 8.I 14 11 11 2.1 I5 0.5 0.5 0.5 0.1 0.5 0.3
Table 3-Cumulative percent frequencies for the distribution of all illuminance measurements (n=4540)
Illuminance range (lx) 0.1 <0.25 <0.5 <0.6 <I <2 <5 < 10 < 15 <20 <IOO 548
.
,. Cumulative frequency (percent) I4 15 19 38 40 54 59 66 73 88 96 100tion appropriate for description by the arithmetic mean. An alternative solution is to abandon the statistic of mean in favor of one less sensitive to 50 20 38 37 35 0.4 0.1 0.1 0.1 0.1 325 190 260 263 325 8I3 1900 2600 2630 3250 35 8I 140 110 110 3.3 39 0.1 0.1 18 548 180 5480 21 I 50 distribution shape. One such statistic is the median, a more representative measure of central tendency under these circumstances. Another preferred statistic is the one introduced in 6.11(4) of the COSH regulation-the minimum. The Commission Interna· tionale de l'Eclairage,15 the United Kingdom,16
and other countries quantify emergency lighting primari· ly in this manner.
Regarding the question of measurement height, we found that mean illuminance at the 1-m height generally exceeded that at floor level by a factor of 1.2. More important, however, illuminance measure· ments at 1 m were nearly twice as variable as meas-urements collected at floor level. These measmeas-urements are thus more vulnerable to the three problems discussed above. For this reason, measurements at floor level provide more reliable estimates of average illuminance. Regardless, human vision responds to considerably more than average illuminance in a given horizontal plane: we view objects in three JOURNAL of the Illuminating Engineering Society Winter 1993
I
f. I
I '
I I
I I118
dimensions. Therefore, both the vertical and the horizontal components of illumination should be considered when characterizing illuminated en· vironments. This is of particular concern for spaces equipped with wall·mounted incandescent flood luminaires, which project a large portion of their il· lumination onto vertical planes. Resolving this pro· blem is a subject for further research. Emerging im· provements in image photometry and computational modeling offer promising areas of exploration.
Recommendations
It is impossible, from this survey of only seven buildings, to draw conclusions about the general state of emergency lighting across North America. Never· theless, the findings call attention to some important aspects of building safety that may be overlooked. They suggest that a suitable result cannot necessarily be obtained by relying on such common rules of thumb as dedicating every tenth luminaire to emergency lighting. Rather, emergency lighting must be carefully designed, redesigned, inspected, and reinspected to ensure that the specific requirements of dynamically changing building interiors are met. In addition, this study highlights the futility of at· tempting to accurately characterize emergency il· lumination in terms of the arithmetic mean of a small number of "representative" measurements. The following recommendations are proposed based on the results of this study:
• Codes and standards based on average il· luminance should be revised in favor of more ap· propriate and less ambiguous guidelines for specify· ing emergency lighting.
• Entire emergency lighting systems (including individual fixtures) should be routinely tested and inspected.
• Emergency lighting fixtures should be discernible from the normal lighting fixtures (e.g., by a colored sticker on one corner of each unit).
• Operations policy should ensure that these fix· tures receive maintenance priority and that floor plan changes, such as the erection of partitions, do not defeat the effectiveness of these fixtures.
• Local battery·powered units should be triggered on lighting circuits rather than general·pur· pose circuits.
Current North American codes, standards, and regulations on emergency lighting are based on the assumption that lighting distributions can be ac· curately characterized in terms of mean illuminances in a horizontal plane. To test this assumption, a com· prehensive survey of emergency lighting was con· ducted in the exit routes of seven randomly selected Winter 1993 JOURNAL of the Illuminating Engineering Society
···
buildings in Ottawa. Six of the seven buildings had mean illuminances meeting the recommendations of codes and standards. Nevertheless, some areas of evacuation were completely dark. Other areas were sufficiently dim to jeopardize the efficiency of building evacuation. It was concluded that arithmetic means cannot accurately describe the severely skewed and variable distributions of emergency lighting data found in typical office buildings. Implications on building safety were discussed, and recommendations for improvement were provided.
Acknowledgements
This study was conducted with the support of Public Works Canada. The authors greatly appreciate the excellent cooperation of the building operation personnel in the surveyed buildings.
References
1. Webber, G.M.B. 1984. Emergency lighting recom· mendations. Proceedings of the National Lighting Con·
ference, Cambridge, U.K.: 138·150.
2. Ouelktte, MJ., and Rea, M.S. 1989. Illuminance requirements for emergency lighting.
J
of the IES18(no. 1):37-42.
3. Boyce, P.R. 1985. Movement under emergency lighting: The effect of movement. Ltg Res & Tech 17(no. 2):51-71.
4. Simmons, R.C. 1975. Illuminance, diversity and disability glare in emergency lighting. Ltg Res & Tech
7(no. 2):125-132.
5. Nikitin, V.D. 1973. Svetotekhnika 6(no. 9).
6.Jaschinski, W. 1982. Conditions of emergency lighting. Ergonomics 25(no. 5):363-372.
7. Canadian Occupational Safety and Health Regulations. 1989. Canada Gazette, Part II 123(no. 23):4580-4587.
8. Associate Committee of the National Building Code of Canada. 1990. National building code of Canada. Ottawa: Institute for Research in Construction, Na· tional Research Council Canada.
9. National Fire Protection Association. 1988. Life
safety code NFPA 101. Quincy, MA: NFPA.
10. Associate Committee of the National Fire Code of Canada. 1990. National fire code of Canada. Ottawa: In· stitute for Research in Construction, National Research Council Canada.
11. Illuminating Engineering Society of North America. 1987. IES lighting handbook: 1987 application
volume. New York: IESNA:2-48.
12. Altamura, S. 1991. Minutes of the August 1991 meeting of IESNA Emergency Lighting Committee, Montreal.
13. Mendelhall, W. 1979. Introduction to probability and
····•···
14. Reichmann WJ. 1981. Use and abuse of statistics.
Markham, Ontario: Penguin Books: 28-42.
15. Commission Internationale de l' .. Eclairage Technical Committee no. 4.1. 1981. Guide on the emergency lighting of building interiors CIE Report No. 49. Vienna: CIE.
16. British Standards Institution. 1988. Emergency lighting, Part I. Code of practice for the emergency lighting
of premises other than cinemas and certain other
specified
premises used for entertainment BS 5266·1988. London: British Standards House.Discussion
I would like to congratulate the authors on the ex· cellent work they did. They have backed up what engineers and designers have theorized for years. Their field of study shows that emergency lighting levels, placement, and maintenance are inadequate, and that stricter attention should be paid by enforce· ment officials, maintenance personnel, designers, ar· chitects, and engineers.
This paper has shown that average levels of 10 lx are not normally achieved if the median is used to deter· mine the illuminance average, which is the proper method in this case. More often, the mean is used to determine the average illuminance, which could leave areas in total darkness, causing unsafe egress paths as demonstrated in this paper.
Moreover, due to lack of actual measurement of il· luminance by the enforcement community, it is hard to expect emergency lighting levels to comply with code. It's even harder to imagine that required levels will be maintained as a building's interiors change over the life of the building.
In Building 7, which contained battery-operated emergency lighting equipment, the length of time over which 387 measureii_J.ents were taken may have been too long. Canada'· only requires a 30-min duration for emergency lighting. The 20 min required to take the measurements may have permitted the emergency illumination level to drop by up to 30 percent of the initial level, which code requires to be 10 lx and only 6 lx at the end of the emergency lighting period.
Did the authors evaluate the time necessary for eye adaptation from the areas of high luminous intensity to the low areas? If so, did this condition hinder the speed of egress the occupants would move? Did the authors observe any discomfort or disability glare from the luminaires during their observations?
I would like to additionally indicate that in the United States Building 7 would be in violation of the National Electrical Code (NFPA 70) because the battery·operated units were not triggered by light-ing circuits.
119
Besides these questions, I completely concur with the authors' recommendations and findings as stated, and that engineers, designers, maintenance person· nel, and the enforcement community need to pay more attention to emergency illuminance levels and maintenance thereof: proper emergency lighting pro-vides proper life safety of the building occupants.
S. Altamura Dual-Lite Inc.
The authors are to be commended for their in· sightful research into the realities of emergency lighting. Emergency lighting codes and standards are written under the assumption that what is specified is what is provided. Ouellette, et al. have provided infor-mation that this is not necessarily so. They have suc-cessfully documented that emergency lighting levels in Canada, and presumably the rest of North America, do not come close to meeting IESNA or COSH specifications. Their paper is unique in documenting the levels of emergency lighting that actually prevail in real buildings. It suggests that there is some real cause for alarm when considering the actual implementa-tion and maintenance of emergency lighting systems. The paper also provides very useful suggestions for more realistic specifications for emergency lighting conditions. The authors provide excellent informa-tion about the statistical treatment of emergency lighting. Could they address their reasons for prefer-ring the minimum luminance over the median or modal luminance? Use of the modal illuminance ap· pears to give reasonable information about the fre· quency of occurrence of a particular luminance value. What about the geometric mean? Would the authors care to speculate on the relationship between il-luminance (mean, median, or minimum) in ensuring safe egress? Certainly, specifying a mean of 10 lx is nonsense if that value is only obtained at one place in a 30-m corridor with much of the corridor left in darkness. If levels of illuminance were low enough that researchers fell over potted plants, that suggests that building occupants would have trouble making their way out successfully during a building emergen· cy. Can the authors speculate that if minimum and median luminance were used this problem would have been avoided? Could they also address the issue of photometer accuracy at such low illuminances?
Authors' response
10 S. Altamura and B. Collins
B. Collins National Institute of Standards and Technology
We appreciate the kind and thoughtful comments JOURNAL of the Illuminating Engineering Society Winter 1993
120
of the two discussers, especially since they have both elab0rated on a key theme of our study-the use and misuse of popular estimators of central tendency. This is especially important in the case of emergency lighting distributions, which as we have seen, are governed more by the inverse square law than by cen· tral limit theory. There are a number of alternative techniques for estimating central tendency, and the discussers have touched on some of them.
The choice of technique depends upon the types of measurement collected, as discussed by Reichmann.14 For example, the geometric mean is suited mostly to measurements of rates of growth (e.g., the growth of national population statistics) in which one measure· ment is dependent upon the former. The harmonic mean is suited to simple ratios (e.g., speed). The mode, or modal value, · is useful when most of the measurements cluster around a single value. Perhaps the most promising one for our purposes is the me· dian, which gives us the dividing line separating the lowest from the highest sets of measurements.
The median is invaluable when the upper or lower boundaries are unknown, as was the· case when il· luminance values fell below the limits of sensitivity of our photometers. Equally important, it is useful when the distribution of measurements is skewed, as we observed in our study. Nevertheless, the median alone does not give the entire picture, but rather a view from a keyhole, as Reichmann puts it. Furthermore, a laborious sorting procedure is required to determine it. The arithmetic mean, as we discussed, is perhaps the least appropriate for emergency lighting because it is meaningful only when the distribution of measurements is not severely skewed. One might perhaps attempt to transform the data to a more nor· mal distribution, then report the arithmetic mean of the transformed data. From our preliminary work, log transforms appear promising. Nevertheless, this ap· proach depends upon distribution shape and involves additional calculation.
Taking a step back, we ask, If there is no central tendency, why try to measure it? The measure might be meaningless at best, and misleading at worst. We believe the solution to the problem is to question why we provide emergency lighting in the first place. One would agree, to some extent, that it is to provide a minimum degree of safety for evacuation and other activities deemed essential. As Dr. Collins points out, an especially bright area at one end of the rome does not compensate for dark areas elsewhere where one might perhaps encounter a potted fern or other hazard in a most unfortunate manner. No form of average (e.g., arithmetic mean, median, geometric mean, harmonic mean, or mode) could be specified to Winter 1993 JOURNAL of the Illuminating Engineering Society
•···
ensure that all areas of the evacuation route are suffi· ciently illuminated. An estimate of dispersion is re· quired. Variance and standard deviation are both estimators of dispersion, as is the range, a measure derived from the minimum and the maximum. For the purposes of emergency lighting, the minimum is the most important component of the range, but the maximum does have importance, especially in regards to adaptation issues, as implied by S. Altamura. If one must adopt a single·number specification system, we recommend the use of the minimum.
Compliance to a minimum illuminance ensures that all hazards, not just some of them, receive suffi. dent illumination to minimize the risk of mishap from insufficient lighting. As a convenient bonus to the enforcement community, the minimum is perhaps the most convenient parameter to measure and analyze. One needn't collect, record, and sort ex· haustive measurements in the obviously well lighted areas. It would suffice to use one's own visual system to .lead one to the dimmest areas, then simply measure the illuminance value there. Of course, the approach necessitates the use of common sense to find the dim· mer areas, and common sense alone cannot be quan· tified. However, the immediate alternative is to aban· don common sense in favor of measures that don't work. We believe the method we propose, a convenient balance between the two approaches, is appropriate and stands the greatest chance of acceptance by en-forcement and other communities. It is perhaps the lack of convenient measurement procedures of this kind that hinders the enforcement community from measuring emergency illumination as extensively as S. Altamura and others might prefer. For all these reasons, the IESNA Emergency Lighting Committee has recently proposed revising the IES Lighting Hand·
book to include a recommendation for a minimum level of emergency illumination. They have also pro· posed that their recommended average should remain in the next edition of the Handbook, as a transition· al precaution.
Dr. Collins asked us to reccommend a minimum il· luminance value. We agree that the value of 0.5 lx now proposed by the IESNA Emergency Lighting Commit· tee is reasonable as discussed in Ouellette and Rea.2 S. Altamura is concerned that battery·serviced spaces should be surveyed in less than 20 min because of possible luminous decay during that period. We ad· mit that this is always a problem with battery·serviced spaces, but it is the only practical method available. He is reminded that occupancy can be expected throughout the 20 minute period, so our measurements are not atypical of the time·and space· averaged illuminances that occupants would ex·
...•...•...•..•...
perience throughout their evacuation. Nevertheless, S. Altamura's comment highlights another fundamental weakness in the central tendency approach to characterizing emergency lighting-the difficulties and potential biases introduced while collecting time· consuming measurements in dynamically changing environments. The minimum is the easiest and quickest statistic to collect, and is therefore the best suited for these types of environments.
Regarding the question of light and dark adapta· tion in emergency evacuation, its effects are addressed in the literatm·e. a The subject is a complex one, and the need for additional research in this area remains. Regarding the question of glare, it was not a serious problem in the first six buildings. There, the emergen· cy lighting was a subset of the normal lighting. Glare was more of an issue for the seventh building, which was serviced by wall-mounted floods. Very few units in this building were aimed against the direction of evacuation, into the eyes of evacuees. In fact, some units were perhaps inappropriately aimed high up the nearest wall in hallways. This practice reduced glare, but also the magnitude of illumination on the floor. Nevertheless, the reviewer's comment is well taken and provides the opportunity to emphasize the importance of good aiming practices and the paten· tial glare problems associated with certain forms of emergency lighting.
Regarding the use of nonlighting circuits for trig· gering battery·operated equipment, we are assured that the current COSH standard requires that emergency lighting need only activate during total building power failures, not necessarily during local lighting failures. It is encouraging that the issue is well addressed in the US code referred to by the discusser. Regarding the question of photometer accuracy, it is understood that high-quality, suitably calibrated in· struments are required 'for accurate measurement of low levels of illumination. The emphasis of the pre· sent paper is in the procedures for obtaining these kinds of measurements and in the appropriateness of the application of conventional statistical descriptors.
Before concluding, we should repeat that although both discussers credit us for having successfully documented the emergency lighting levels in Canada and presumably the rest of North America, the survey was conducted in only seven buildings of one city. Although we have every reason to believe that some of the emergency lighting practices employed in the surveyed buildings are commonly employed elsewhere in North America, one is cautioned in ex· trapolating beyond the scope of the present study.
In conclusion, we thank both discussers for sharing their thoughts. Quite frankly, this paper
12'1
was written to provoke insightful discussion of this kind; not only in this forum but in the sectors of building management, design, standards, codes, and regulation. Regarding the 1992 IES Annual Con· ference, where this paper was first presented, it would seem that we are well on our way. Elsewhere, our sue· cess remains to be determined.
Reference
a. Boyce, P. 1986. Movement under emergency lighting: The effects of changeover from normal lighting. Ltg Res & Tech 18(no. 1):1-18.
JOURNAL of the Illuminating Engineering Society Winter 1993
'"'