Association of Red Blood Cell Distribution Width With Mortality
Risk in Hospitalized Adults With SARS-CoV-2 Infection
The MIT Faculty has made this article openly available.
Please share
how this access benefits you. Your story matters.
Citation
Foy, Brody H. et al. "Association of Red Blood Cell Distribution
Width With Mortality Risk in Hospitalized Adults With SARS-CoV-2
Infection." JAMA Network Open 3, 9 (September 2020): e2022058.
As Published
http://dx.doi.org/10.1001/jamanetworkopen.2020.22058
Publisher
American Medical Association (AMA)
Version
Final published version
Citable link
https://hdl.handle.net/1721.1/127795
Terms of Use
Creative Commons Attribution 4.0 International license
Association of Red Blood Cell Distribution Width With Mortality Risk
in Hospitalized Adults With SARS-CoV-2 Infection
Brody H. Foy, DPhil; Jonathan C. T. Carlson, MD, PhD; Erik Reinertsen, MD, PhD; Raimon Padros I. Valls, BA; Roger Pallares Lopez, BA; Eric Palanques-Tost, BA; Christopher Mow, MS; M. Brandon Westover, MD, PhD; Aaron D. Aguirre, MD, PhD; John M. Higgins, MD
Abstract
IMPORTANCE Coronavirus disease 2019 (COVID-19) is an acute respiratory illness with a high rate of hospitalization and mortality. Biomarkers are urgently needed for patient risk stratification. Red blood cell distribution width (RDW), a component of complete blood counts that reflects cellular volume variation, has been shown to be associated with elevated risk for morbidity and mortality in a wide range of diseases.
OBJECTIVE To investigate whether an association between mortality risk and elevated RDW at hospital admission and during hospitalization exists in patients with COVID-19.
DESIGN, SETTING, AND PARTICIPANTS This cohort study included adults diagnosed with SARS-CoV-2 infection and admitted to 1 of 4 hospitals in the Boston, Massachusetts area (Massachusetts General Hospital, Brigham and Women’s Hospital, North Shore Medical Center, and Newton-Wellesley Hospital) between March 4, 2020, and April 28, 2020.
MAIN OUTCOMES AND MEASURES The main outcome was patient survival during hospitalization. Measures included RDW at admission and during hospitalization, with an elevated RDW defined as greater than 14.5%. Relative risk (RR) of mortality was estimated by dividing the mortality of those with an elevated RDW by the mortality of those without an elevated RDW. Mortality hazard ratios (HRs) and 95% CIs were estimated using a Cox proportional hazards model.
RESULTS A total of 1641 patients were included in the study (mean [SD] age, 62[18] years; 886 men [54%]; 740 White individuals [45%] and 497 Hispanic individuals [30%]; 276 nonsurvivors [17%]). Elevated RDW (>14.5%) was associated with an increased mortality risk in patients of all ages. The RR for the entire cohort was 2.73, with a mortality rate of 11% in patients with normal RDW (1173) and 31% in those with an elevated RDW (468). The RR in patients younger than 50 years was 5.25 (normal RDW, 1% [n = 341]; elevated RDW, 8% [n = 65]); 2.90 in the 50- to 59-year age group (normal RDW, 8% [n = 256]; elevated RDW, 24% [n = 63]); 3.96 in the 60- to 69-year age group (normal RDW, 8% [n = 226]; elevated RDW, 30% [104]); 1.45 in the 70- to 79-year age group (normal RDW, 23% [n = 182]; elevated RDW, 33% [n = 113]); and 1.59 in thoseⱖ80 years (normal RDW, 29% [n = 168]; elevated RDW, 46% [n = 123]). RDW was associated with mortality risk in Cox proportional hazards models adjusted for age, D-dimer (dimerized plasmin fragment D) level, absolute
lymphocyte count, and common comorbidities such as diabetes and hypertension (hazard ratio of 1.09 per 0.5% RDW increase and 2.01 for an RDW >14.5% vsⱕ14.5%; P < .001). Patients whose RDW increased during hospitalization had higher mortality compared with those whose RDW did not change; for those with normal RDW, mortality increased from 6% to 24%, and for those with an elevated RDW at admission, mortality increased from 22% to 40%.
(continued)
Key Points
Question In patients with SARS-CoV-2 infection, is there an association between mortality risk and red blood cell distribution width (RDW), a routine complete blood count component, at the time of admission and during hospitalization?
Findings In this cohort study of 1641 adult patients with SARS-CoV-2 infection who were hospitalized, elevated RDW at admission and increasing RDW during hospitalization were associated with statistically significant increases in mortality risk. The association between the RDW at admission and mortality risk was independent of D-dimer (dimerized plasmin fragment D) level, absolute lymphocyte count, demographic factors, and common comorbidities. Meaning The findings suggest that an elevated RDW measured at admission and increasing RDW during
hospitalization were associated with significantly higher mortality risk for patients with SARS-CoV-2 infection; RDW may be helpful for patient risk stratification.
+
Supplemental contentAuthor affiliations and article information are listed at the end of this article.
Abstract (continued)
CONCLUSIONS AND RELEVANCE Elevated RDW at the time of hospital admission and an increase in RDW during hospitalization were associated with increased mortality risk for patients with COVID-19 who received treatment at 4 hospitals in a large academic medical center network.
JAMA Network Open. 2020;3(9):e2022058. doi:10.1001/jamanetworkopen.2020.22058
Introduction
Coronavirus disease 2019 (COVID-19) is an acute respiratory illness caused by infection with severe acute respiratory syndrome coronavirus 2 (SARS-CoV-2). COVID-19 has a high rate of hospitalization, critical care requirement, and mortality.1,2
Identifying patients at highest risk for severe disease is important to faciliate early, aggressive intervention and to manage local hospital resources to mitigate the critical care crises that have impacted some hospital systems. In general, COVID-19 is associated with lymphopenia, occasional thrombocytopenia, and overall leukopenia at hospital admission.3
The clinical course for patients who are hospitalized varies dramatically, with early evidence showing that ICU admission and mortality risk are associated with an elevated D-dimer (dimerized plasmin fragment D) level and a decreasing lymphocyte count.1,4
Additional routine biomarkers for patient risk stratification are urgently needed.
The red blood cell distribution width (RDW) is a standard component of a routine complete blood count test. RDW quantifies the variation of individual red blood cell (RBC) volumes, which vary from one cell to the next and for the same cell as it circulates during its approximately 115-day lifespan.5-7
Elevated RDW is associated with an increased risk for all-cause mortality; mortality from heart disease, pulmonary disease, sepsis, influenza, and cancer; complications associated with heart failure, severity of coronary artery disease and viral hepatitis, advanced stage and grade for many cancers; and the development of diabetes, chronic obstructive pulmonary disease, stroke, anemia, and many other conditions.8-18
RDW appears to be a nonspecific marker of illness that has the potential to provide general quantitative risk stratification that may be particularly useful for a new and unknown disease.
RDW is the coefficient of variation in RBC volume, or the SD divided by the mean. An increase in RDW must therefore correspond to a decrease in mean RBC volume (MCV), an increase in RBC volume variance, or both. Previous studies6,8,17,19
have found evidence in some specific conditions that RDW elevation is caused by delayed clearance of older RBCs. Because RBCs characteristically decrease in cellular volume across their lifespan, persistence of these older, smaller cells thus increases volume variance, and this clearance delay coincides with and offsets a net decrease in RBC production.6,8,17
These reports suggest the possibility that an elevated RDW in some circumstances may reflect a clinical state in which RBC production and turnover have slowed in the setting of increased production and turnover of leukocytes or platelets such as would occur in inflammation. Although a definitive mechanism for RDW elevation has not yet been established, there is evidence that RDW can provide robust risk-stratification among patients diagnosed with the same acute illness. In this study, our aim was to investigate whether an association exists between mortality risk and elevated RDW measured at hospital admission and during hospitalization in patients with COVID-19.
Methods
Patients and Study Design
This study was performed in accordance with the Strengthening the Reporting of Observational Studies in Epidemiology (STROBE) reporting guideline. All patient data was gathered using the Partners Healthcare Research Patient Data Registry and Electronic Data Warehouse under a research protocol
that was approved for a waiver of patient informed consent by the Partners Healthcare Institutional Review Board because the study involved material collected for nonresearch purposes and involved minimal risk. Clinical data were retrospectively analyzed for all patients who tested positive for SARS-CoV-2 infection between March 4, 2020, and April 28, 2020, at 1 of 4 Partners Healthcare Network hospitals: Massachusetts General Hospital (MGH), Brigham and Women’s Hospital (BWH), North Shore Medical Center (NSMC), and Newton-Wellesley Hospital (NWH) (6376 patients).
Patients were excluded from the study if they were younger than 18 years, or if they did not have an inpatient hospital stay at 1 of the 4 hospitals within 1 month of the initial positive diagnosis (eFigure 1 in theSupplement). A total of 1641 patients (893 from MGH, 446 from BWH, 180 from NSMC, and 122 from NWH) were included in the analysis. Patients with multiple separate inpatient visits related to COVID-19 were treated as having been admitted during the first visit and discharged at the final visit. For analysis purposes, patients who had visits spanning multiple medical centers were classified as being in the cohort associated with the first medical center where they were admitted after a COVID-19 diagnosis. The final patient discharge occurred on June 26, 2020, with no COVID–19-related readmissions occurring by July 25, 2020 (the data collection end point).
For all inpatients, RDW, absolute lymphocyte count, and D-dimer level were collected approximately daily along with other clinical laboratory values, as part of standard clinical care. Complete blood counts, including RDW and lymphocyte count were performed on an XN-9000 Automated Hematology System (Sysmex Corporation). D-dimer level was measured using a Vidas 3 immunoanalyzer (bioMérieux). SARS-CoV-2 infection was diagnosed using multiple instruments and assays including the bioMérieux BioFire Respiratory 2.1 panel, Roche Cobas 6800 system, and Cepheid GeneXpert molecular diagnostic system.
Race and ethnicity were self-reported by patients and were obtained from medical records. Race was categorized as one of the following categories: Black/African American; White; other or unknown (encompassing Asian, Pacific Islander or Hawaiian, Native American Indian or Alaskan native, Hispanic/Latino (some patients self-reported Hispanic/Latino race), other, and declined to respond or unknown). Ethnicity was categorized as one of the following categories: Hispanic; non-Hispanic; unknown (declined to respond or unknown). These categorizations were chosen and included in the analysis because previous reports have suggested potential differences in infection risk and disease severity among these groups.20-23
Comorbidities were analyzed by identifying
International Statistical Classification of Diseases and Related Health Problems, Tenth Revision codes
associated with the diagnostic history of each patient. Mortality was determined by reviewing discharge summaries, with an assumption of no COVID–19-related deaths for patients who were discharged alive. The implications of this assumption are explored in theSupplement.
Results are presented using pooled data from MGH, BWH, NSMC, and NWH. Similar results were found when the BWH and MGH cohorts were each analyzed separately (eFigures 2 and 3 and eTable 1 in theSupplement); NSMC and NWH cohorts were not analyzed separately because of their small size.
Statistical Analysis
The Kaplan-Meier method was used to analyze survival in inpatients who were stratified by RDW at admission. To account for age as a potential confounder and the potential for effect modification, patients were categorized into 5 age groups: <50 years, 50 to 60 years, 60 to 70 years, 70 to 80 years, andⱖ80 years. There were 206 patients younger than 40 years, of which 2 died. An elevated RDW was defined as greater than 14.5%, the current upper limit of the healthy adult reference interval at both MGH and BWH. Patients who were discharged alive were censored on June 26, 2020 (the date of last discharge across the cohort). The implications of censoring at discharge are presented in eFigure 4 in theSupplement.
Mortality hazard ratios (HRs) were calculated using a Cox proportional hazards model. Models were fit with univariate inputs and multivariate inputs, using RDW, age, race, and ethnicity, and 2 clinical COVID-19 risk factors: absolute lymphocyte count, and D-dimer level.4
demographic risk profiles, race and ethnicity were encoded as binary variables to compare higher risk groups with lower risk groups.20
Race was coded as 1 for Black/African American, and 0 for all other groups. Ethnicity was coded as 1 for Hispanic, and 0 for non-Hispanic/unknown. Models were fit with variables catgorized as either continuous or binary using a risk threshold. Risk thresholds were defined as age older than 70 years, RDW greater than 14.5%, absolute lymphocyte count <0.8 × 10⁹
/L, and D-dimer level greater than 1500 ng/mL (to convert to nanomoles per liter, multiply by 0.005476). Thresholds for age, absolute lymphocyte count, and D-dimer level were chosen based on previous COVID-19 studies.4
Using these thresholds, each high-risk cohort was of a similar size: age older than 70 years (30% of patients), RDW greater than 14.5% (34% of patients), lymphocyte count less than 0.8 × 10⁹
/L (26% of patients), D-dimer level higher than 1500 ng/L (26% of patients). For continuous models, HRs were normalized based on clinically meaningful changes in the measurements: 10 years for age, 0.5% for RDW, 0.1 x10⁹
/L for absolute lymphocyte count, and 100 mg/L for D-dimer level. For ease of comparison, HRs for absolute lymphocyte count were inverted to represent the increased risk for a decrease in value. All other HRs were relative to increases. Multivariate proportional hazards models were also fit using patient comorbidities, with results presented in the eTable 3 in theSupplement. To account for potential effect modification, models were fit separately for each age category (eTable 2 in theSupplement). For completeness, models were also fit incorporating other blood count measures (eTable 4 in theSupplement).
Changes in RDW during the hospital stay were evaluated by taking the percentage point difference between the first and last available RDW measurement. All patients had at least 2 distinct RDW measurements during their stay. RDW trajectories were plotted for patients and were stratified by normal and abnormal RDW as well as survival status on discharge. Mean RDW trajectories were calculated by linearly interpolating patient RDW values and calculating the mean value for all patients in a cohort at the interpolated time after admission (curves were calculated using a temporal spacing of 1 hour). Mean RDW trajectories were calculated across the first week of admission, and cohorts were limited to patients who had a hospital stay of at least 7 days. The implications of this exclusion are explored in eFigure 5 and 6 in theSupplement.
Statistical differences between cohorts were analyzed using a χ2
proportion comparison test for incidence rates (%), a 2-sample, 2-sided t test for means, and a 2-sided Wilcoxon rank sum test for medians. Differences in HRs and RRs were analyzed using a Mantel-Haenszel test.24
All statistical analysis was performed using MATLAB 2019b (MathWorks). P < .05 was considered to be statistically significant.
Results
Baseline Characteristics of Patients
We retrospectively investigated RDW measured at the time of admission for a diagnosis of SARS-CoV-2 infection in 1641 patients admitted to 1 of 4 hospitals in the Boston, Massachusetts area between March 4, 2020, and April 28, 2020. The mean (SD) age of the patients was 62 (18) years, and 886 were men (54%). Of 1641 patients, 740 were White individuals (45%) and 497 were Hispanic individuals (30%). Of 1641 patients, 276 died (17%). Other baseline characteristics of patients, stratified by survival status, are shown in Table 1.
Elevated RDW at Admission and Mortality Risk
Patients whose RDW was greater than 14.5% at admission for a COVID-19 diagnosis had a mortality risk of 31%, whereas those with an RDW of 14.5% or less had a mortality risk of 11%. The RR of mortality for those with an elevated RDW was 2.73 (95% CI, 2.52-2.94). Age has previously been shown to be a risk factor for COVID-19 mortality.4
In patient groups stratified by age, elevated RDW remained associated with increased relative risk of mortality for patients younger than 50 years, 50 to 59 years, 60 to 69 years, and 80 years or older (Figure 1 and Table 2). For patients in the 70- to 79- year age group, the RR was elevated (1.45) but was not statistically significant. Relative risk was
particularly elevated within 48 hours of admission, with patients with a normal RDW of 14.5% or less having a mortality of 0.8% (9 of 1175 patients) within 48 hours of admission, whereas the mortality rate for those with an RDW greater than 14.5% was 4.9% (23 of 470 patients), a risk ratio of 6.12. Risk ratios for different age groups were significantly different compared with each other, suggesting an effect modification, with an elevated RDW having a larger effect on mortality for younger patients (<70 years) than it had for older patients.
Association of RDW with Mortality Risk After Adjustment for Age, Race, Ethnicity,
D-dimer Level, and Lymphopenia
Previous studies have found an elevated D-dimer level and low absolute lymphocyte count to be associated with an increased mortality risk.4
Cox proportional hazards regression modeling was used to investigate whether RDW provided independent risk information beyond these markers, both
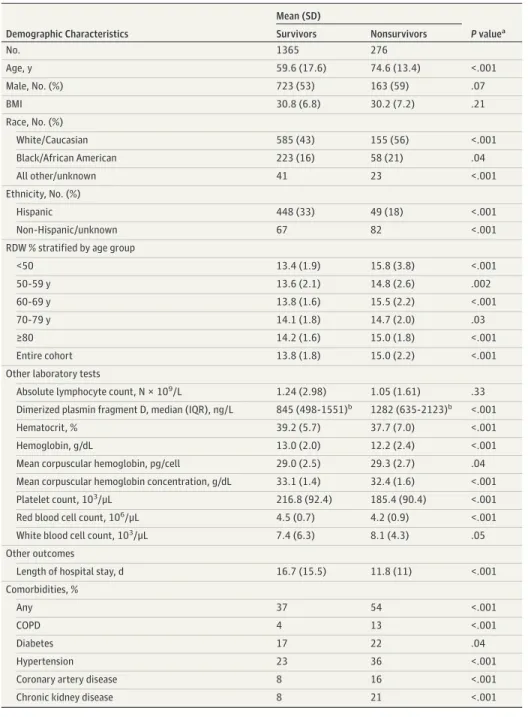
Table 1. Patient Characteristics Stratified by Mortality at Discharge
Demographic Characteristics Mean (SD) P valuea Survivors Nonsurvivors No. 1365 276 Age, y 59.6 (17.6) 74.6 (13.4) <.001 Male, No. (%) 723 (53) 163 (59) .07 BMI 30.8 (6.8) 30.2 (7.2) .21 Race, No. (%) White/Caucasian 585 (43) 155 (56) <.001 Black/African American 223 (16) 58 (21) .04 All other/unknown 41 23 <.001 Ethnicity, No. (%) Hispanic 448 (33) 49 (18) <.001 Non-Hispanic/unknown 67 82 <.001 RDW % stratified by age group
<50 13.4 (1.9) 15.8 (3.8) <.001 50-59 y 13.6 (2.1) 14.8 (2.6) .002 60-69 y 13.8 (1.6) 15.5 (2.2) <.001 70-79 y 14.1 (1.8) 14.7 (2.0) .03 ≥80 14.2 (1.6) 15.0 (1.8) <.001 Entire cohort 13.8 (1.8) 15.0 (2.2) <.001 Other laboratory tests
Absolute lymphocyte count, N × 109/L 1.24 (2.98) 1.05 (1.61) .33
Dimerized plasmin fragment D, median (IQR), ng/L 845 (498-1551)b 1282 (635-2123)b <.001
Hematocrit, % 39.2 (5.7) 37.7 (7.0) <.001 Hemoglobin, g/dL 13.0 (2.0) 12.2 (2.4) <.001 Mean corpuscular hemoglobin, pg/cell 29.0 (2.5) 29.3 (2.7) .04 Mean corpuscular hemoglobin concentration, g/dL 33.1 (1.4) 32.4 (1.6) <.001 Platelet count, 103/μL 216.8 (92.4) 185.4 (90.4) <.001
Red blood cell count, 106/μL 4.5 (0.7) 4.2 (0.9) <.001
White blood cell count, 103/μL 7.4 (6.3) 8.1 (4.3) .05
Other outcomes
Length of hospital stay, d 16.7 (15.5) 11.8 (11) <.001 Comorbidities, %
Any 37 54 <.001
COPD 4 13 <.001
Diabetes 17 22 .04
Hypertension 23 36 <.001 Coronary artery disease 8 16 <.001 Chronic kidney disease 8 21 <.001
Abbreviations: BMI, body mass index (calculated as weight in kilograms divided by height in meters squared); COPD, chronic obstructive pulmonary disease; IQR, interquartile range; RDW, red blood cell distribution width.
SI conversion: To convert dimerized plasmin fragment D level to nmol/L, multiply by 0.005476; to convert platelet count to ×109
/L, multiply by 1.0; to convert red blood cell count to ×1012
/L, multiply by 1.0; to convert white blood cell count to ×109
/L, multiply by 0.001.
a
Statistical significance was calculated using a 2-sided
t test for means, a χ2
test for percentages, and 2-sided Wilcoxon rank sum test for dimerized plasmin fragment D.
bDimerized plasmin fragment D is presented as
when considered as a binary marker relative to the 14.5% reference interval boundary and when considered as a continuous marker. Figure 2 shows that RDW greater than 14.5% was associated with a statistically significant increased risk of mortality for all models considered, including those
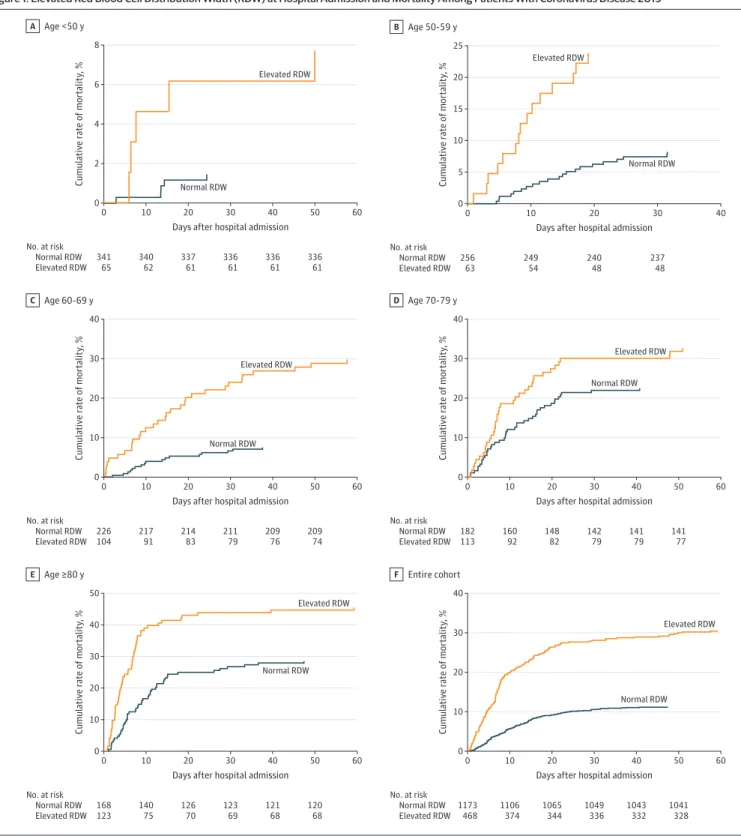
Figure 1. Elevated Red Blood Cell Distribution Width (RDW) at Hospital Admission and Mortality Among Patients With Coronavirus Disease 2019
8 6 4 2 0 Cumulativ e r ate of mor talit y, %
Days after hospital admission Age <50 y A 0 341 65 10 340 62 20 337 61 30 336 61 40 336 61 50 336 61 60 No. at risk Normal RDW Normal RDW Elevated RDW Elevated RDW 25 20 15 10 5 0 Cumulativ e r ate of mor talit y, %
Days after hospital admission Age 50-59 y B 0 256 63 10 249 54 20 240 48 30 237 48 40 No. at risk Normal RDW Normal RDW Elevated RDW Elevated RDW Cumulativ e r ate of mor talit y, %
Days after hospital admission Age 60-69 y C 0 226 104 10 217 91 20 214 83 30 211 79 40 209 76 50 209 74 60 No. at risk Normal RDW Normal RDW Elevated RDW Elevated RDW 40 30 20 10 0 40 30 20 10 0 Cumulativ e r ate of mor talit y, %
Days after hospital admission Age 70-79 y D 0 182 113 10 160 92 20 148 82 30 142 79 40 141 79 50 141 77 60 No. at risk Normal RDW Normal RDW Elevated RDW Elevated RDW 50 40 30 20 10 0 Cumulativ e r ate of mor talit y, %
Days after hospital admission Age ≥80 y E 0 168 123 10 140 75 20 126 70 30 123 69 40 121 68 50 120 68 60 No. at risk Normal RDW Normal RDW Elevated RDW Elevated RDW 40 30 20 10 0 Cumulativ e r ate of mor talit y, %
Days after hospital admission Entire cohort F 0 1173 468 10 1106 374 20 1065 344 30 1049 336 40 1043 332 50 1041 328 60 No. at risk Normal RDW Normal RDW Elevated RDW Elevated RDW
Across all age groups, an RDW greater than 14.5% measured at the time of admission was associated with a 31% mortality compared with an 11% mortality for patients whose RDW at admission wasⱕ14.5%. All increases in mortality are statistically significant except in
the 70- to 80-year age group. Table 2 details age-stratified and RDW-stratified mortality rates.
adjusted for age, race, ethnicity, absolute lymphocyte count, and D-dimer level as continuous and binary variables. Age and RDW were the only variables with statistically significant risk ratios for both the continuous and discrete multivariate models. Black/African American race appeared to be associated with elevated risk of mortality in the multivariate discrete model, but the results were not statistically significant. Hispanic ethnicity was associated with a lower risk of mortality in the univariate model, but not in the multivariate model, likely reflecting the lower mean (SD) age of Hispanic patients (54 [16.2] years) compared with the mean (SD) age of other patients (66 [17.1]
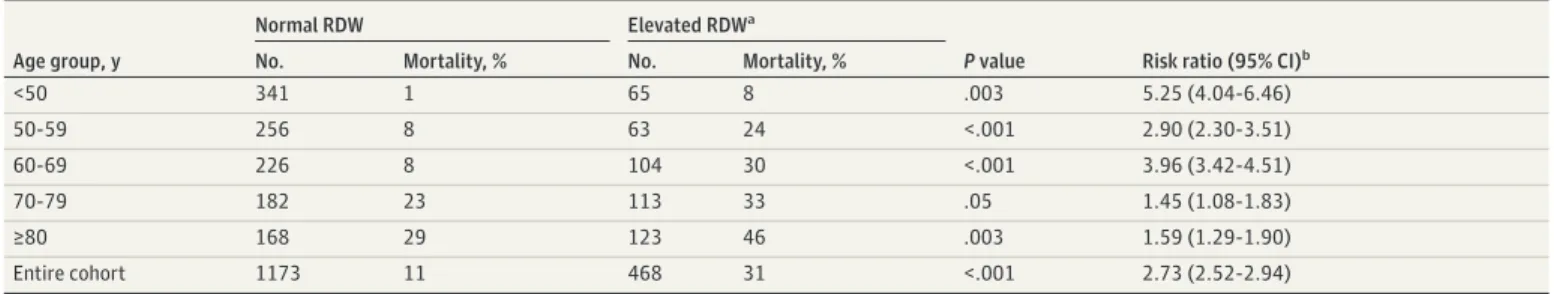
Table 2. Mortality Rates Stratified by Age and RDW Elevation at Admission
Age group, y
Normal RDW Elevated RDWa
P value Risk ratio (95% CI)b
No. Mortality, % No. Mortality, %
<50 341 1 65 8 .003 5.25 (4.04-6.46) 50-59 256 8 63 24 <.001 2.90 (2.30-3.51) 60-69 226 8 104 30 <.001 3.96 (3.42-4.51) 70-79 182 23 113 33 .05 1.45 (1.08-1.83) ≥80 168 29 123 46 .003 1.59 (1.29-1.90) Entire cohort 1173 11 468 31 <.001 2.73 (2.52-2.94) Abbreviation: RDW, red blood cell distribution width.
aElevated RDW was considered to be greater than 14.5%.
bRisk ratios were statistically significantly different (P < .001) from each other (on the
basis of a Mantel-Haenszel test), suggesting that patients younger than 70 years had higher risk ratios.
Figure 2. Cox Proportional Hazards Modeling of Mortality Risk Multivariate continuous A P value Variable HR (95% CI) <.001 1.62 (1.50-1.76) Age <.001 1.09 (1.07-1.12) RDW .19 .33 1.01 (0.99-1.03) Absolute lymphocytes 1.00 (1.00-1.01) D-dimer .22 1.22 (0.88-1.70) Black/African American race .83 1.04 (0.74-1.46) Hispanic ethnicity Univariate continuous B P value Variable HR (95% CI) <.001 1.60 (1.49-1.72) Age <.001 1.09 (1.07-1.11) RDW .24 1.01 (0.99-1.03) Absolute lymphocytes <.001 1.01 (1.01-1.02) D-dimer .07 1.31 (0.98-1.74) Black/African American race <.001 0.46 (0.34-0.63) Hispanic ethnicity Multivariate discrete C 0 2 3 4 5 HR (95% CI) 1 P value Variable HR (95% CI) <.001 3.31 (2.55-4.31) Age <.001 2.17 (1.70-2.76) RDW <.001 1.62 (1.27-2.07) Absolute lymphocytes .16 1.20 (0.93-1.53) D-dimer .07 1.32 (0.98-1.79) Black/African American race .41 0.87 (0.63-1.21) Hispanic ethnicity Univariate discrete D 0 2 3 4 5 6 HR (95% CI) 1 P value Variable HR (95% CI) <.001 4.15 (3.24-5.33) Age <.001 2.93 (2.31-3.71) RDW <.001 1.91 (1.51-2.41) Absolute lymphocytes <.001 1.77 (1.39-2.26) D-dimer .07 1.31 (0.98-1.74) Black/African American race <.001 0.46 (0.34-0.63) Hispanic ethnicity 0.8 1.2 1.4 1.6 1.8 HR (95% CI) 1.0 1.0 1.5 HR (95% CI) 0.5 Lower risk Higher risk Lower risk Higher risk Lower risk Higher risk Lower risk Higher risk
Models of mortality adjusted for age, race, ethnicity, red blood cell distribution width (RDW), absolute lymphocyte count, and D-dimer (dimerized plasmin fragment D) level are given for the multivariate (A) and univariate (B) analyses. Variables were coded as either continuous (A and B) or discrete (C and D) using the following thresholds: age older than 70 years, RDW >14.5%, lymphocyte count <0.8 × 10⁹/L, and D-dimer level
greater than 1500 ng/L, which provided similar proportions of abnormality in the cohort
(33%, 29%, 27%, and 28%, respectively, for age, RDW, lymphocyte count, and D-dimer level). Race was coded as 1 for Black/African American, and 0 for all other groups. Ethnicity was coded as 1 for Hispanic, and 0 for non-Hispanic/unknown. For continuous models, changes in variables were normalized as follows: age increase of 10 years, RDW increase of 0.5%, D-dimer level increase of 100 ng/L, and a lymphocyte count decrease of 0.1 103 ×109/L.
years). The statistical significance of the association between mortality and RDW persisted when separate Cox proportional hazards models were fit for each age group (eTable 2 in theSupplement).
We performed additional Cox proportional hazards modeling (eTable 3 in theSupplement), incorporating 5 major comorbidities (chronic obstructive pulmonary disease (COPD), coronary artery disease, chronic kidney disease (CKD), diabetes, and hypertension). When jointly modeled, the HR associated with an RDW greater than 14.5% remained statistically significant and was greater than that for any comorbidity (HR, 2.01 [95% CI, 1.57-2.57]; P < .001), and RDW modeled as a continuous variable was statistically significant with a HR of 1.09 per 0.5 percentage point increase in RDW. When accounting for RDW, CKD and COPD were the only comorbidities that retained statistically significant HRs (CKD, 1.66 [95% CI, 1.20-2.29]; P = .002; COPD, 1.69 [95% CI, 1.18-2.44]; P = .005]. When multivariate models included some other blood count measures (eTable 4 in theSupplement), only RDW and platelet (PLT) count had statistically significant HRs (RDW >14.5%, 2.04 [95% CI, 1.55-2.69]; PLT<150 × 103
/μL, 1.76 [95% CI, 1.37-2.25]; P < .001).
Increasing RDW After Hospital Admission and Mortality Risk
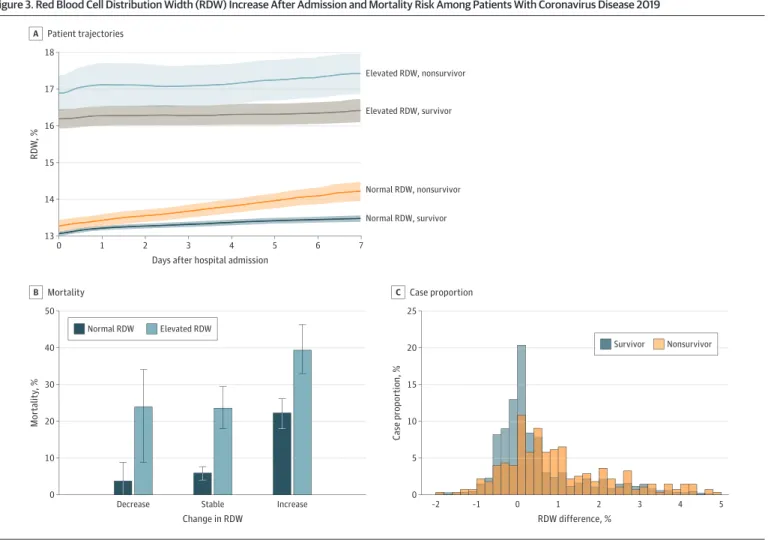
We investigated whether changes in RDW after admission were associated with increased mortality risk for those with initially elevated RDW at hospital admission and those with normal RDW. Figure 3 shows that patients with an RDW of 14.5% or less at admission who died had an increasing mean RDW, whereas those with an RDW of 14.5% or less who were alive at discharge had a stable RDW. For all patients, an increasing RDW during hospitalization was associated with increased mortality risk: from 6% (95% CI, 4%-8%) to 24% (95% CI, 18%-30%) for those with a normal RDW at admission and from 22% (95% CI, 18%-26%) to 40% (95% CI, 33%-47%) for those with an elevated RDW at admission. Figure 3 shows that the mean RDW in the elevated group is 16.4 compared with 13.0 in the nonelevated group. In general, a 1.25-fold higher RDW reflects a 1.25-fold smaller MCV, a 1.25-fold larger SD of the RBC volume distribution, or a combination of smaller changes to both. The average MCV differed by a factor of only about 1.01 (89 fL vs 87.9 fL) (eFigures 5 and 6 in theSupplement). Although the true baseline RDW for the elevated RDW group is unknown, these results suggest that the major contributor to elevated RDW is an increase in variance of the RBC volume distribution instead of a decrease in MCV. Figure 3 also shows that those who do not survive have an average RDW increase of 1.5% during their first week of hospitalization, a significantly larger RDW increase than in all other groups. Few patients experienced greater than a 2% increase per week in RDW during their hospitalization, and the large increase in the elevated RDW group raises the possibility of a longer duration of disease for these patients at the time of admission.
Discussion
In this cohort study, an RDW greater than 14.5% at the time of admission for SARS-CoV-2 infection was associated with an increase in mortality risk (from 11% to 31%) in a cohort of 1641 patients treated at a large academic medical center network. Risk of mortality associated with RDW remained statistically significant after adjustment for patient age, race, ethnicity, D-dimer level, absolute lymphocyte count, other blood count measures, and 5 major comorbidities. Patients whose RDW increased during admission also had an increased mortality risk. RDW is routinely measured and may be helpful for prioritizing patients for early, aggressive intervention and managing local hospital resource use.
Patients with elevated RDW at admission were 6.12 times more likely to die within 48 hours (23 of 470 patients [4.9%]) than patients with a normal RDW (9 of 1175 patients [0.8%]). This rapid decompensation is consistent with hospital presentation after substantial disease progression, but timing of disease onset was not available for this cohort. Elevated RDW resulted in a larger increase in mortality risk in younger patients (<70 years) compared with older patients. This finding may reflect the higher overall mortality rate for older patients, dampening an RDW effect measured in terms of relative risk. A contributing factor may be the lower RDW at admission in the younger age groups
(Table 1), which implies that an RDW >14.5% represents a larger change compared with baseline RDW in these younger patients. It is also possible that an RDW greater than 14.5% is a stronger
inflammatory marker in younger patients than in older patients, but studies that are specifically designed to test this hypothesis are required. Race and ethnicity were not statistically significantly associated with an increased mortality risk after adjusting for age and RDW, suggesting that neither race nor ethnicity had implications for patient outcomes after admission. Patients who self-reported Black/African American race or Hispanic ethnicity were overrepresented in the admitted hospital cohort (17% Black/African American and 30% Hispanic) compared with 9% and 12% in a Massachusetts population,25
consistent with a higher risk of infection in these racial and ethnic groups.20,23
Other studies have noted the potential value of using RDW for a differential diagnosis of pneumonia26,27
or as a marker of complication rates in SARS-CoV-2 infection,28-31
either directly or as a component of a machine learning framework. Recent small-scale studies have included RDW in multivariate models along with neutrophil-lymphocyte ratio28
or hemoglobin26
for a differential diagnosis of COVID-19. The results of the present study show that the use of RDW as a univariate marker relative to its predetermined reference interval (ⱕ14.5%) is associated with substantially
Figure 3. Red Blood Cell Distribution Width (RDW) Increase After Admission and Mortality Risk Among Patients With Coronavirus Disease 2019
5 18 17 16 15 14 13 RDW , %
Days after hospital admission Patient trajectories A 7 6 5 4 3 2 1 0 25 20 15 10 0 Case propor tion, % RDW difference, % Case proportion C Nonsurvivor Survivor 50 40 30 20 10 0 Mor talit y, % Change in RDW
Decrease Stable Increase
Mortality B Elevated RDW Normal RDW Elevated RDW, nonsurvivor Normal RDW, nonsurvivor Normal RDW, survivor Elevated RDW, survivor –2 –1 0 1 2 3 4 5
A, Stratifying patients based on admission RDW and mortality reveals that, among patients with an RDW of 14.5% or less at admission, those who do not survive have an average RDW increase of 1.5% during their first week of hospitalization, a significantly larger RDW increase than in all other groups. Shading represents the 95% CI. B, Among patients with an RDW of 14.5% or less at admission, those with an increase of more than 0.5% in RDW between admission and discharge had a 24% (95% CI, 18%-30%) mortality rate compared to 6% (95% CI, 4%-8%) for those with stable RDW (ⱖ−0.5% and
ⱕ0.5%). Among patients with elevated RDW at admission, a further increase in RDW during admission was associated with a mortality rate of 40% (95% CI, 33%-47%), and a stable elevated RDW was associated with a mortality rate of 22% (95% CI, 18%-26%). C, A histogram of RDW change in survivors and nonsurvivors of coronavirus disease 2019 shows that nonsurvivors were more likely than survivors to experience an RDW increase during hospitalization. Change in RDW is reported in percentage points. For instance, a change in RDW from 14.0% to 15.0% is reported as 1.0%.
increased mortality risk. We also found that RDW was associated with the highest risk ratio when considered in multivariate models with some other blood count measures (eTable 4 in the
Supplement). The only other blood count measure studied with a statistically significant risk ratio was PLT count, and future investigation is warranted given the evidence of thrombotic complications within COVID-19 patients.32,33
The specific mechanism or mechanisms for the RDW alteration associated with COVID-19 remain unclear. RDW is a nonspecific marker of general illness8-17
and is therefore unlikely to be causally associated with COVID-19 disease progression. COVID-19 is associated with altered turnover in all WBC lineages, as noted previously, as well as with altered platelet dynamics in COVID-associated coagulopathy.32
The association of elevated RDW with COVID-19 severity could be consistent with previous reports (in non–COVID-19 cohorts), suggesting that RDW can become elevated when RBC production kinetics have slowed in the setting of increased WBC and platelet kinetics.6,8,17
It is unknown whether patients admitted with an RDW greater than 14.5% had higher baseline RDW than those who were admitted with an RDW of 14.5% or less before SARS-CoV-2 infection. RDW usually changes slowly because it reflects the volume variance of a cell population that is turning over at a rate typically no larger than a 1% or 2% per day. The large increase in the elevated RDW group (>3% shown in Figure 3A) may suggest a longer duration of disease for these patients at the time of admission, but direct study of the earlier phases of the disease is required to know how quickly RDW may be evolving before hospitalization, and determination of time of initial infection was not possible within this study cohort.
Patients with many different underlying acute and chronic illnesses would be expected to have a higher baseline RDW, and it is possible that the RDW measured at admission is a nonspecific summary marker of the presence of these illnesses that have been shown to be associated with elevated RDW and may be expected to complicate the COVID-19 clinical course. Regardless of the reasons for the differences in RDW at admission, the association of elevated RDW with increased mortality risk appears to persist after admission, as demonstrated by the higher mortality rate for patients in the present cohort whose RDW increased during hospitalization.
Limitations
This study has limitations. It describes the potential value of RDW for risk stratification of admitted patients with COVID-19, but because the present analysis was limited to a hospitalized cohort, these results may not apply to individuals with COVID-19 who are not hospitalized. Because the time of initial infection was unavailable, these results are not specific to any disease progression time points. The cohort may have been underpowered for evaluation of mortality risk associated with self-reported Black/African American race. In addition, the socioeconomic status20-23
of patients was unavailable, and the potential association of mortality risk with socioeconomic status could not be assessed. The study included few younger patients (206 patients younger than 40 years, 2 deaths), and results should only be considered valid for those older than 40 years. In addition, although results in this study spanned 4 hospitals, they are located in the same geographic region (Boston, Massachusetts). Although other studies support the potential value of RDW for risk stratification in inflammatory scenarios,8-17
this study cohort may not be representative of other US and non-US populations.
Conclusions
In this cohort study of patients hospitalized for COVID-19, RDW measured at admission and during hospitalization was associated with a statistically significant increase in mortality. RDW is a routine laboratory test that may be useful in risk stratification of hospitalized patients with COVID-19.
ARTICLE INFORMATION
Accepted for Publication: August 17, 2020.
Published: September 23, 2020. doi:10.1001/jamanetworkopen.2020.22058
Open Access: This is an open access article distributed under the terms of theCC-BY License. © 2020 Foy BH et al.
JAMA Network Open.
Corresponding Authors: John M. Higgins, MD (john_higgins@hms.harvard.edu), and Jonathan C. T. Carlson, MD,
PhD (carlson.jonathan@mgh.harvard.edu), Simches Research Center, 185 Cambridge St, Boston, MA 02114. Author Affiliations: Center for Systems Biology, Massachusetts General Hospital, Harvard Medical School, Boston (Foy, Carlson, Reinertsen, Padros I. Valls, Pallares Lopez, Palanques-Tost, Mow, Aguirre, Higgins); Department of Pathology, Massachusetts General Hospital, Harvard Medical School, Boston (Foy, Higgins); Department of Systems Biology, Harvard Medical School, Boston, Massachusetts (Foy, Higgins); Cancer Center, Massachusetts General Hospital and Harvard Medical School, Boston (Carlson); Research Laboratory for Electronics, Massachusetts Institute of Technology, Cambridge (Reinertsen); Cardiology Division, Massachusetts General Hospital, Harvard Medical School, Boston (Reinertsen, Padros I. Valls, Pallares Lopez, Palanques-Tost, Aguirre); Partners Healthcare Enterprise Research Information Systems, Boston, Massachusetts (Mow); Clinical Data AI Center and Neurology Department, Massachusetts General Hospital, Boston (Westover); Division of Pulmonary and Critical Care Medicine, Massachusetts General Hospital, Boston (Westover); Neurology Department, Harvard Medical School, Boston Massachusetts (Westover); Wellman Center for Photomedicine, Massachusetts General Hospital, Harvard Medical School, Boston (Aguirre).
Author Contributions: Dr Higgins had full access to all of the data in the study and takes responsibility for the integrity of the data and the accuracy of the data analysis.
Concept and design: Foy, Carlson, Westover, Aguirre, Higgins. Acquisition, analysis, or interpretation of data: All authors. Drafting of the manuscript: Foy, Reinertsen, Mow, Higgins.
Critical revision of the manuscript for important intellectual content: Foy, Carlson, Reinertsen, Padros I Valls, Pallares
Lopez, Palanques-Tost, Westover, Aguirre, Higgins.
Statistical analysis: Foy, Higgins. Obtained funding: Higgins.
Administrative, technical, or material support: Reinertsen, Mow, Aguirre, Higgins. Supervision: Carlson, Westover, Aguirre, Higgins.
Conflict of Interest Disclosures: Dr Westover reported grants from the National Institutes of Health during the conduct of the study. Dr Aguirre reported grants from the CRICO Risk Management Foundation during the conduct of the study. Dr Higgins reported grants from the One Brave Idea Initiative and grants from Fast Grants at the Mercatus Center, George Mason University during the conduct of the study. No other disclosures were reported. Funding/Support: This work was supported by grants from the One Brave Idea Initiative and from Fast Grants at the Mercatus Center, George Mason University (Dr Higgins); grants from the CRICO Risk Management Foundation (Drs Westover and Aguirre); the Glenn Foundation for Medical Research and American Federation for Aging Research Breakthroughs in Gerontology Grant (Dr Westover); the American Academy of Sleep Medicine Foundation Strategic Research Award (Dr Westover), the Football Players Health Study grant at Harvard University (Dr Westover); a subcontract from Moberg ICU Solutions, Inc through the US Department of Defense (Dr Westover); and the following NIH grants: 1R01NS102190, 1R01NS102574, 1R01NS107291, and 1RF1AG064312 (Dr Westover).
Role of the Funder/Sponsor: The funders had no role in the design and conduct of the study; collection, management, analysis, and interpretation of the data; preparation, review, or approval of the manuscript; and decision to submit the manuscript for publication.
REFERENCES
1. Wang D, Hu B, Hu C, et al. Clinical characteristics of 138 hospitalized patients with 2019 novel coronavirus-infected pneumonia in Wuhan, China. JAMA. 2020;323(11):1061-1069. doi:10.1001/jama.2020.1585
2. Grasselli G, Zangrillo A, Zanella A, et al; COVID-19 Lombardy ICU Network. Baseline characteristics and outcomes of 1591 patients infected with SARS-CoV-2 admitted to ICUs of the Lombardy region, Italy. JAMA. 2020; 323(16):1574-1581. doi:10.1001/jama.2020.5394
3. Guan WJ, Ni ZY, Hu Y, et al; China Medical Treatment Expert Group for Covid-19. Clinical characteristics of coronavirus disease 2019 in China. N Engl J Med. 2020;382(18):1708-1720. doi:10.1056/NEJMoa2002032
4. Zhou F, Yu T, Du R, et al. Clinical course and risk factors for mortality of adult inpatients with COVID-19 in Wuhan, China: a retrospective cohort study. Lancet. 2020;395(10229):1054-1062. doi:10.1016/S0140-6736(20)30566-3
5. Malka R, Delgado FF, Manalis SR, Higgins JM. In vivo volume and hemoglobin dynamics of human red blood cells. PLoS Comput Biol. 2014;10(10):e1003839. doi:10.1371/journal.pcbi.1003839
6. Higgins JM, Mahadevan L. Physiological and pathological population dynamics of circulating human red blood cells. Proc Natl Acad Sci U S A. 2010;107(47):20587-20592. doi:10.1073/pnas.1012747107
7. Cohen RM, Franco RS, Khera PK, et al. Red cell life span heterogeneity in hematologically normal people is sufficient to alter HbA1c. Blood. 2008;112(10):4284-4291. doi:10.1182/blood-2008-04-154112
8. Patel HH, Patel HR, Higgins JM. Modulation of red blood cell population dynamics is a fundamental homeostatic response to disease. Am J Hematol. 2015;90(5):422-428. doi:10.1002/ajh.23982
9. Anderson JL, Ronnow BS, Horne BD, et al; Intermountain Heart Collaborative (IHC) Study Group. Usefulness of a complete blood count-derived risk score to predict incident mortality in patients with suspected cardiovascular disease. Am J Cardiol. 2007;99(2):169-174. doi:10.1016/j.amjcard.2006.08.015
10. Felker GM, Allen LA, Pocock SJ, et al; CHARM Investigators. Red cell distribution width as a novel prognostic marker in heart failure: data from the CHARM Program and the Duke Databank. J Am Coll Cardiol. 2007;50 (1):40-47. doi:10.1016/j.jacc.2007.02.067
11. Perlstein TS, Weuve J, Pfeffer MA, Beckman JA. Red blood cell distribution width and mortality risk in a community-based prospective cohort. Arch Intern Med. 2009;169(6):588-594. doi:10.1001/archinternmed. 2009.55
12. Topaz G, Kitay-Cohen Y, Peled L, et al. The association between red cell distribution width and poor outcomes in hospitalized patients with influenza. J Crit Care. 2017;41:166-169. doi:10.1016/j.jcrc.2017.05.014
13. Karagoz E, Ulcay A, Tanoglu A, et al. Clinical usefulness of mean platelet volume and red blood cell distribution width to platelet ratio for predicting the severity of hepatic fibrosis in chronic hepatitis B virus patients. Eur J
Gastroenterol Hepatol. 2014;26(12):1320-1324. doi:10.1097/MEG.0000000000000203
14. Patel KV, Ferrucci L, Ershler WB, Longo DL, Guralnik JM. Red blood cell distribution width and the risk of death in middle-aged and older adults. Arch Intern Med. 2009;169(5):515-523. doi:10.1001/archinternmed.2009.11
15. Patel KV, Semba RD, Ferrucci L, et al. Red cell distribution width and mortality in older adults: a meta-analysis.
J Gerontol A Biol Sci Med Sci. 2010;65(3):258-265. doi:10.1093/gerona/glp163
16. Salvagno GL, Sanchis-Gomar F, Picanza A, Lippi G. Red blood cell distribution width: A simple parameter with multiple clinical applications. Crit Rev Clin Lab Sci. 2015;52(2):86-105. doi:10.3109/10408363.2014.992064
17. Chaudhury A, Miller GD, Eichner D, Higgins JM. Single-cell modeling of routine clinical blood tests reveals transient dynamics of human response to blood loss. Elife. 2019;8:e48590. doi:10.7554/eLife.48590
18. Muhlestein JB, Lappe DL, Anderson JL, et al. Both initial red cell distribution width (RDW) and change in RDW during heart failure hospitalization are associated with length of hospital stay and 30-day outcomes. Int J Lab
Hematol. 2016;38(3):328-337. doi:10.1111/ijlh.12490
19. Golub MS, Hogrefe CE, Malka R, Higgins JM. Developmental plasticity of red blood cell homeostasis. Am J
Hematol. 2014;89(5):459-466. doi:10.1002/ajh.23666
20. Raifman MA, Raifman JR. Disparities in the population at risk of severe illness from COVID-19 by race/ethnicity and income. Am J Prev Med. 2020;59(1):137-139. doi:10.1016/j.amepre.2020.04.003
21. Stokes EK, Zambrano LD, Anderson KN, et al. Coronavirus disease 2019 case surveillance—United States, January 22-May 30, 2020. MMWR Morb Mortal Wkly Rep. 2020;69(24):759-765. doi:10.15585/mmwr.mm6924e2
22. Price-Haywood EG, Burton J, Fort D, Seoane L. Hospitalization and mortality among black patients and white patients with COVID-19. N Engl J Med. 2020;382(26):2534-2543. doi:10.1056/NEJMsa2011686
23. Millett GA, Jones AT, Benkeser D, et al. Assessing differential impacts of COVID-19 on black communities. Ann
Epidemiol. 2020;47:37-44. doi:10.1016/j.annepidem.2020.05.003
24. Freeman J, Goldmann DA, McGowan JE Jr. Methodologic issues in hospital epidemiology. IV. Risk ratios, confounding, effect modification, and the analysis of multiple variables. Rev Infect Dis. 1988;10(6):1118-1141. doi: 10.1093/clinids/10.6.1118
25. US Census Bureau. Massachusetts Census—quick facts. Accessed August 24, 2020.https://www.census.gov/
quickfacts/MA
26. Pan Y, Ye G, Zeng X, et al. Can routine laboratory tests discriminate SARS-CoV-2-infected pneumonia from other causes of community-acquired pneumonia? Clin Transl Med. 2020;10(1):161-168. doi:10.1002/ctm2.23
27. Mei Y, Weinberg SE, Zhao L, et al. Risk stratification of hospitalized COVID-19 patients through comparative studies of laboratory results with influenza. EClinicalMedicine. Published online July 30, 2020. doi:10.1016/j.eclinm. 2020.100475
28. Wang C, Deng R, Gou L, et al. Preliminary study to identify severe from moderate cases of COVID-19 using combined hematology parameters. Ann Transl Med. 2020;8(9):593. doi:10.21037/atm-20-3391
29. Gong J, Ou J, Qiu X, et al. A tool to early prediction of severe corona virus disease 2019 (COVID-19): a multicenter study using the risk nomogram in Wuhan and Guangdong, China. Clin Infect Dis. 2020;71(15): 833-840. doi:10.1093/cid/ciaa443
30. Lu G, Wang J. Dynamic changes in routine blood parameters of a severe COVID-19 case. Clin Chim Acta. 2020; 508:98-102. doi:10.1016/j.cca.2020.04.034
31. Vaid A, Somani S, Russak AJ, et al. Machine learning to predict mortality and critical events in COVID-19 positive New York City patients. medRxiv. Preprint posted online April 28, 2020. doi:10.1101/2020.04.26.20073411
32. Spiezia L, Boscolo A, Poletto F, et al. COVID-19-related severe hypercoagulability in patients admitted to intensive care unit for acute respiratory failure. Thromb Haemost. 2020;120(6):998-1000. doi: 10.1055/s-0040-1710018
33. Connors JM, Levy JH. COVID-19 and its implications for thrombosis and anticoagulation. Blood. 2020;135(23): 2033-2040. doi:10.1182/blood.2020006000
SUPPLEMENT.
eFigure 1. Cohort exclusion diagram
eTable 1. Age and RDW-stratified mortality rates upon discharge at MGH and BWH eFigure 2. Age and RDW-stratified mortality curves at Massachusetts General Hospital eFigure 3. Age and RDW-stratified mortality curves at Brigham and Women’s Hospital eFigure 4. Age and RDW-stratified mortality curves, censoring patients upon hospital discharge eTable 2. Multivariate Cox proportional-hazards analysis stratified by age
eTable 3. Multivariate Cox proportional-hazards analysis including common comorbidities eTable 4. Cox proportional-hazards analysis including blood count measures
eFigure 5. Mean MCV trajectories for inpatients, stratified by RDW and mortality