DOI 10.1007/s00442-013-2720-x METHODS
A field facility to simulate climate warming and increased
nutrient supply in shallow aquatic ecosystems
Jes Hines · Arne Hammrich · Daniel Steiner · Mark O. Gessner
Received: 23 January 2013 / Accepted: 17 June 2013 / Published online: 9 July 2013 © Springer-Verlag Berlin Heidelberg 2013
Excess nitrogen supply enhanced nitrate concentra-tions especially in winter when it was associated with increased concentration of ammonium and dissolved organic carbon. Nitrogen also reduced dissolved oxygen concentrations, particularly in the summer. Importantly, by stimulating biological activity, warming enhanced the nitrogen uptake capacity of the wetland during the winter, emphasizing the need for multifactorial global change experiments that examine both warming and nitrogen loading in concert. Establishing similar experi-ments across broad environmental gradients holds great potential to provide robust assessments of the impacts of climate change on shallow aquatic ecosystems.
Keywords Enclosure · Global change · Lake · Multiple
stressors · Mesocosm · Nitrogen loading · Climate warming · Wetland
Abstract Global warming and excess nitrogen
depo-sition can exert strong impacts on aquatic populations, communities, and ecosystems. However, experimental data to establish clear cause-and-effect relationships in naturally complex field conditions are scarce in aquatic environments. Here, we describe the design and per-formance of a unique outdoor enclosure facility used to simulate warming, increased nitrogen supply, and both factors combined in a littoral freshwater wetland dominated by common reed, Phragmites australis. The experimental system effectively simulated a 2.8 °C climate warming scenario over an extended period, cap-turing the natural temperature variations in the wetland at diel and seasonal scales with only small deviations.
Communicated by Robert Hall.
Electronic supplementary material The online version of this article (doi:10.1007/s00442-013-2720-x) contains supplementary material, which is available to authorized users.
J. Hines · A. Hammrich · D. Steiner · M. O. Gessner Department of Aquatic Ecology, Eawag: Swiss Federal Institute of Aquatic Science and Technology, Dübendorf and Kastanienbaum, Switzerland
J. Hines (*) · M. O. Gessner (*) Department of Experimental Limnology,
Leibniz Institute of Freshwater Ecology and Inland Fisheries (IGB), Alte Fischerhütte 2, Stechlin, Germany
e-mail: [email protected] M. O. Gessner
e-mail: [email protected] J. Hines
Smithsonian Environmental Research Center, Edgewater, MD, USA
A. Hammrich · M. O. Gessner
Institute of Integrative Biology (IBZ), ETH Zurich, Zurich, Switzerland
Present Address: A. Hammrich
DHI-WASY, Max-Planck-Str. 6, Syke, Germany M. O. Gessner
Department of Ecology, Berlin Institute of Technology (TU Berlin), Berlin, Germany
Introduction
Concentrations of atmospheric trace gases have increased since the mid-nineteenth century (Canadell et al. 2007; Compton et al. 2011; Townsend et al. 2003), resulting in warming of the earth’s surface (Livingstone and Padisak
2007; Rowlands et al. 2012; Solomon et al. 2007). Projec-tions indicate that warming will continue, and temperatures are likely to fall within the range of warming categorized as dangerous anthropogenic interference (2.4 °C; range 1.4– 4.3 °C) by the end of this century (Ramanathan and Feng
2008). Simultaneously, humans have greatly increased the bioavailability of nutrients, especially nitrogen, leading to increased anthropogenic N deposition (Galloway et al.
2008; Vitousek et al. 1997). Inland waters are particularly susceptible to increases in nutrient supply, because they receive mobile ions such as nitrate from their catchments at rates that far exceed those of direct atmospheric nitrogen deposition alone (Carpenter et al. 1998; Schindler 2006). Because temperature and nutrients are key in determining biological reaction rates and resource allocation, and trends in global changes are projected to continue over the next century (Solomon et al. 2007), both warming and increased nitrogen supply will affect aquatic communities in the future. However, the magnitude of impacts, the underlying mechanisms, and the ability of aquatic ecosystems to buffer them may differ from those in terrestrial ecosystems where climate change effects have received much greater attention in experiments (Aronson and McNulty 2009; Morgan et al.
2011).
Uncertainty about the ecological consequences of cli-mate warming is, in part, due to three limitations. First, the broad range of mechanisms by which climate can simul-taneously affect multiple levels of ecological organization make it difficult to forecast ecological responses to global change without performing whole-system manipulations (Bellard et al. 2012; Woodward et al. 2010). Secondly, many of the key findings regarding the impacts of climate change have been based on correlative approaches examin-ing particular responses through space or time (Dunne et al.
2004; Jeppesen et al. 2005; Lutz et al. 2012). Although these studies have increased awareness of ecological effects of climate, they fall short of distinguishing between how adaptations to differing climate conditions that develop over long time periods (e.g., along a latitudinal gradient) may differ from rapid responses to contemporary climate change (Dunne et al. 2004). Finally, among the few experi-ments in aquatic ecosystems that have simulated future cli-mate conditions in the field, there is a strong bias towards manipulating single factors (Wernberg et al. 2012; but see Christensen et al. 2006; Greig et al. 2012), which may not correctly estimate the magnitude, or even direction, of effects caused by multiple stressors acting in concert
(Langley and Megonigal 2010; Vinebrooke et al. 2004). Thus, there is a strong need for experiments examining the impact of climate warming and other factors in combina-tion (Jeppesen et al. 2010; Mikkelsen et al. 2008; Wernberg et al. 2012).
Here, we describe an experimental enclosure facility designed to test for effects of warming and increased nitro-gen supply in shallow aquatic ecosystems. There is a long tradition of using enclosures in aquatic science (e.g., Libo-riussen et al. 2005; Lund and Reynolds 1982; McKee et al.
2003; O’Reilly et al. 2003; Shurin et al. 2012). However, the facilities used to assess climate change effects usually rely on closed-bottomed containers, sometimes stocked with sediments and organisms (but see Baulch et al. 2005). Experimental approaches that use intact benthic communi-ties take another step toward capturing realistic impacts of global changes in shallow aquatic ecosystems. Therefore, our objectives here are (1) to provide technical details of a facility designed to simulate warming and increased nitro-gen supply in naturally complex field conditions, and (2) to document the performance of the facility. The combination of its natural field setting, its temperature control account-ing for natural fluctuations, and its multifactor design make the facility particularly useful for assessing a wide variety of population, community, and ecosystem responses to global change.
Materials and methods
Experimental design
To examine the main and interactive effects of warming and increased nitrogen supply on a shallow aquatic eco-system we established a 2 × 2 factorial experiment using a randomized complete block design in a Phragmites marsh on the shore of Lake Hallwil (47°17′N, 8°14′E)
at 449 m above sea level on the Swiss Plateau. A block design was chosen to account for potential spatial hetero-geneity at the experimental site and thus increase sensi-tivity of the statistical analysis (Scheiner and Gurevitch
2001). Each of four spatial blocks consisted of four treat-ments established in enclosures: unmanipulated control, warming, increased nitrogen supply, and warming and increased nitrogen supply combined. Additionally, each block included an unenclosed control plot of identical size. These five treatments allowed us to use a completely balanced factorial treatment structure to test for the effects of two global change factors (warming and nitrogen sup-ply), and it also allowed us to use an a priori contrast to test for possible experimental artefacts caused by the unmanipulated control enclosures compared to ambient conditions in the unenclosed marsh. In total, the facility
consisted of 16 enclosures and 4 unenclosed control plots (Fig. S1).
Enclosure construction and maintenance
Enclosures were made of two uncolored polypropylene cyl-inders pushed into the sediment and supported by a rebar and metal frame (Fig. S2). We chose polypropylene because this material is inert, environmentally friendly, flexible, and still strong enough to make the enclosures resistant to damage by waves and storms. Although the uncolored polypropylene is more sensitive to UV light than black material, we chose it because we intended to alter the light intensity in the enclosures as little as possible (Fig. S2a). To minimize lateral heat loss, an inner cylinder (142 cm in diameter) was nested in an outer one (152 cm in diameter) (Fig. S2b). Both had a wall thickness of 5 mm. To prevent sediment erosion, a ring of sandbags was piled around the outer enclosure walls and between the inner and outer cyl-inders (Fig. S2a, b). Mean water depth in the enclosures was 40 cm but it varied by up to 40 cm throughout the year according to the fluctuations of the lake water level. Since waves from passing boats and storm surges can exceed half a meter, the enclosure walls required an additional safety margin. Thus, the height of the enclosures of 120 cm was a compromise between structural support, flood protection, and least possible alteration of the light intensity inside the enclosures. When taller walls are needed during excep-tional floods, it is possible to place extension rings on the base rings.
The open-ended enclosures were pushed about 20 cm into the sediment, which limited some natural water exchange with the marsh (Fig. S2b). Therefore, we par-tially replaced water in the enclosures once a month using two pumps (OKAY 900 Niro; 60 l min−1, 20 min simulta-neous operation): one to pump marsh water into the enclo-sure, the other to pump water out of the enclosure. The pumps had a 1.5-mm filter that prevented larger inverte-brates and particles from moving into and out of the enclo-sures. This experimental water exchange was designed to replace roughly half of the water volume in the enclosures each month, but the residence time was still higher than in the open marsh where water exchange is likely to occur at least daily.
Temperature control
To establish the temperature treatment, we used active warming with electric heaters. Three or four aquarium heaters designed for koi ponds were placed in tubular PVC housing (diameter 11 cm) and mounted on a styrofoam float. Technical details regarding suppliers of all electrical parts are summarized in Table S1. A tube attached to an air
pump supplied a current of air at 2.5 l min−1 (Fig. S2b), which facilitated heat distribution from the hot surfaces of the heaters. To minimise the build-up of temperature and chemical gradients, the air pumps ran continuously in all enclosures, heated and unheated.
The power required to supply the heaters and pumps was 15,000 kW h year−1. The AC current came from a ground-fault protected power supply to an equipment house on the shore (Fig. S1). The power line ran from the central circuit breaker box at the equipment house to a series of three intermediate circuit breaker boxes that were connected by power cables (Table S1) suspended in trees along the shore (Fig. S1). Power cables connected the intermediate circuit boxes to the control units for each enclosure, where an additional circuit breaker was installed (Fig. S1).
To assure that the warming treatment paralleled the nat-ural temperature fluctuations, warmed and control enclo-sures were physically paired, and the ambient target tem-perature was measured in the marsh between enclosure pairs (Fig. S1). Each pair was controlled by signals from three platinum thermocouples (Table S1) placed at the sedi-ment surface of the two enclosures and in the open marsh between them (Fig. S3a). The signal from the thermocouple was received by a cold junction compensator and amplified to 24 V AC by a signal conditioner before it was sent to a programmable temperature controller (Fig. S3). The con-troller sent a logic signal to a modular magnetic switch that turned the heaters on when the temperature in the enclo-sures was below the target temperature (i.e. ambient water temperature +4 °C), and switched heaters off when the tar-get temperature was exceeded (Fig. S3). The current sup-ply to the conditioner was reduced from 230 to 24 V AC by a step-down transformer. All other components were sup-plied with 230 V current (Fig. S3).
To record temperature, two waterproof data loggers (Hobo Tidbit; Onset, Bourne, MA, USA) were placed on opposite sides of each experimental plot. The loggers were accurate to ±0.2 °C at 20 °C, and recorded temperature at 1-hour intervals. This allowed us to assess differences in temperatures within each plot, as well as the effective-ness of temperature control at three temporal scales: mean monthly temperature, mean daily temperature, and mean annual temperature for each hour of the day.
Nitrogen supply
A total of 22.5 g N (14.2 g N m−2) was applied annually to enclosures receiving increased nitrogen supply. Precipita-tion events throughout the year are associated with pulsed increases in nitrogen input, although the magnitude and timing of these inputs changes from year to year (Depart-ment of Civil Engineering, Transportation and Environ-ment, Canton of Argovia, Switzerland, unpublished data).
Each addition, therefore, simulated a nitrogen pulse equiva-lent to five times the ambient concentration, which broadly corresponds with increased nitrogen loads observed in northern temperate lakes affected by anthropogenic N dep-osition (Elser et al. 2009). As a result, the predetermined amounts of added N varied throughout the year accord-ing to the natural fluctuation of nitrogen concentration in the lake: January 2.9 g, February 2.9 g, March 4.0 g, April 4.0 g, May 1.9, June 1.0 g, July 0.9 g, August 0.9 g, Sep-tember 0.9 g, October 0.9 g, November 0.3 g, and Decem-ber 1.9 g. Nitrogen was added monthly as calcium nitrate [Ca(NO3)2 × 4H2O] dissolved in marsh water. Because
the average ambient surface water concentration of cal-cium monitored in Lake Hallwil from 1997 to 2011 was 37.6 ± 9.2 mg/l (mean ± SD; n = 46) (Canton of Argovia, unpublished data), our additions (0.5–2.6 mg Ca/l) repre-sented <1–5 % of the ambient concentration, minimizing changes in water chemistry other than nitrate.
Nine physico-chemical variables were measured monthly to assess variation in water chemistry and effects of experimental treatments. Dissolved oxygen concentra-tions were measured in situ with a portable probe (Hach HQ40d; Loveland, CO, USA). Dissolved organic carbon (DOC) in filtered water samples (0.45-μm cellulose ace-tate filters) was acidified and later analysed on a TOC ana-lyser (Shimadzu TOC-V CPH, Kyoto, Japan) (Buesing and Gessner 2006). Conductivity and concentrations of nitrate, ammonium and soluble reactive phosphorus (SRP) were also determined on filtered water samples (DEV 2012), whereas unfiltered water was used to measure pH and total alkalinity (titration to pH 4.3; Metrohm 809; Titrando, Zofingen, Switzerland).
Statistical analysis
We used repeated-measures ANOVA to evaluate the main and interactive effects of warming and nitrogen supply on water temperature and chemistry (Proc Mixed, SAS; Scheiner and Gurevitch 2001). Initially, the five treatments (unenclosed control, enclosed control, warming, increased nitrogen supply, and warming and increased nitrogen sup-ply in combination), time, and treatment × time interac-tion were considered fixed effects. Subsequently, upon finding significant treatment effects, we took advantage of the fully crossed design to assess the main and inter-active effects of warming and increased nitrogen supply (SAS 2002). We also used a priori contrasts to evaluate differences between the unenclosed and enclosed controls (SAS 2002). For all comparisons, spatial block was mod-eled as a random source of variation where significant. In a repeated-measures analysis, multiple measurements taken on the same experimental unit are assumed to be correlated with each other. The structure of the relationship between
repeated measurements is described by a variance–covar-iance matrix. We used a compound symmetry varvariance–covar-iance– covariance structure which assumes that all variances are equal to each other, and all covariances are also equal to one another, because this covariance structure allowed model convergence (Scheiner and Gurevitch 2001). The Kenward–Roger option was used to calculate denominator degrees of freedom because this approach allows for flex-ibility of error structure when multiple factors (i.e. spatial blocks and repeated measures) are considered as random effects (Kenward and Roger 1997). To assure that all data met assumptions of the repeated-measures analysis of vari-ance, prior to analysis we used three test statistics, Shap-iro–Wilk’s, Levene’s, and Mauchly’s, to test for normal-ity of residuals, homogenenormal-ity of variance, and sphericnormal-ity, respectively.
Results and discussion
Evaluation of the enclosure facility
Differences in experimental approaches to assess effects of climate warming either alone or in combination with other factors of global change can be evaluated based on three general, non-exclusive criteria: (1) ability of the facility to capture ecological complexity and hence realism, (2) extent to which experimental treatments such as temperature warming and increased nutrient concentration can be main-tained, and (3) expense of constructing and maintaining the facility.
When deciding on mesocosm design, a trade-off exists between highly simplified, well-controlled, and easily rep-licated experimental units, such as laboratory Petri dishes, and large outdoor experimental units that capture most of the biotic and structural complexity of natural ecosys-tems. The use of flow-through tanks and land-based meso-cosms with closed bottoms can increase uniformity among experimental units and facilitate replication of treatment combinations (Feuchtmayr et al. 2009; Liboriussen et al.
2005; McKee et al. 2003). Although experiments that rely on stocked sediments and organisms have produced valu-able results (Feuchtmayr et al. 2009; Liboriussen et al.
2005; Shurin et al. 2012), our facility built directly in the field on undisturbed sediments and root zones of emergent vegetation is a notable step closer to capturing the environ-mental conditions and ecological complexity of the natu-ral ecosystem, thus increasing realism of experiments in a manner similar to that of free-air CO2 enrichment (FACE) compared to open-top chamber experiments in terrestrial ecosystems (Machácˇová 2010).
The level of replication we could achieve was lim-ited by the size of the enclosures compared to the spatial
extent of the reed stand along the shoreline, and due to the depth of the water which limited the distance that the marsh extended into the lake. Our experience from peri-ods of high water levels suggests that the system is likely to work well in all marshes where water levels are com-monly below 1 m. Further, there is no a priori reason not to use a similar system in deeper water. This would be useful because some emergent wetland vegetation, includ-ing P. australis, can extend to depths of up to 2 m, and floating-leaved and submerged macrophytes can extend to even greater depths. However, in much deeper water, additional considerations come into play. These include stratification of the water column, depth-to-width ratios of the enclosures, and rapidly increasing water volumes that quickly incur prohibitively high heating costs as water volumes increase. From a practical point of view, flexible curtains are likely to be more convenient in deep water compared to the relatively stiff polyethylene tubes that we used. However, the principle of double walls, which uses the water volume between the inner and outer wall, or curtain, as an insulating medium could still be applied. Riebesell et al. (2010) provide much useful information for establishing mesocosm facilities in deeper water, mainly based on pelagic marine systems without sediment contact.
The replication we could achieve was also limited by the manpower needed to maintain our facility for a year-round field season. Using a canoe to access the experimental units ensured minimal disturbance of the vegetation, but was a big time investment. If local authorities grant permission, it would be possible to greatly reduce the manpower needed to visit the enclosures by building boardwalks across the length of the marsh. Although more invasive than canoe traffic, boardwalks have proved efficient at other experi-mental climate-change facilities in wetlands (Langley et al.
2009).
The key aspect of our experimental set-up was the temperature manipulation. Often, warming experiments heat to a constant temperature, which can be sufficient over short periods or when temperature fluctuations are small. It is clear, however, that temperature fluctuations alone can notably affect communities and ecosystem pro-cesses (e.g., Dang et al. 2009), suggesting that mimick-ing natural temperature variation is an important aspect to consider in climate-warming experiments. Our sys-tem using toggling electronic controllers captured the essence of natural temperature variation and was pow-erful enough to raise water temperature consistently above ambient at monthly, daily, and hourly time scales (Fig. 1a–d). Exceptions occurred when partial equip-ment failure reduced warming in some enclosures during August, September, November, and December (warm-ing × time: F11,165 = 2.94, p = 0.001). Furthermore,
water in the unenclosed control plots heated and cooled at predictable times during the day (lowest temperatures at 0700 hours, highest at 1600 hours; Fig. 1d). In con-trast, to maintain target temperatures in the enclosures, the heaters turned on and off as needed at irregular intervals, which slightly increased overall temperature variation, and reduced the range of hourly temperatures (Fig. 1d). Warming also increased small-scale tempera-ture heterogeneity, as indicated by increased differences between pairs of temperatures loggers within heated enclosures (warming: F1,141 = 5.00, p = 0.02; Table S2; Fig. 1e). Nonetheless, experimental warming increased the average monthly temperature by 2.8 °C (warming:
F1,15 = 150.8, p < 0.0001; Table S2, Fig. 1b). Thus, the
facility enabled tight temperature control over the sea-sonal and daily time scale.
Notably, the target maximum temperature increase of 4 °C in heated enclosures was not perfectly reached. Because our warming treatment was equally effec-tive across a broad range of temperatures (i.e. 4–20 °C; Fig. 1a, b) and water chemistry conditions (Figs. 2, 3) throughout the year, environmental conditions appar-ently did not limit the magnitude of our warming treat-ment. Less than maximum heating could be caused by spatial distance between the placement of the tempera-ture loggers and the temperatempera-ture sensors, which could be improved by using average temperatures taken from multiple sensors. Alternatively, less than maximum tem-perature increase might be caused by inefficiencies of the system. A simple remedy in this case would be to increase the magnitude of the warming effect by programming controllers with a slightly higher target temperature than is effectively desired.
Heavy reliance on electrical and electronic components as in our system would also be difficult to implement in remote places where power supply is a crucial issue to consider. Additionally, the multiple electronic parts sub-jected to harsh outdoor conditions required weekly main-tenance, necessitating a technician dedicated to this effort. Power consumption for electrical heating could be miti-gated by using heat pumps, which would increase electri-cal energy efficiency roughly threefold but constitute an additional financial investment. One other alternative has been used in an experiment involving a warming treatment in a natural shallow water body by pumping hot water through coils installed at the base of enclosures (Baulch et al. 2003, 2005). This method was effective at raising temperatures 4.5 °C on average. However, it used more than ten times the amount of energy as our system (Baulch et al. 2003, 2005). Thus, provided that sufficient power can be supplied on site, our electrical heating method was not only effective and convenient but also reasonably energy-efficient.
Response of water chemistry
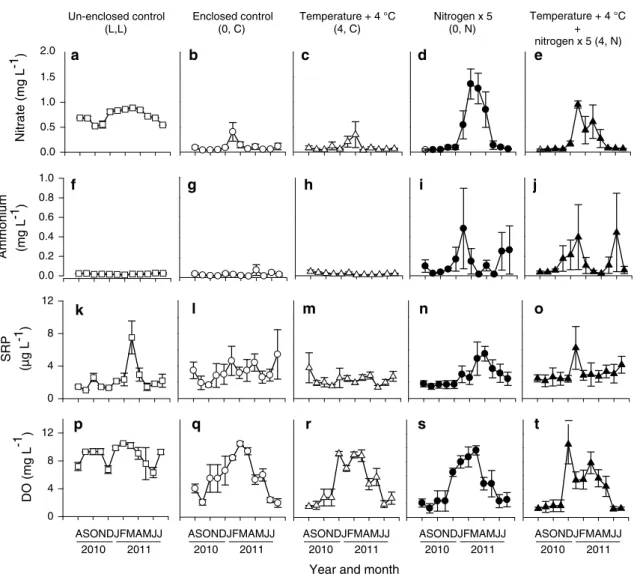
Our monthly nitrate additions simulated increases in nitro-gen supply throughout the year, and resulted in a range of nitrate enrichments from 0.39 to 4.40 mg N L−1 (Fig. 2d, e). Nitrogen supply was depleted after monthly nitrate addition in the summer, but concentrations remained above ambient during winter. The greatest increase occurred between November and April in ambient temperature plots (warming × nitrogen × time: F1,15 = 2.48, p = 0.007;
nitrogen: F1,15 = 16.6, p = 0.001; Table S3; Fig. 2d, e).
Seasonal variation in nitrate concentration suggests that nitrogen demand by plants (P. australis), algae, and/or heterotrophic microbes reduced nitrogen concentrations in the water column in summer, whereas low temperatures diminished biological activity, resulting in higher nutrient concentrations in winter. Notably, this effect was dimin-ished when increased nitrogen supply was accompanied by experimental warming (warming × nitrogen × time:
F1,15 = 2.48, p = 0.007; Fig. 2d vs. e), possibly because elevated temperature stimulated biological activity during winter, enhancing the ecosystem’s capacity to take up and
Fig. 1 Temperature in five experimental treatments (mean ± SEM, n = 4) at four different time frames: a monthly temperature; b monthly treat-ment effect on temperature; c daily temperature in March 2011; d mean annual tempera-ture for each hour of the day; e monthly difference between two temperature loggers submerged in each plot. Symbols show unenclosed controls (L,L: open square with solid line), enclosed controls (0,C: open circle with short dash line), warming (4,C: open triangle with long dash line), increased nitrogen supply (0,N: closed circle with dotted line), warming and increased nitrogen supply (4,N: closed triangle with dot-dot-long dash line)
Year and month Temperature effect size (treatment - control) -2
-1 0 1 2 3 4 5 Time (d) 0 5 10 15 20 25 30 Temperature (°C) 0 4 8 12 16 Time (h) 0 5 10 15 20 25 Temperature (°C ) 11 12 13 14 15 16
Year and month
Difference betw een temperature loggers (°C) 0.0 0.5 1.0 1.5 2.0 2.5
Year and month
Temperature (°C) 0 5 10 15 20 25 A S O N D J F M A M J J March 2011 2011 0 1 0 2 A S O N D J F M A M J J A S O N D J F M A M J J 2010 2011 2010 2011 c) c) a c d e b
process nitrogen. Therefore, while some experiments have previously simulated increased nitrogen supply during the plant growing season in marshes (e.g., Langley et al.
2009), we were also able to assess interactive effects of increased nitrogen supply and climate warming during the winter.
A second key feature of our nitrogen addition is that we simulated nitrogen pulses as expected during rainfall events instead of continuously elevated nutrient supplies. It must be noted, however, that our approach of monthly additions did not simulate the timing of naturally irregular rainfall events per se, but rather nutrient pulses as they would occur during such events. A similar approach has been taken to simulate nitrogen loading during tidal inundation of coastal marshes (Deegan et al. 2012). A continuous nitrogen supply could have been achieved by using slow-release fertilizers,
pumps, Mariotte bottles, or gauged electric pumps (Gulis et al. 2004; Hillebrand and Sommer 2000; Slavik et al.
2004). It would also be possible to use a combination of both approaches: an automated system triggered during rainfall could pulse nitrogen supply during times of natural inputs to lakes.
An intriguing outcome of our nitrogen enrichment is that, despite substantial amounts of nitrate added, consist-ent nitrate saturation did not occur (Fig. 2), suggesting an effective nitrate sink over extended periods. Indeed, nitrate concentrations were depleted in the enclosures compared to the unenclosed controls (Fig. 2a, b), suggest-ing a high nitrogen demand that could not be met in the enclosures disconnected from the open lake. Denitrifica-tion, which requires anoxic conditions and a supply of organic carbon, is the most obvious process to account Enclosed control
(0, C) Temperature + 4 °C(4, C) Nitrogen x 5(0, N) Temperature + 4 °C+ nitrogen x 5 (4, N) Un-enclosed control (L,L) Nitrate (mg L-1 ) 0.0 0.5 1.0 1.5 2.0 Ammonium (mg L-1 ) 0.0 0.2 0.4 0.6 0.8 1.0 SR P (µg L-1 ) 0 4 8 12 DO (mg L -1 ) 0 4 8 12 ASONDJFMAMJJ 2010 2011 ASONDJFMAMJJ 2010 2011 ASONDJFMAMJJ 2010 2011 ASONDJFMAMJJ 2010 2011 ASONDJFMAMJJ 2010 2011
Year and month
a b c d e f k p q r s t l m n o g h i j
Fig. 2 Effect of five experimental treatments on water chemistry (mean ± SEM, n = 4) during August 2010 to July 2011: a–e nitrate, f–j ammonium, k–o soluble reactive phosphorus (SRP), p–t dissolved oxygen (DO). Symbols show unenclosed control (L,L: open square),
enclosed control (0,C: open circle), warming (4,C: open triangle), increased nitrogen supply (0,N: closed circle), and warming and increased nitrogen supply (4,N: closed triangle)
for this observation. Although the water column never went anoxic during our monthly measurements during the daytime, nitrate additions clearly reduced concentrations of dissolved oxygen (F1,15 = 7.60, p = 0.01; Table S3; Figs. 2, 3). Strong declines in dissolved oxygen concen-trations between June and November (Fig. 2p–t) broadly corresponded with the seasonal pattern of nitrate con-centrations (Fig. 2a–e). In further support of the deni-trification hypothesis, the marsh sediments are anoxic at about 5 mm below the surface (Buesing and Gessner
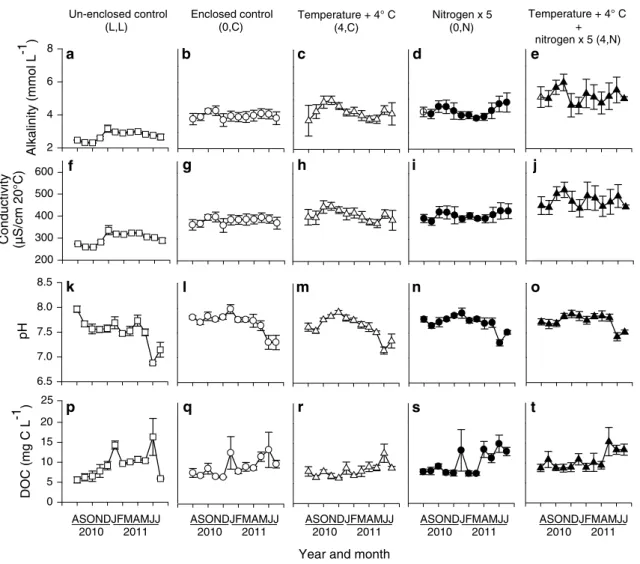
2006), and circumstantial evidence suggests that anoxic conditions in the lower water column might also have occurred occasionally during night-time (see below). Although there were few corresponding changes in DOC, which would further support the denitrification hypoth-esis (Fig. 3s, t), carbon was unlikely to be limiting for
denitrification given the high heterotrophic activity (Bues-ing and Gessner 2006) and abundance of both particulate organic matter (Buesing and Gessner, unpublished data) and DOC (Fig. 3; Table S3) in the marsh. Nevertheless, nitrate addition also resulted in elevated concentrations of ammonium (nitrogen: F1,15 = 8.30, p = 0.01; Fig. 2f–j), supporting an alternative hypothesis that assimilatory nitrogen reduction or dissimilatory nitrate reduction to ammonium (Burgin and Hamilton 2007) also diminished nitrate concentrations, at least in part. Further evaluation by using stable isotope tracers such as 15NO
3− would be a
powerful approach to tease apart the relative contributions of these pathways (Burgin and Hamilton 2007; Megonigal et al. 2004).
An evident limitation of our experimental set-up, as with any aquatic enclosure facility, was limited water
DOC (mg C L -1 ) 0 5 10 15 20 25 Enclosed control (0,C) Temperature + 4° C(4,C) Nitrogen x 5(0,N) Temperature + 4° C + nitrogen x 5 (4,N) Un-enclosed control (L,L) Alkalinity (mmol L -1 ) 2 4 6 8 Conductivity (µS/cm 20°C) 200 300 400 500 600 pH 6.5 7.0 7.5 8.0 8.5 2010 2011 ASONDJFMAMJJ 2010 2011 ASONDJFMAMJJ 2010 2011 ASONDJFMAMJJ 2010 2011 ASONDJFMAMJJ 2010 2011 ASONDJFMAMJJ
Year and month
a b g c d e h i j s t l m n o q r f k p
Fig. 3 Effect of five experimental treatments on water chemistry (mean ± SEM, n = 4) during August 2010 to July 2011: a–e alkalin-ity, f–j conductivalkalin-ity, k–o pH, p–t dissolved organic carbon (DOC). Symbols show unenclosed control (L,L: open square), enclosed
con-trol (0,C: open circle), warming (4,C: open triangle), increased nitro-gen supply (0,N: closed circle), and warming and increased nitronitro-gen supply (4,N: closed triangle)
exchange with the open marsh. Water chemistry variables that were sensitive to experimental and seasonal changes in climatic conditions were sometimes also sensitive to enclosure effects (i.e. nitrate, pH, alkalinity, conductiv-ity), although other variables such as ammonium and DOC did not differ between enclosed and unenclosed control plots (Figs. 2, 3; Table S3). The response of oxygen regimes leading periodically to hypoxic condi-tions is particularly noteworthy. Previously, we deployed optical oxygen probes (model ldo 101; Hach-Lange, Düsseldorf, Germany) and data loggers (model hq40d; Hach-Lange) in the enclosures to record oxygen concen-trations at 15-min intervals during four 3-day periods in different seasons (Jeppesen et al. 2010). These measure-ments indicated that anoxia was possible at night, at least during warmer months. Therefore, to mitigate any such enclosure effects, we continuously aerated all enclosures and also partially exchanged water at monthly intervals. Ideally, this artificial aeration would reduce anoxia and roughly mimic natural mixing of water driven by ther-mally induced convection. Spot measurements showed, however, that oxygen was still more depleted in the con-trol enclosures compared to the unenclosed concon-trol plots (Fig. 3; Table S3), particularly during the summer, reflect-ing intense heterotrophic metabolism in the marsh (Bues-ing and Gessner 2006).
Strong oxygen depletion during periods of high biologi-cal activity is common in marshes less tightly connected to an open water body than our littoral reed fringe. Therefore, although we did not perfectly mimic conditions in the sur-rounding marsh, the diminished oxygen concentrations in our enclosures are broadly consistent with conditions in many natural marshes (Odum 1988). Thus, overall, despite some differences in environmental conditions that devel-oped in enclosed and unenclosed controls, the design of our experimental field facility proved robust to a number of challenges encountered in shallow aquatic ecosystems, suggesting that the design of the experimental facility pre-sented here will allow for meaningful tests of the ecologi-cal consequences of climate warming and other factors of global change, preferably across multiple sites in coordi-nated experiments (Fraser et al. 2013).
Acknowledgments We are grateful to N. Buesing, M. Brosed, M.J. Daigo, M. da Silva Moretti, C.K. Dang, M. Döring, F. Erb, R. Fankhauser, M. Filippini, S. Flury, A. Frainer, P. Gäumann, S. Grob, A.H. Hines, D. Hohmann, S. Kamara, S. Käpelli, N. Kodama, A. Ivanovski, P. Madej, R. Illi and the AUA lab, A. Raffainer, M. Reyes, I. Rönning, M. Schindler, J. Sierra, A. Stöckli, N. Tschopp, Wenjing Xu, and numerous others for support, data, assistance with the design, and installation and/or operation of the facility. We also thank the Canton of Argovia for permission to access the site and data provi-sion, the Fisheries Sports Club Hallwilersee-Meisterschwanden for access to electricity, and the AEW Energie AG for partial sponsoring of electricity supply. This research was funded by the Swiss National
Science Foundation (SNF 32-63701.00 and 3100A0-108441) and the Swiss State Secretariat for Education and Research through the Euro-limpacs project supported under FP7 of the EU Commission.
References
Aronson EL, McNulty SG (2009) Appropriate experimental ecosys-tem warming methods by ecosysecosys-tem, objective, and practicality. Agric For Meteorol 149:1791–1799
Baulch HM et al (2003) Climate warming experiments: design of a mesocosm heating system. Limnol Oceanogr Method 1:10–15 Baulch HM, Schindler DW, Turner MA, Findlay DL, Paterson MJ,
Vinebrooke RD (2005) Effects of temperature on benthic com-munities in a boreal lake: implications of climate warming. Lim-nol Oceanogr 50:1377–1392
Bellard C, Bertelsmeier C, Leadley P, Thuiller W, Courchamp F (2012) Impacts of climate change on the future of biodiversity. Ecol Lett 15:365–377
Buesing N, Gessner MO (2006) Benthic bacterial and fungal produc-tivity and carbon turnover in a freshwater marsh. Appl Environ Microbiol 72:596–605
Burgin AJ, Hamilton SK (2007) Have we overemphasized the role of denitrification in aquatic ecosystems? A review of nitrate removal pathways. Front Ecol Environ 5:89–96
Canadell JG et al. (2007) Contributions to accelerating atmos-pheric CO2 growth from economic activity, carbon inten-sity, and efficiency of natural sinks. Proc Natl Acad Sci USA 104:18866–18870
Carpenter SR, Caraco NF, Correll DL, Howarth RW, Sharpley AN, Smith VH (1998) Nonpoint pollution of surface waters with phosphorus and nitrogen. Ecol Appl 8:559–568
Christensen MR, Graham MD, Vinebrooke RD, Findlay DL, Pater-son MJ, Turner MA (2006) Multiple anthropogenic stressors cause ecological surprises in boreal lakes. Glob Change Biol 12:2316–2322
Compton JE et al (2011) Ecosystem services altered by human changes in the nitrogen cycle: a new perspective for US decision making. Ecol Lett 14:804–815
Dang CK, Schindler M, Chauvet E, Gessner MO (2009) Temperature oscillation coupled with fungal community shifts can modulate warming effects on litter decomposition. Ecology 90:122–131 Deegan LA, Johnson DS, Warren RS, Peterson BJ, Fleeger JW,
Fagh-erazzi S, Wolheim WM (2012) Coastal eutrophication as a driver of salt marsh loss. Nature 490:388–394
DEV (2012) Deutsche Einheitsverfahren zur Wasser-, Abwasser- und Schlammuntersuchung. Wasserchemische Gesellschaft in the Gesellschaft Deutscher Chemiker und Normenausschuss Wasser-wesen (NAW). Beuth, Berlin
Dunne JA, Saleska SR, Fischer ML, Harte J (2004) Integrating experimental and gradient methods in ecological climate change research. Ecology 85:904–916
Elser JJ, Anderson T, Baron JS, Bergström A, Jansson M, Kyle M, Nydick KR, Steger L, Hessen DO (2009) Shifts in lake N:P stoi-chiometry and nutrient limitation driven by atmospheric nitrogen deposition. Science 326:835–837
Feuchtmayr H et al (2009) Global warming and eutrophication: effects on water chemistry and autotrophic communities in experimental hypertrophic shallow lake mesocosms. J Appl Ecol 46:713–723
Fraser LH, Henry HAL, Carlyle CN, White SR, Beierkuhnlein C, Cahill JF Jr, Casper BB, Cleland E, Collins SL, Dukes JS, Knapp AK, Lind E, Long R, Luo Y, Reich PB, Smith MD, Sternberg M, Turkington R (2013) Coordinated distributed experiments: an
emerging tool for testing global hypotheses in ecology and envi-ronmental science. Front Ecol Environ 11:147–155
Galloway JN et al (2008) Transformation of the nitrogen cycle: recent trends, questions, and potential solutions. Science 320:889–892 Greig HS, Kratina P, Thompson PL, Palen WJ, Richardson JS, Shurin
JB (2012) Warming, eutrophication, and predator loss amplify subsidies between aquatic and terrestrial ecosystems. Glob Change Biol 18:504–514
Gulis V, Rosemond AD, Suberkropp K, Weyers HS, Benstead JP (2004) The effect of nutrient enrichment on decomposition of wood and associated microbial activity in streams. Freshw Biol 49:1437–1447
Hillebrand H, Sommer U (2000) Effect of continuous nutrient enrich-ment on microalgae colonizing hard substrates. Hydrobiologia 426:185–192
Jeppesen E et al (2005) Lake responses to reduced nutrient loading— an analysis of contemporary long-term data from 35 case studies. Freshw Biol 50:1747–1771
Jeppesen E et al (2010) Interaction of climate change and eutrophica-tion. In: Kernan M, Battarbee R, Moss B (eds) Climate change impacts on freshwater ecosystems. Blackwell, Oxford, pp 119–151
Kenward MG, Roger JH (1997) Small sample inference for fixed effects from restricted maximum likelihood. Biometrics 53:983–997
Langley JA, Megonigal JP (2010) Ecosystem response to elevated CO2 levels limited by nitrogen-induced plant species shift. Nature 466:96–99
Langley JA, Sigrist MV, Duls J, Cahoon DR, Lynch JC, Megonigal JP (2009) Global change and marsh elevation dynamics: Exper-imenting where land meets sea and biology meets geology. In: Lang MA, MacIntyre IG, Rutyler K (eds) Proceedings of the Smithsonian Marine Sciences Symposium, vol 38. Smithsonian, Washington D.C., pp 391–400
Liboriussen L et al (2005) Global warming: design of a flow-through shallow lake mesocosm climate experiment. Limnol Oceanogr Method 3:1–9
Livingstone DM, Padisak J (2007) Large-scale coherence in the response of lake surface-water temperatures to synoptic-scale cli-mate forcing during summer. Limnol Oceanogr 52:896–902 Lund JWG, Reynolds CS (1982) The development and operation of
large limnetic enclosures in Blelham Tarn, English Lake District, and their contribution to phytoplankton ecology. In: Round FE, Chapman D (eds) Progess in Phycological Research, vol 1. Bio-press, Bristol, pp 1–65
Lutz BD, Mulholland PJ, Bernhardt ES (2012) Long-term data reveal patterns and controls on stream water chemistry in a forested stream: Walker Branch, Tennessee. Ecol Monogr 82:367–387 Machácˇová K (2010) Open top chamber and free air CO2
enrich-ment—approaches to investigate tree responses to elevated CO2. iForest Biogeosci For 3:102–105
McKee D et al (2003) Response of freshwater microcosm communi-ties to nutrients, fish, and elevated temperature during winter and summer. Limnol Oceanogr 48:707–722
Megonigal JP, Hines ME, Visscher P (2004) Anaerobic metabolism: linkages to trace gases and aerobic processes. In: Schlesinger WH (ed) Biogeochemistry. Elsevier-Pergamon, Oxford
Mikkelsen TN et al (2008) Experimental design of multifactor climate change experiments with elevated CO2, warming and drought: the CLIMAITE project. Funct Ecol 22:185–195
Morgan JA, LeCain DR, Pendall E, Blumenthal DM, Kimbal BA, Carrillo Y, Williams DG, Heisler-White J, Dijkstra FA, West M (2011) C4 grasses prosper as carbon dioxide eliminates desicca-tion in warmed semi-arid grassland. Nature 467:202–205 Odum WE (1988) Comparative ecology of tidal freshwater and salt
marshes. Annu Rev Ecol Syst 19:147–176
O’Reilly CM, Alin SR, Plisnier P, Cohen AS, McKee BA (2003) Cli-mate change decreases aquatic ecosystem productivity of Lake Tanganyika, Africa. Nature 424:766–768
Ramanathan V, Feng Y (2008) On avoiding dangerous anthropogenic interference with the climate system: Formidable challenges ahead. Proc Natl Acad Sci USA 105:14245–14250
Riebesell U, Lee K, Nejstgaard JC (2010) Pelagic mesocosms. Guide to best practices in ocean acidification research and data report-ing. Office of the European Union, Luxembourg, pp 81–98 Rowlands DJ et al (2012) Broad range of 2050 warming from an
observationally constrained large climate model ensemble. Nat Geosci 5:256–260
SAS (2002) SAS Institute, Cary NC, USA
Scheiner SM, Gurevitch J (2001) Design and analysis of ecological experiments. Oxford University Press, New York
Schindler DW (2006) Recent advances in the understanding and man-agement of eutrophication. Limnol Oceanogr 51:356–363 Shurin JB, Clasen JL, Greig HS, Kratina P, Thompson PL (2012)
Warming shifts top-down and bottom-up control of pond food web structure and function. Philos Trans R Soc Lond B 367:3008–3017
Slavik K, Peterson BJ, Deegan LA, Dowden WB, Hershey AE, Hob-bie JE (2004) Long-term responses of the Kuparuk River ecosys-tem to phosphorus fertilization. Ecology 85:939–954
Solomon S, et al (eds) (2007) Contribution of Working Group I to the Fourth Assessment Report of the Intergovernmental Panel on Cli-mate Change. Cambridge University Press, Cambridge
Townsend AR et al (2003) Human health effects of a changing global nitrogen cycle. Front Ecol Environ 1:240–246
Vinebrooke RD et al (2004) Impacts of multiple stressors on biodiver-sity and ecosystem functioning: the role of species co-tolerance. Oikos 104:451–457
Vitousek PM et al (1997) Human alteration of the global nitrogen cycle: sources and consequences. Ecol Appl 7:737–750
Wernberg T, Smale DA, Thomsen MS (2012) A decade of climate change experiments on marine organisms: procedures, patterns and problems. Glob Change Biol 18:1491–1498
Woodward G, Perkins DM, Brown LE (2010) Climate change and freshwater ecosystems: impacts across multiple levels of organi-zation. Philos Trans R Soc Lond B 365:2093–2106

![[PDF] Cours et exercices pour débuter avec Illustrator CS5 | Cours informatique](data:image/gif;base64,R0lGODlhAQABAIAAAP///wAAACH5BAEAAAAALAAAAAABAAEAAAICRAEAOw==)