HAL Id: hal-00326647
https://hal.archives-ouvertes.fr/hal-00326647
Submitted on 4 Oct 2008
HAL is a multi-disciplinary open access
archive for the deposit and dissemination of
sci-entific research documents, whether they are
pub-lished or not. The documents may come from
teaching and research institutions in France or
abroad, or from public or private research centers.
L’archive ouverte pluridisciplinaire HAL, est
destinée au dépôt et à la diffusion de documents
scientifiques de niveau recherche, publiés ou non,
émanant des établissements d’enseignement et de
recherche français ou étrangers, des laboratoires
publics ou privés.
Tarraf Torfeh, Stéphane Beaumont, Jean-Pierre Guédon, Eloïse Denis
To cite this version:
Tarraf Torfeh, Stéphane Beaumont, Jean-Pierre Guédon, Eloïse Denis. Evaluation of two Software
Tools Dedicated for an Automatic Analysis of the CT Scanner Image Spatial Resolution. 2007,
�10.1109/IEMBS.2007.4353188�. �hal-00326647�
Abstract—An evaluation of two software tools dedicated for
an automatic analysis of the CT scanner image spatial resolution is presented in this paper. The methods evaluated consist of calculating the modulation transfer function of the CT scanners; the first uses an image of an impulse source, while the second method proposed by DROEGE uses an image of cyclic bar patterns. Two Digital Test Objects are created to this purpose. These DTOs are then blurred by doing a convolution with a two dimensional Gaussian function (PSF), which has a well known FWHM. The evaluation process consists then of comparing the Fourier transform of the PSF in one hand, and the two mentioned methods in the other hand.
I. INTRODUCTION
HE spatial resolution of the CT scanner images is nowadays calculated using two methods. The first method consists of calculating the spatial frequency response of the CT system by imaging an impulse source which represents the point spread function of the system. The line spread function (LSF) is then obtained by summing the pixels values of this PSF with respect to the horizontal/vertical direction. The MTF curve is then calculated from the Fourier transform of the LSF data. In the second method proposed by Droege & Al.1, the practical MTF curve (pMTF) is calculated by measuring the standard deviation of the pixel values in each individual pattern of the image of cyclic bar patterns.
In order to compare and evaluate these methods, digital test objects were being generated. These DTOs are supposed to simulate the two types of images (pinhole and cyclic bar patterns) used to calculate the spatial resolution. Knowing that the blur within the images is an essential factor that affects the spatial resolution, we have simulated the blur by convolving the generated DTOs with a two dimensional Gaussian function (PSF) with a specified FWHM. The MTF is then calculated using a large range of simulated DTOs by varying the FWHM of the PSF; these MTF curves are then compared to the Fourier transform of the PSF used initially to blur the DTOs (reference MTF).
Tarraf Torfeh, Jean-Pierre Guédon, Eloïse Denis IRCCyN/IVC – UMR CNRS 6597, Image & Video Communication, Ecole polytechnique de l’université de Nantes, La Chantrerie, BP 50609, 44306 Nantes – France; [email protected]
Stéphane Beaumont
QualiFormeD Sarl – Centre Hospitalier Départemental 85925 La Roche Sur Yon – France; [email protected]
These DTOs are used in a self controlling process of software we have developed (ICQ-CT2, 3, 4) which is dedicated for performing an automatic CT image quality control. This software will be also used to perform a complete automatic quality control for the on-board imaging system installed on the new linear accelerator used for radiation therapy treatments5, 6,7.
II. MATERIALS AND METHODS
The software (IQC-CT) we have developed is capable of performing an automatic CT image quality control in terms of slice thickness, spatial resolution, low and high level contrast, noise and uniformity. Furthermore, in order to facilitate the quality control development process of our different algorithms and to test their limits, DTOs were being generated. These DTOs are constructed in pixels and have well known geometrical forms. Concerning the spatial resolution measurement, two of these DTOs were developed. The first DTO (Fig. 1) is dedicated to simulate the image of an impulse source. This DTO is composed from a white pixel with a grey value of 120 which represents the image of an impulse source in acrylic (PMMA) cast in circular water phantom (grey value 0).
Evaluation of two Software Tools Dedicated for an Automatic
Analysis of the CT Scanner Image Spatial Resolution
Tarraf Torfeh, Stéphane Beaumont, JeanPierre Guédron and Eloïse Denis
T
Fig. 2 DTO representing the image of the cyclic bar patterns
The second DTO (Fig. 2) image is composed from a rectangular area of 260x280 pixels with a grey value of 120 (PMMA). Inside, six groups of water bar patterns (grey value 0) are each made from five inclined dark bars separated by four bright bars.
These bars are respectively from top to bottom,
10
×
2
,8
×
2
,6
×
2
,4
×
2
,2
×
2
&2
2
×
pixels wide.The blur is simulated by convolving the DTO with a two-dimensional Gaussian function, a Point Spread Function (denoted PSF) (Fig. 3). The Full Width at Half Maximum (denoted FWHM) of the PSF is given in pixels by the user. The two-dimensional function is written according to the formula: 2 FWHM 2 2 1 N j 2 2 1 N i . ) 2 ( Ln . 4 e 2 FWHM ) 2 ( Ln . 4 ) j , i ( PSF − − + − − − ⋅ × = π , (2)
where i and j are the pixel position and N x N is the size of the PSF in number of pixel (N = 6 . FWHM + 1).
Fig. 4 Blurred DTOs using a PSF (FWHM = 4 pixels).
Knowing the geometric characteristics of each digital phantom, the MTF is calculated using the two methods.
In the first DTO, a data array (PSF) is constructed from a square region of 21X21 pixels centred on the pixel that represents the impulse source, (Fig. 5).
Fig. 5. PSF of 21X21 pixels size
The LSF at 0° and 90° is then obtained by summing the rows and columns of numbers in the PSF, respectively (Fig.6).
Fig. 6. LSF data from summing the rows
The MTF curve results from the mean of the Fourier transform of the LSF data at 0° and 90°, (Fig. 7).
Fig. 3 Two-dimensional Gaussian function with FWHM = 6 pixels.
Fig. 7. MTF of the pinhole image, blur (FWHM = 6 pixels)
The range of the MTF values is between the zero and one-half the sampling rate (0.5 line pair per pixel)
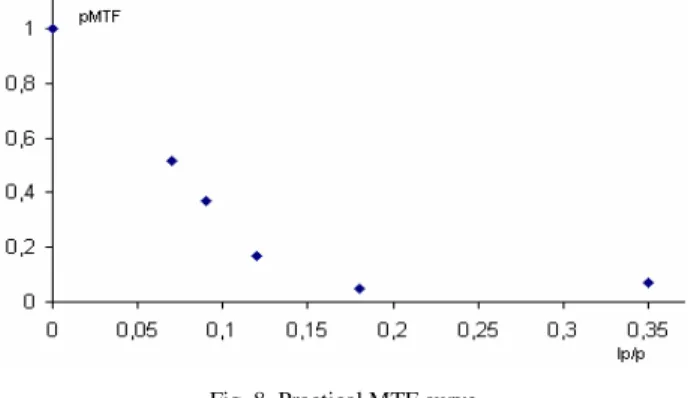
A second DTO is performed to evaluate the method proposed by DROEGE is used to calculate the practical MTF. Each group of cyclic bar patterns results a point in the pMTF curve with a specific frequency following the equation:
[
]
) ( ) ( 2 2 ) ( 2 ) ( 2 ) ( 2 ) ( i ROIbg M i ROIp M i ROIbg SD i ROIp SD i pattern SD i pattern pMTF − + − = πwhere pMTF[pattern(i)] is the pMTF value for the frequency corresponding to the pattern group (i), SDpattern(i) is
the SD of the pixel values of group of patterns (i), SDROIp(i)
and SDROIbg(i) are the SD of the pixel intensity value in two
ROIs having the same size of the pattern group (i), the first is located in a homogenous region with same composition than the pattern and the second lays in the background medium, while M ROIp(i) and M ROIbg(i) are the mean values of the pixel
intensity within the same ROIs.
Knowing the size of the bars within each group of patterns, we can associate for these groups the right corresponding frequency. For illustration, the bar width of the smallest group of patterns
p
×
2
, where p is the pixel size, and the corresponding frequency is35
.
0
2
2
p
=
×
line pair per pixel. The othercorresponding frequencies are 0.176, 0.118, 0.088, and 0.0707 lp/p.
The pMTF resulting from this method is shown in Fig. 8.
Fig. 8. Practical MTF curve
The two MTF curves are then compared with the reference MTF curve illustrated in Fig. 9, resulting from the Fourier transform of the PSF, i.e. the exact amount of blur introduced
Fig. 9. Reference MTF curve
IV. RESULTS
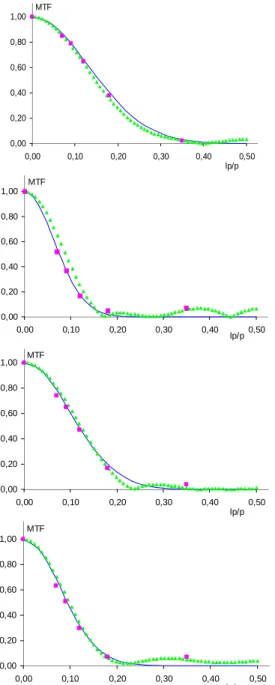
MTF of the pinhole image, pMTF of the cyclic bar pattern image and the reference MTF are presented in Fig. 10 for six different values of blur, i.e. six values of the FWHM of the PSF used to blur the 2 corresponding DTOs (3, 4, 5 & 6 pixel).
0,00 0,20 0,40 0,60 0,80 0,00 0,10 0,20 0,30 0,40 0,50 lp/p 0,00 0,20 0,40 0,60 0,80 1,00 0,00 0,10 0,20 0,30 0,40 0,50 lp/p MTF 0,00 0,20 0,40 0,60 0,80 1,00 0,00 0,10 0,20 0,30 0,40 0,50 lp/p MTF 0,00 0,20 0,40 0,60 0,80 1,00 0,00 0,10 0,20 0,30 0,40 0,50 lp/p MTF
Fig. 10. Comparison of the MTF from the pinhole (▲), the practical MTF (■) and the reference MTF (▬). Four PSF with different FWHM are used, from top to bottom (FWHM = 3, 4, 5 & 6 pixels).
Table 1 shows the values at 50, 10, 5 and 2%of the MTF calculated. The percentages of deviation with respect to the reference values are also shown.
Table.1. Values of the frequencies F 50, 10, 5 and 2 % of the MTF for the 4 different blur functions of the Fig. 10. “V” is the values of the frequencies and “D” is the percentage of relative deviation with respect to the reference value (TF of the blur PSF).
Results issued from these methods show a good
correlation. The MTF curve using the pinhole image is better for low frequencies, especially when the FWHM of the blur function is small. This can be seen when we are using a perfect DTO, with no blur (FWHM = 0), the pMTF measured in such DTO is a constant value equal to
1
.
11
2
2
=
π
, while the theoretical value should be equal
to 1.
For higher frequencies and for all blur functions, the pMTF is equivalent and even better from the method using the pinhole image. The sampling of the MTF calculated using the pinhole depends on the size of the initially chosen image. A larger image results more sampling in the MTF.
VI. CONCLUSION
The two methods we have studied in this paper; the method using the image of the pinhole, or the method proposed by Droege & Al., proved to be accurate methods for determining the MTF of the scanner. Furthermore, the use of Digital Test Objects is an important technique which helps verifying the performances of software dedicated for the automatic CT image quality control.
This methodology will be used in order to develop new tools for an automatic quality control for the on-board imaging system installed on the new linear accelerator used for radiation therapy treatments.
REFERENCES
[1] Ronald T. Droege & Richard L. Morin, “A practical method to measure the MTF of CT scanners”, Medical Physics, Volume 9, Issue 5, September 1982, PP. 758-760
[2] T. Torfeh, S. Beaumont, JP. Guédon, N. Normand & E. Denis, “Software Dedicated Tools for an Automatic Quality Control of Image CT Scanner”. Conf. Medical Imaging, San Diego, February 2007.
[3] E. Denis, S. Beaumont, JP. Guédon, N. Normand & T. Torfeh, “Automatic Quality Control of Digitally Reconstructed Radiograph Computation and Comparison with Standard Methods”, Conf. Medical Imaging, San Diego, February 2007
[4] http://www.qualiformed.com
[5] Yang, K. Kwan, A.L.C. Miller, D.F. Boone, J.M. “A geometric calibration method for cone beam CT systems”, Medical Physics, Volume 33, Numb 6, June 2006, pp1695-1706
[6] Rowbottom C.G., Jaffray D.A. “Development of an integral system test for image-guided radiotherapy”, Medical Physics, Volume 31(12), p3500-3505, 3004.
[7] Sua H. Poor, An Introduction to Signal Detection and Estimation. New York: Springer-VYoo & Al. “A quality assurance program for the on-board imager”, Medical Physics, Volume 33, Issue 11,November 2006, pp 4431-4447.