HAL Id: hal-00304795
https://hal.archives-ouvertes.fr/hal-00304795
Submitted on 1 Jan 2004
HAL is a multi-disciplinary open access archive for the deposit and dissemination of sci-entific research documents, whether they are pub-lished or not. The documents may come from teaching and research institutions in France or abroad, or from public or private research centers.
L’archive ouverte pluridisciplinaire HAL, est destinée au dépôt et à la diffusion de documents scientifiques de niveau recherche, publiés ou non, émanant des établissements d’enseignement et de recherche français ou étrangers, des laboratoires publics ou privés.
concentration?discharge event dynamics
P. Haygarth, B.L. Turner, A. Fraser, S. Jarvis, T. Harrod, D. Nash, D.
Halliwell, T. Page, K. Beven
To cite this version:
P. Haygarth, B.L. Turner, A. Fraser, S. Jarvis, T. Harrod, et al.. Temporal variability in phosphorus transfers: classifying concentration?discharge event dynamics. Hydrology and Earth System Sciences Discussions, European Geosciences Union, 2004, 8 (1), pp.88-97. �hal-00304795�
P. Haygarth, B.L. Turner, A. Fraser, S. Jarvis, T. Harrod, D. Nash, D. Halliwell, T. Page and K. Beven Hydrology and Earth System Sciences, 8(1), 8897 (2004) © EGU
Temporal variability in phosphorus transfers: classifying
concentrationdischarge event dynamics
Phil Haygarth
1, Benjamin L. Turner
1,5, Andy Fraser
2, Steve Jarvis
1, Tim Harrod
2, David Nash
3,
David Halliwell
3, Trevor Page
4and Keith Beven
41Institute of Grassland and Environmental Research, North Wyke Research Station, Okehampton, Devon, EX20 2SB, UK 2National Soil Resources Institute, North Wyke Research Station, Okehampton, Devon, EX20 2SB, UK
3Agriculture Victoria, RMB 2460, Hazeldean Road, Ellinbank, Victoria 3821, Australia 4Environmental Science Department, University of Lancaster, Lancaster LA1 4YQ, UK 5Soil and Water Science Department, University of Florida, Gainesville, Florida 32611, USA
E-mail for corresponding author: [email protected]
Abstract
The importance of temporal variability in relationships between phosphorus (P) concentration (Cp) and discharge (Q) is linked to a simple
means of classifying the circumstances of CpQ relationships in terms of functional types of response. New experimental data at the upstream
interface of grassland soil and catchment systems at a range of scales (lysimeters to headwaters) in England and Australia are used to demonstrate the potential of such an approach. Three types of event are defined as Types 13, depending on whether the relative change in Q exceeds the relative change in Cp (Type 1), whether Cp and Q are positively inter-related (Type 2) and whether Cp varies yet Q is unchanged
(Type 3). The classification helps to characterise circumstances that can be explained mechanistically in relation to (i) the scale of the study (with a tendency towards Type 1 in small scale lysimeters), (ii) the form of P with a tendency for Type 1 for soluble (i.e., <0.45 mm P forms) and (iii) the sources of P with Type 3 dominant where P availability overrides transport controls. This simple framework provides a basis for development of a more complex and quantitative classification of CpQ relationships that can be developed further to contribute to future
models of P transfer and delivery from slope to stream. Studies that evaluate the temporal dynamics of the transfer of P are currently grossly under-represented in comparison with models based on static/spatial factors.
Keywords: phosphorus, concentration, discharge, lysimeters, temporal dynamics, overland flow
Introduction
The models currently dominant for understanding phosphorus (P) transfer from agricultural soils to streams (Haygarth and Jarvis, 1999; Heathwaite et al., 2003; Lemunyon and Gilbert, 1993) are focused on static/spatial factors, such as farm system (Haygarth et al., 1998b), land use type (Johnes and Butterfield, 2002) and soil P status (Heckrath et al., 1995). In this paper, the importance of
temporal variability is explored and it is shown that such
day to day changes in P concentration (Cp) discharge
(Q) relationships can be at least as important as static/spatial factors.
Nutrient concentrationQ relationships are well established, particularly within the engineering/hydrology disciplines using methods such as hydrograph separation
and mixing models (e.g. Leaney et al., 1993; McDonnell et
al., 1991). However, among the P transfer cognoscenti and
in the emergent literature, there are relatively few such Cp
Q studies that involve P specifically even though P dynamics are critical to farming practices (see Table 1 and below for a review of key work). This note examines the importance of these temporal concepts in relation to P transfer and presents a simple empirical attempt to characterise CpQ
relationships. The paper involves:
1. examination of the theoretical background as to why CpQ relationship types differ;
2. a proposed classification for CpQ relationship types;
3. a description of the methods behind the new data; 4. a discussion of how understanding CpQ relationships
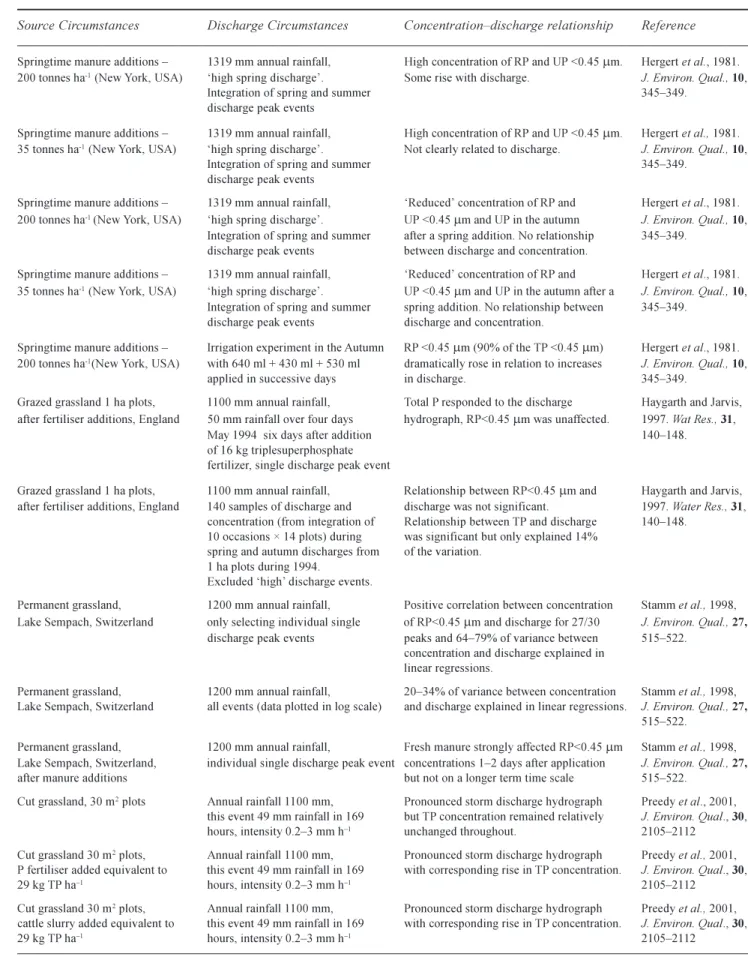
Table 1. A selective review giving examples of phosphorus concentrationdischarge circumstances published by previous researchers Source Circumstances Discharge Circumstances Concentrationdischarge relationship Reference
Springtime manure additions 1319 mm annual rainfall, High concentration of RP and UP <0.45 mm. Hergert et al., 1981.
200 tonnes ha-1 (New York, USA) high spring discharge. Some rise with discharge. J. Environ. Qual., 10,
Integration of spring and summer 345349.
discharge peak events
Springtime manure additions 1319 mm annual rainfall, High concentration of RP and UP <0.45 mm. Hergert et al., 1981. 35 tonnes ha-1 (New York, USA) high spring discharge. Not clearly related to discharge. J. Environ. Qual., 10,
Integration of spring and summer 345349.
discharge peak events
Springtime manure additions 1319 mm annual rainfall, Reduced concentration of RP and Hergert et al., 1981.
200 tonnes ha-1 (New York, USA) high spring discharge. UP <0.45 mm and UP in the autumn J. Environ. Qual., 10,
Integration of spring and summer after a spring addition. No relationship 345349. discharge peak events between discharge and concentration.
Springtime manure additions 1319 mm annual rainfall, Reduced concentration of RP and Hergert et al., 1981.
35 tonnes ha-1 (New York, USA) high spring discharge. UP <0.45 mm and UP in the autumn after a J. Environ. Qual., 10,
Integration of spring and summer spring addition. No relationship between 345349.
discharge peak events discharge and concentration.
Springtime manure additions Irrigation experiment in the Autumn RP <0.45 mm (90% of the TP <0.45 mm) Hergert et al., 1981. 200 tonnes ha-1(New York, USA) with 640 ml + 430 ml + 530 ml dramatically rose in relation to increases J. Environ. Qual., 10,
applied in successive days in discharge. 345349.
Grazed grassland 1 ha plots, 1100 mm annual rainfall, Total P responded to the discharge Haygarth and Jarvis,
after fertiliser additions, England 50 mm rainfall over four days hydrograph, RP<0.45 mm was unaffected. 1997. Wat Res., 31,
May 1994 six days after addition 140148.
of 16 kg triplesuperphosphate fertilizer, single discharge peak event
Grazed grassland 1 ha plots, 1100 mm annual rainfall, Relationship between RP<0.45 mm and Haygarth and Jarvis, after fertiliser additions, England 140 samples of discharge and discharge was not significant. 1997. Water Res., 31,
concentration (from integration of Relationship between TP and discharge 140148. 10 occasions × 14 plots) during was significant but only explained 14%
spring and autumn discharges from of the variation. 1 ha plots during 1994.
Excluded high discharge events.
Permanent grassland, 1200 mm annual rainfall, Positive correlation between concentration Stamm et al., 1998,
Lake Sempach, Switzerland only selecting individual single of RP<0.45 mm and discharge for 27/30 J. Environ. Qual., 27,
discharge peak events peaks and 6479% of variance between 515522.
concentration and discharge explained in linear regressions.
Permanent grassland, 1200 mm annual rainfall, 2034% of variance between concentration Stamm et al., 1998,
Lake Sempach, Switzerland all events (data plotted in log scale) and discharge explained in linear regressions. J. Environ. Qual., 27, 515522.
Permanent grassland, 1200 mm annual rainfall, Fresh manure strongly affected RP<0.45 mm Stamm et al., 1998, Lake Sempach, Switzerland, individual single discharge peak event concentrations 12 days after application J. Environ. Qual., 27,
after manure additions but not on a longer term time scale 515522.
Cut grassland, 30 m2 plots Annual rainfall 1100 mm, Pronounced storm discharge hydrograph Preedy et al., 2001,
this event 49 mm rainfall in 169 but TP concentration remained relatively J. Environ. Qual., 30,
hours, intensity 0.23 mm h1 unchanged throughout. 21052112
Cut grassland 30 m2 plots, Annual rainfall 1100 mm, Pronounced storm discharge hydrograph Preedy et al., 2001,
P fertiliser added equivalent to this event 49 mm rainfall in 169 with corresponding rise in TP concentration. J. Environ. Qual., 30,
29 kg TP ha1 hours, intensity 0.23 mm h1 21052112
Cut grassland 30 m2 plots, Annual rainfall 1100 mm, Pronounced storm discharge hydrograph Preedy et al., 2001,
cattle slurry added equivalent to this event 49 mm rainfall in 169 with corresponding rise in TP concentration. J. Environ. Qual., 30,
P. Haygarth, B.L. Turner, A. Fraser, S. Jarvis, T. Harrod, D. Nash, D. Halliwell, T. Page and K. Beven can contribute to new understandings of P transfer
dynamics.
Theoretical background
Phosphorus concentration and Q relationships have been discussed previously by a limited number of researchers (e.g. Cooke, 1988; Haygarth and Jarvis, 1997; Hergert et
al., 1981a; Hergert et al., 1981b; Pionke et al., 1993; Preedy et al., 2001; Sinaj et al., 2002; Stamm et al., 1998). Table 1
presents a summary of these. From the literature, three types of CpQ response can be identified.
In Type 1, Cp remains relatively constant in relation to Q.
This might arise from a steady-state situation between the dissolution kinetics of a relatively homogenous soil and the velocity of the water flow and where the reservoir of the soil water may not drain too quickly to prevent exchange of P between soil and solution. The theoretical extreme of this could be homogenised sand.
In Type 2, Cp and Q seem to be related, when the presence
of fast flow causes an apparent disequilibrium in the Cp
supply. In theory, this may arise when:
1. Flow causes the physical entrainment of particulate and colloidal matter (with P attached) during rapid water flows (Haygarth and Jarvis, 1997; Haygarth et al., 1997). This is probably the commonest example. 2. The fast flow means that the water takes a pathway
different from that normally experienced during saturated base flow, where there is little opportunity for mixing and re-adsorption of P. This may be exacerbated in circumstances where the fast flow path interacts with a new high P source. Indeed, Haygarth et al. (1998a) have shown that where soil P is concentrated in the top few cm of soil, it provides a source with a high potential for interacting with any fast overland or near-surface flows. Macropore flow has also been shown to be important in these circumstances (Stamm et al., 1998). 3. The changes in soil moisture affect soil biochemistry and additional P is supplied. Recent studies have shown that dynamics of soil wetting and drying may release a considerable quantity of P into soil solution including mobile P from the soil microbial biomass (Turner and Haygarth, 2001).
4. A decline of Cp in relation to high Q, reflects dilution
and depletion of source.
Type 3 is the opposite of Type 1, where changes in Cp
occur even though Q remains relatively constant. This reflects an enriched supply or source of P to the system and could occur when fertiliser or manure is added to soil
(Haygarth and Jarvis, 1997; Hergert et al., 1981a; Hergert
et al., 1981b; Pionke et al., 1993; Preedy et al., 2001; Stamm et al., 1998).
Proposed classification for C
pQ
relationship types
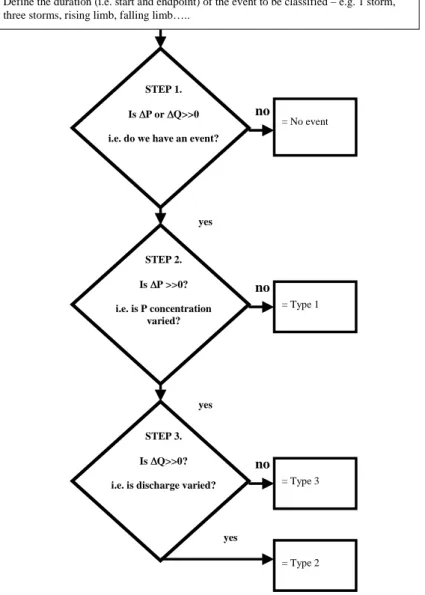
Based upon the theoretical background, the CpQ
relationships can be classified in terms of a simple decision tree (Fig. 1).
1. Define the duration (i.e. start and endpoint) of the time series to be classified, e.g. a storm, three storms, rising limb, falling limb etc..
2. Determine whether there is a significant change in Cp
or Q during the time series i.e. is there an event to be classified?
3. Is the event characterised by a change in Cp and/or Q?
l Type 1 events occur when the relative change in Q is
> than the relative change in Cp.
l If both Cp and Q change then the event is Type 2. l If Cp only changes then the event is Type 3.
Data collected to test the
classification for C
pQ relationship
types
The classification was tested on new data, derived from analysis of hydrographs and time series data for Pexport from a range of hydrologically isolated lysimeters and headwater catchments from different soils of varying P content, for a variety of rainfallrunoff conditions in England and Australia. All samples were collected, prepared and analysed for either reactive P that was filtered (<0.45 mm, RP<0.45 mm) (Haygarth et al., 1995; Haygarth and Sharpley,
2000) or total P that was unfiltered (TP), using standard protocols (Eisenreich et al., 1975; Murphy and Riley, 1962; Rowland and Haygarth, 1997). A full description of all the sites used follows below (Table 2 summarises soil type, P status, P management and hydro-sampling methods):
Monolith lysimeters. Cylindrical monolith lysimeters, 135
cm deep and 80 cm diameter, sampled intact to preserve the soil structure (Belford, 1979) were installed in a field site (UK national mapping grid reference NGR SX 657 983) at North Wyke Research Station, Devon, UK, in 1992. The lysimeters supported swards that were dominated by perennial ryegrass (Lolium perenne L.) and received inorganic fertiliser nitrogen (N), P and potassium (K), in accordance with recommended practice for cut grassland
in England and Wales (MAFF, 1994). The lysimeters were exposed to natural rainfall and environmental conditions and water draining under gravity was collected in 25 L vessels in an underground chamber (Turner and Haygarth, 2000). There were three soil types and four replicate lysimeters of each, being; (1) a clay loam (USDA Dystrochrepts), (2) a sandy-loam (USDA Hapludalfs) and (3) a sand (USDA Udipsamments). The temporal trend, based on seven-day cumulative Q over a winter field capacity season, from 2nd December 1997 until 19th May
1998, was studied. The Dystrochrepts soil was also analysed more frequently, using samples gathered daily, during the period 18th February4th March 1997.
1.8 hectare size overland/interflow plots. This experiment
used a 1.8 hectare paddock as part of a 120 ha farm on which
approximately 350 dairy cows graze all year round at Darnum, in West Gippsland, Victoria, Australia (38 10' S, 146 03' E). The soil was a fine sandy loam A horizon overlaying a light to medium clay at approximately 75 cm (USDA Haplustults). The pasture was predominantly perennial ryegrass and white clover (Trifolium repens L.) and received 60, 80, 110 and 110 kg P ha1 annually from
1993 to 1996. The experimental area drains to a natural depression where a culvert conveys the water away. Overland flow plus interflow to 7.5 cm were sampled by a diversion wall, buried 7.5 cm into the soil. Water sampling was discharge-integrated to maximise sampling frequency at higher Q for 34 events >0.027 mm (runoff) between 1994 and 1996.
Den Brook headwater catchment. This 48 ha catchment was
Fig. 1. Proposed system for a functional type classification of phosphorus concentrationdischarge relationships
Define the duration (i.e. start and endpoint) of the event to be classified – e.g. 1 storm, three storms, rising limb, falling limb…..
= No event
STEP 1. Is 'P or 'Q>>0 i.e. do we have an event?
no = Type 1 STEP 2. Is 'P >>0? i.e. is P concentration varied? no yes = Type 3 STEP 3. Is 'Q>>0? i.e. is discharge varied?
no yes
= Type 2
P. Haygarth, B.L. Turner, A. Fraser, S. Jarvis, T. Harrod, D. Nash, D. Halliwell, T. Page and K. Beven
characterised by a slowly permeable seasonally waterlogged clay soil (USDA Typic Haplaquept) and had an extensive network of agricultural tile drains under the surface. The catchment was managed predominately as mixed grassland with some beef cattle, sheep and a dairy herd, as well as approximately 1 ha of maize, harvested in the autumn. The median Olsen P value for the whole catchment was 54 mg kg1 (07.5 cm). There was also a hard standing area for
cattle within the catchment that drained, intermittently, polluted farmyard runoff directly into the stream. The sward was dominated by perennial ryegrass and received inorganic fertiliser N, P and K plus manure and excretal returns consistent with recommended practice (MAFF, 1994). Annual average rainfall for the period Dec 2001Nov 2002 was 1011 mm with 610 mm total runoff determined at the flume at the outlet (located at UK national mapping grid reference NGR SX 677 998). Water samples were auto-collected in proportion to the flow and transferred to the laboratory for analysis within 24 hours of sampling.
Drewston headwater catchment. This 22 ha catchment was
characterised by a well drained fine loamy soil (USDA Dystrochrept) and was approximately 10 miles from the Den Brook catchment, thereby being subjected to a broadly similar and comparable hydro-climatic condition. The catchment was managed predominately as mixed grassland with some beef cattle and sheep, as well as having woodland surrounding the stream in the lower part of the catchment.
The median Olsen P value for the whole catchment was 49 mg kg1 (07.5 cm). The sward was dominated by
perennial ryegrass and received inorganic fertiliser N, P and K plus manure and excretal returns consistent with recommended practice (MAFF, 1994). Annual average rainfall in the period Dec 2001Nov 2002 was 1311 mm with 639 mm total runoff determined at the flume outlet (UK national mapping grid reference NGR SX 726 878). Water samples were auto-collected in proportion to the flow and transferred to the laboratory for analysis within 24 hours of sampling.
How understanding C
pQ
relationships can contribute to new
understandings for phosphorus
transfer
Pionke et al. (1996) have demonstrated previously the importance of events and proposed a system of classifying nutrient export by separating hydrograph Q conditions in relation to base flow, elevated base flow, storm flow and unclassified flow. This classification system was based on Q and did not account for differences in Cp. In contrast,
the approach taken here is able to describe all types of CpQ relationships that emerge from the data sets. In Figs.
2-6, examples are presented as illustrations.
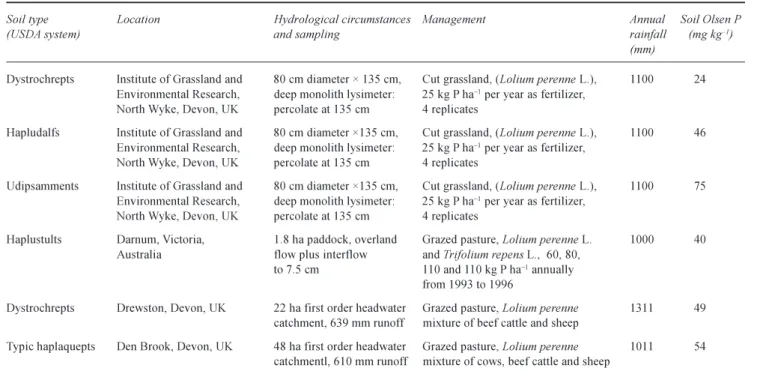
Table 2. Description of the soils and hydrological circumstances examined in this study
Soil type Location Hydrological circumstances Management Annual Soil Olsen P
(USDA system) and sampling rainfall (mg kg1)
(mm)
Dystrochrepts Institute of Grassland and 80 cm diameter × 135 cm, Cut grassland, (Lolium perenne L.), 1100 24 Environmental Research, deep monolith lysimeter: 25 kg P ha1 per year as fertilizer,
North Wyke, Devon, UK percolate at 135 cm 4 replicates
Hapludalfs Institute of Grassland and 80 cm diameter ×135 cm, Cut grassland, (Lolium perenne L.), 1100 46
Environmental Research, deep monolith lysimeter: 25 kg P ha1 per year as fertilizer,
North Wyke, Devon, UK percolate at 135 cm 4 replicates
Udipsamments Institute of Grassland and 80 cm diameter ×135 cm, Cut grassland, (Lolium perenne L.), 1100 75 Environmental Research, deep monolith lysimeter: 25 kg P ha1 per year as fertilizer,
North Wyke, Devon, UK percolate at 135 cm 4 replicates
Haplustults Darnum, Victoria, 1.8 ha paddock, overland Grazed pasture, Lolium perenne L. 1000 40
Australia flow plus interflow and Trifolium repens L., 60, 80,
to 7.5 cm 110 and 110 kg P ha1 annually
from 1993 to 1996
Dystrochrepts Drewston, Devon, UK 22 ha first order headwater Grazed pasture, Lolium perenne 1311 49
catchment, 639 mm runoff mixture of beef cattle and sheep
Typic haplaquepts Den Brook, Devon, UK 48 ha first order headwater Grazed pasture, Lolium perenne 1011 54
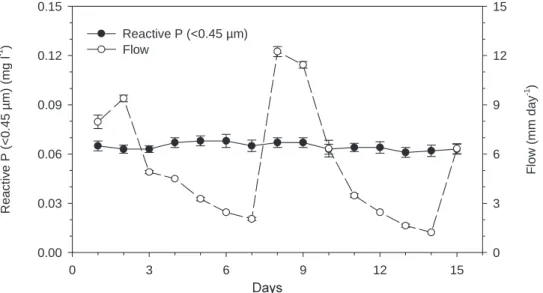
0 3 6 9 12 15 Re a c ti v e P (< 0 .4 5 µ m ) (m g l -1 ) 0.00 0.03 0.06 0.09 0.12 0.15 Fl ow ( m m da y -1 ) 0 3 6 9 12 15 Reactive P (<0.45 µm) Flow
Fig. 2. Type 1 response in monolith lysimeters at daily resolution for two weeks, (one soil type): The temporal trend in RP<0.45 mm concentration
in leachate and discharge from a Dystrochrepts soil under a cut grassland monolith lysimeters in Devon, UK. Data are from samples gathered daily, during the period 18th February 4th March 1997, vertical bars represent standard errors of n = 4 replicate lysimeters).
Sand
Days from onset of drainage
0 50 100 150 200 0 30 60 90 120 0.00 0.05 0.10 0.15 0.20 Sandy Loam Fl o w ( m m wk -1) 0 30 60 90 120 Rea c ti ve P ( < 0.45) ( m g P l -1 ) 0.00 0.02 0.04 0.06 0.08 Clay Loam 0 30 60 90 0.00 0.05 0.10 0.15 Flow Reactive P (<0.45 µm)
Fig. 3. Type 1 response in monolith lysimeters, at weekly resolution for a drainage season (3 soil types): The temporal trend in RP<0.45 mm
concentration in leachate and discharge from three contrasting soil types in monolith lysimeters under cut grassland in Devon, UK. The temporal trend is based on a 7-day cumulative discharge over a winter field capacity season, from 2nd December 1997 until 19th May 1998,
vertical bars represent standard errors of n = 4 replicate lysimeters).
P. Haygarth, B.L. Turner, A. Fraser, S. Jarvis, T. Harrod, D. Nash, D. Halliwell, T. Page and K. Beven Time (mins) 0 500 1000 1500 2000 Fl o w ( mm h -1 ) 0 2 4 6 8 R e a c ti v e P ( < 0. 45 µ m ) (m g P l -1) 0 5 10 15 Flow Reactive P (<0.45 µm)
22-Jan-02 23-Jan-02 24-Jan-02 25-Jan-02
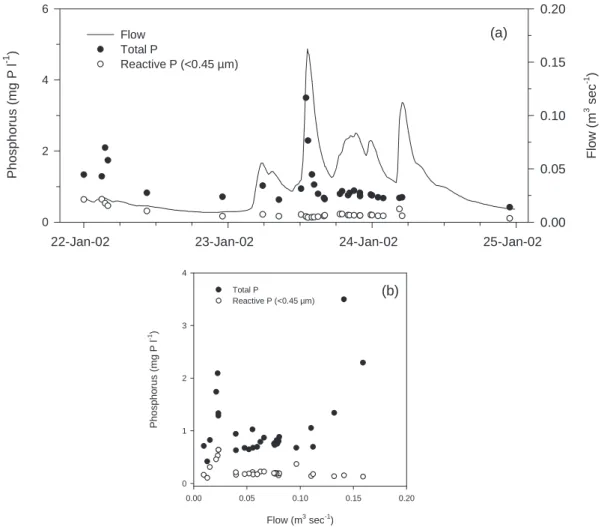
Flow ( m 3 se c -1 ) 0.00 0.05 0.10 0.15 0.20 P hos pho ru s (m g P l -1 ) 0 2 4 6 Flow Total P Reactive P (<0.45 µm) Flow (m3 sec-1) 0.00 0.05 0.10 0.15 0.20 Phospho ru s ( m g P l -1) 0 1 2 3 4 Total P Reactive P (<0.45 µm) (a) (b)
Fig. 4. Type 1 response in overland flow from a small paddock from 1.8 ha overland flow plus interflow plots from Darnum in Victoria, Australia. These data are from the longest continuous event of >0.027 mm at this site. This data was collected on a minute by minute scale on 67 Nov 1994.
Fig. 5. Different phosphorus forms give different functional type responses: Type 1 and 2 responses in one-headwater catchment for different P forms. (a)Temporal trends in RP<0.45 mm (Type 1) and TP concentration (Type 2) and discharge on 23rd January 2002 in the Den Brook catchment.
Example of Type 1 circumstances and the effect of sample frequency. Type 1 transfers (akin to the term level 1 that
was first used by Haygarth and Jarvis (1999) and Haygarth
et al. (2000b)) are similar to systematic transfers described
by Nash et al. (2001) and underlying agricultural transfers (Haygarth et al., 2000b), associated with base flow (1996). Type 1 CpQ relationships exemplify a strongly damped
flat or smooth P breakthrough, in relation to a relatively varied response of Q, suggesting that matrix type Qs are dominant, where water, P and soil have become reasonably well mixed. In these circumstances, Q limits P transfer. Type 1 responses were most common from small scale observations (i.e., monolith lysimeters).
Time series plots of RP<0.45 mm breakthrough concentrations
and Q for the Dystrochrepts monoliths are shown in Fig. 2, using samples gathered daily during the period 18thFebruary4th March 1997 (Fig. 2 clay loam) and
collected weekly for the entire hydrological drainage period 19971998 (Fig. 3 clay loam, sandy loam and sand). Double Fourier models (Genstat 5 Committee, 1993) were fitted to both Q and RP<0.45mm concentration. For the clay
loam, the maximum amplitudes of the Qs were 78.8% (Fig. 2, daily sample frequency) and 99.5% (Fig. 3 weekly sample frequency), whereas for RP<0.45 mm concentration they
were 3.7% (Fig. 2 - daily) and 45.9% (Fig. 3 weekly). In the first example (Fig. 2 daily), the maximum amplitude of Q was 21 times greater than the maximum amplitude of RP<0.45 mm and in the second longer sample period (Fig. 3, weekly), it was 2.7 times greater than that of the RP<0.45 mm.
Figure 3 also shows weekly sample data from the other two monolith soils (Hapludalfs and Udipsamments) plotted in a similar manner. In these hydrographs, the maximum amplitudes of the Qs were larger than those for RP<0.45 mm
concentrations in the time series. A similar Type 1
classification is shown for the 1.8 ha size overland Q plots from Australia (Haplustults, Fig. 4), although in this example there is additional finer structure to the hysteresis. At the beginning of the time series values are clearly recovering on the falling limb of the first runoff event and the pattern is repeated throughout successive Q peaks. All these data exhibit a Type 1 classification.
Example - Type 1 and 2 circumstances and the effect of phosphorus forms. Different P forms can also result in
different functional type behaviour. Figure 5 is an example from Den Brook from January 2002, where, in the main storm peak, temporal trends in RP<0.45 mm are Type 1 but total
P forms gave a Type 2 response. This probably reflects different processes of mobilisation of different forms of P. Where P forms are filtered, they predominantly reflect solubilisation of P that can be relatively easily mixed in matrix flow paths of the soil. In contrast, TP includes P forms that are not soluble and thus reflects physical detachment of colloids and particles with P attached, responding to the physical energy of the rainfall (Haygarth and Jarvis, 1997). Interestingly, before and after the main storm peak where Q is lower, TP actually exhibits a Type 1 response, illustrating the importance of hydrological thresholds in determining the switch in hydrological energy (Haygarth et al., 2000a). Figure 5b shows the scatter plot of the relationship between Cp and Q is more widely distributed than that for RP<0.45 mm
which, being more akin to Type 1, is less responsive to Q.
Example of Type 3 circumstances and farm management.
An example of a Type 3 response from the Den Brook catchment occurred on 2124th February 2002, following
leakage of the slurry storage pit into the drain that feeds the stream (Fig. 6). This type of event is clearly source-dominated.
21-Feb-02 22-Feb-02 23-Feb-02 24-Feb-02
Flo w ( m 3 se c -1 ) 0.00 0.02 0.04 0.06 0.08 P h o s pho ru s ( m g P l -1 ) 0 2 4 6 Flow Total P Reactive P (<0.45 µm)
Fig. 6. Type 3 response in one-headwater catchment: Temporal trends in a) RP<0.45 mm and b) TP concentration and discharge on 21-24 February
P. Haygarth, B.L. Turner, A. Fraser, S. Jarvis, T. Harrod, D. Nash, D. Halliwell, T. Page and K. Beven
Benefits of a temporal approach to studying phosphorus transfer
This simple rationalisation of CpQ relationships emphasises
the importance of a temporal approach characterising circumstances of P transfer. With the exception of a few studies cited earlier, the overall trend within the P transfer cognoscenti has been to focus on static/spatial factors. Events are a source of important information for helping the understanding of patterns and processes and clearly Cp
and Q are the central components of these. Although factors such as soil P status are important in the long term (Heckrath
et al., 1995), not studying mechanisms in a dynamic and
temporal framework may result in loss of valuable information and potential to understand extremes of land management and antecedent conditions. Clearly Type 1 scenarios generate smaller loads and may need less (short term) mitigation requirement than Types 2 and 3.
Several simple but important rules that can promote progress on understanding of P transfer have emerged from this work:
l Sample frequency is important and can potentially affect
the interpretation of CpQ relationships and the
functional type of an event. Higher sample frequencies could reduce potential uncertainties and so should be a priority.
l In Type 1 conditions, studying soil P does not lead to
an understanding of short term P transfer dynamics. Thus, in the short term, static agronomic measures such as Olsen P do not explain the P load and the associated mechanisms.
l Phosphorus form affects CpQ relationships. In the same
catchment in the same event, soluble RP exemplified Type 1 whereas TP (that included particles and colloids) exemplified Type 2.
l A large P source affects CpQ relationships. A Type 3
response was noted where a slurry source leaked directly to the stream.
l Scale affects CpQ relationships. Type 1 responses seem
to be more common in small scale studies, e.g. in monolith lysimeters, presumably because, at this scale, monoliths are relatively well homogenised. However, it is important to acknowledge that had by-pass flow occurred, a different type of response may have been observed. Nonetheless, this casts doubts on the validity of extrapolating from lysimeters to catchments.
Future challenges
This simple framework provides a basis for development of a more complex and quantitative classification of CpQ
relationships. The practical benefit of this approach is that
it could contribute to a dynamic modelling framework for helping understand P transfer and delivery from slope to stream and an attemptis now being made to do this. Here, examples from various new data sources have been selected but future improvements could be made from development of a quantitative means to classify Type that takes into account any non-linearity that can exist between Cp and Q.
This is because the main limitation in the classification is that it is qualitative and that subjective judgment is required in interpretation of CpQ relationships. Another priority for
consideration is that, as different processes can lead to the same CpQ response, they are, in practice, difficult to
separate (there are at least three mechanistic explanations for a Type 2 response): this is the problem of geomorphological equifinality as identified previously by Beven (1996). Therefore, there is also a need to develop a system to separate different types of responses, with a sub-categorisation to explore finer structure of within-storm hysteresis, to determine whether Cp peaks occurred before
or after the Q peak for Type 2 conditions. This could build on the precedents established in the sediment literature that have earmarked the importance of different conditions for transport versus supply-limited events (e.g. Williams, 1989; Wood, 1977).
This paper has identified the importance of temporal approaches to P transfer, to help guide future understanding of mechanisms that determine loads (load = Cp.Q). Since P
loads are the basis for export coefficients that are, in turn, used to calibrate spatial/static models (Heathwaite et al., 2003; Johnes and Butterfield, 2002; Lemunyon and Gilbert, 1993) that inform policy decisions, CpQ dynamics are of
fundamental importance. It is intended that this paper serves as a stimulant and commentary on current approaches to the P transfer issue and highlights the need for future studies to adopt dynamic approaches. Future challenges are to develop quantitative model frameworks that help pinpoint
when, where and why these different situations occur.
In a wider context, the classification scheme is dependent on the resolution, duration and overall quality of the input data. As contemporary publications have shown (Kirchner
et al., 2000; Kirchner et al., 2001; Kirchner et al., 2004),
fine resolution monitoring may reveal additional patterns of complexity. Events therefore may not be linked only or directly to flow and intermittent farm managements, but due to a wide distribution of water and P through residence times. This fractal response has been shown to occur in similar ways across a large variety of scales. Therefore, the only true understandings in P hydrochemistry will come about by more high resolution dynamic observations across scales.
Acknowledgements
Analytical support of Andrew Bristow, statistical advice from Dan Dhanoa and comments and help of Dr A. C. Edwards, Prof. R. J. Wilkins and Prof C. Neal are gratefully acknowledged. The work was funded by the UK Department for Environment, Food and Rural Affairs (project PEO102), The Biotechnology and Biological Sciences Research Council (UK) (project 89-MAFS12247), The Natural Environment Research Council (UK), the Government of the State of Victoria (Australia) and the Dairy Research and Development Corporation (Australia). The comments of the referees were helpful in improving the manuscript.
References
Belford, R.K., 1979. Collection and evaluation of large soil monoliths for soil and crop studies. J. Soil Sci., 30, 363373. Beven, K.J., 1996. Equifinality and Uncertainty in
Geomorphological Modelling. In: The Scientific Nature of
Geomorphology, B.L. Rhoads and C.E. Thorn (Eds.), Wiley,
Chichester, UK. 289313.
Cooke, J., 1988. Sources and sinks of nutrients in a New Zealand hill pasture catchment (ii) phosphorus. Hydrol. Process., 2, 123133. Eisenreich, S.J., Bannerman, R.T. and Armstrong, D.E., 1975. A
simplified phosphorus analytical technique. Environ. Lett., 9, 4553.
Genstat 5 Committee, 1993. Genstat 5 Release 3, Clarendon Press. Haygarth, P.M. and Jarvis, S.C., 1997. Soil derived phosphorus in surface runoff from grazed grassland lysimeters. Water Res.,
31, 140148.
Haygarth, P.M. and Sharpley, A.N., 2000. Terminology for phosphorus transfer. J. Environ. Qual., 29, 1015.
Haygarth, P.M., Ashby, C.D. and Jarvis, S.C., 1995. Short-term changes in the molybdate reactive phosphorus of stored soil waters. J. Environ. Qual., 24, 11331140.
Haygarth, P.M., Heathwaite, A.L., Jarvis, S.C. and Harrod, T.R., 2000a. Hydrological factors for phosphorus transfer from agricultural soils. Adv. Agron., 69, 153178.
Haygarth, P.M., Hepworth, L. and Jarvis, S.C., 1998a. Forms of phosphorus transfer in hydrological pathways from soil under grazed grassland. Eur. J. Soil Sci., 49, 6572.
Haygarth, P.M. and Jarvis, S.C., 1999. Transfer of phosphorus from agricultural soils. Adv. Agron., 66, 195249.
Haygarth, P.M., Jarvis, S.C., Chapman, P. and Smith, R.V., 1998b. Phosphorus budgets for two contrasting grassland farming systems in the UK. Soil Use Manage., 14, 160167.
Haygarth, P.M., Turner, B.L., Fraser, A.I., Jarvis, S.C., Harrod, T.R., Nash, D.M. and Halliwell, D.J., 2000b. Prioritising mitigation of soil phosphorus transfer in relation to water flows. In: Grassland Farming: Balancing Environmental and
Economic Demands, K. Soegaard et al. (Eds.), Vol. 5. European
Grassland Federation, Holstebro, Denmark.
Haygarth, P.M., Warwick, M.S. and House, W.A., 1997. Size distribution of colloidal molybdate reactive phosphorus in river waters and soil solution. Water Res., 31, 439442.
Heathwaite, A.L., Fraser, A.I., Johnes, P.J., Hutchins, M., Lord, E., and Butterfield, D., 2003. The phosphorus indicators tool: a simple model of diffuse P loss from agricultural land to water.
Soil Use Manage., 19, 112.
Heckrath, G., Brookes, P.C., Poulton, P.R., and Goulding, K.W.T., 1995. Phosphorus leaching from soils containing different
phosphorus concentrations in the Broadbalk Experiment. J.
Environ. Qual., 24, 904910.
Hergert, G.W., Bourdin, D.R., Klausner, S.D., and Zwerman, P.J., 1981a. Phosphorus concentration-water flow interactions in tile effluent from manured land. J. Environ. Qual., 10, 338344. Hergert, G.W., Klausner, S.D., Bouldin, D.R., and Zwerman, P.J.,
1981b. Effects of dairy manure on phosphorus concentrations and losses in tile effluent. J. Environ. Qual., 10, 345349. Johnes, P.J. and Butterfield, D., 2002. Landscape, regional and
global estimates of nitrogen flux to the sea: Errors and uncertainties. Biogeochemistry, 57/58, 429476.
Kirchner, J.W., Feng, X. and Neal, C., 2000. Fractal stream chemistry and its implications for contaminant transport in catchments. Nature, 403, 524527.
Kirchner, J.W., Feng, X. and Neal, C., 2001. Catchment-scale advection and dispersion as a mechanism for fractal scaling in stream tracer concentrations. J. Hydrol., 254, 82101. Kirchner, J.W., Feng, X., Neal, C., and Robson, A.J., 2004. The
fine structure of water quality dynamics: the (high frequency) wave of the future. Hydrol. Process., In press.
Leaney, F., Smettem, K. and Chittleborough, D., 1993. Estimating the contribution of preferential flow to subsurface runoff from a hillslope using deuterium and chloride. J. Hydrol., 147, 83109. Lemunyon, J.L. and Gilbert, R.G., 1993. The concept and need for a phosphorus assessment tool. J. Production Agr., 6, 483486. MAFF, 1994. Fertilizer Recommendations for Agricultural and
Horticultural Crops. H. M. Stationary Office, London, UK.
McDonnell, J., Stewart, M. and Owens, I., 1991. Effect of catchment scale subsurface mixing on stream isotopic response.
Water Resour. Res., 27, 30653073.
Murphy, J. and Riley, J.P., 1962. A modified single solution method for the determination of phosphate in natural waters. Anal. Chim.
Acta., 27, 3136.
Nash, D., Halliwell, D. and Hannah, M., 2001. The structure of phosphorus exports and the role of critical incidents. In:
Connecting Phosphorus Transfer from Agriculture to Impacts in Surface Waters, P. M. Haygarth et al. (Eds.). Institute of
Grassland and Environmental Research, Plymouth. UK. 16pp. Pionke, H.B., Gburek, W.J., and Folmar, G.J., 1993. Quantifying stormflow components in a Pennsylvania watershed when 18O
input and storm conditions vary. J. Hydrol., 148, 169187. Pionke, H.B., Gburek, W.J., Sharpley, A.N., and Schnabel, R.R.,
1996. Flow and nutrient export patterns for an agricultural hill-land watershed. Water Resour. Res., 32, 17951804.
Preedy, N., McTiernan, K.B., Matthews, R., Heathwaite, L. and Haygarth, P.M., 2001. Rapid incidental phosphorus transfers from grassland. J. Environ. Qual., 30, 21052112.
Rowland, A.P. and Haygarth, P.M., 1997. Determination of total dissolved phosphorus in soil solutions. J. Environ. Qual., 26, 410415.
Sinaj, S., Stamm, C., Toor, G.S., Condron, L.M., Hendry, T., Di, H. and Cameron, K., 2002. Phosphorus availability and loss from irrigated grassland soils. J. Environ. Qual., 31, 319330. Stamm, C., Fluhler, H., Gachter, R., Leuenberger, J. and Wunderli, H., 1998. Preferential transport of phosphorus in drained grassland soils. J. Environ. Qual., 27, 515522.
Turner, B.L., and Haygarth, P.M., 2000. Phosphorus forms and concentrations in leachate under four grassland soil types. Soil
Sci. Soc. Amer. J., 64, 10901097.
Turner, B.L., and Haygarth, P.M., 2001. Phosphorus solubilization in rewetted soils. Nature, 411, 258.
Williams, G.P., 1989. Sediment concentration versus water discharge during single hydrological events in rivers. J. Hydrol.,
111, 89106.
Wood, P.A., 1977. Controls in variation in suspended sediment concentration in the River Rother, West Sussex, England.