Cytosolic Delivery of Proteins by Bioreversible Esterification
The MIT Faculty has made this article openly available. Please share how this access benefits you. Your story matters.
Citation Mix, Kalie A., et al. “Cytosolic Delivery of Proteins by Bioreversible Esterification.” Journal of the American Chemical Society, vol. 139, no. 41, Oct. 2017, pp. 14396–98
As Published http://dx.doi.org/10.1021/jacs.7b06597 Publisher American Chemical Society
Version Author's final manuscript
Citable link http://hdl.handle.net/1721.1/118315
Terms of Use Article is made available in accordance with the publisher's policy and may be subject to US copyright law. Please refer to the publisher's site for terms of use.
Cytosolic Delivery of Proteins by Bioreversible Esterification
Kalie A. Mix†,‡, Jo E. Lomax§, and Ronald T. Raines†,#,‡,*
†Department of Biochemistry, University of Wisconsin–Madison, Madison, Wisconsin 53706,
United States
§Program in Cellular and Molecular Biology, University of Wisconsin–Madison, Madison,
Wisconsin 53706, United States
#Department of Chemistry, University of Wisconsin–Madison, Madison, Wisconsin 53706, United
States
‡Department of Chemistry, Massachusetts Institute of Technology, Cambridge, Massachusetts
02139, United States
Abstract
Cloaking its carboxyl groups with a hydrophobic moiety is shown to enable a protein to enter the cytosol of a mammalian cell. Diazo compounds derived from (p-methylphenyl)glycine were screened for the ability to esterify the green fluorescent protein (GFP) in an aqueous environment. Esterification of GFP with 2-diazo-2-(p-methylphenyl)-N,N-dimethylacetamide was efficient. The esterified protein entered the cytosol by traversing the plasma membrane directly, like a small-molecule prodrug. As with prodrugs, the nascent esters are substrates for endogenous esterases, which regenerate native protein. Thus, esterification could provide a general means to deliver native proteins to the cytosol.
Graphical Abstract
*Corresponding Author: [email protected].
ORCID
Ronald T. Raines: 0000-0001-7164-1719 Supporting Information
HHS Public Access
Author manuscript
J Am Chem Soc. Author manuscript. Published in final edited form as:
J Am Chem Soc. 2017 October 18; 139(41): 14396–14398. doi:10.1021/jacs.7b06597.
Author Manuscript
Author Manuscript
Author Manuscript
Approximately 20% of the drugs in today’s pharmacopeia are proteins.1 Essentially all of those proteins act on extracellular targets. This limitation arises from an intrinsic inability of
proteins to enter the cytosol.2 Although viral vectors can be used to deliver DNA that
encodes a protein of interest, this genetic approach lacks regulation and can induce stress
responses, carcinogenesis, or immunogenicity.3 In contrast, the direct delivery of proteins
into cells would enable temporal control over cellular exposure and minimize deleterious
off-target effects.4
Proteins can be delivered into cells by using site-directed mutagenesis,5 irreversible
chemical modification,6 conjugation of transduction domains (such as cell-penetrating
peptides, CPPs),7 cationic lipid carriers,8 or electroporation.9 Many of these strategies show
promise but also pose problems,2,4 such as inefficient escape from endosomes or
inapplicability in an animal.
To cross the plasma membrane, proteins must overcome two barriers: Coulombic repulsion from the anionic glycocalyx and exclusion from the hydrophobic environment of the lipid
bilayer.10 Natural and synthetic systems suggest means to overcome these barriers. For
example, mammalian ribonucleases are capable of cytosolic entry that is mediated by
clusters of positively charged residues.11 Cellular uptake can also be enhanced by
exogenous hydrophobic moieties.12 For example, noncovalent complexation with pyrene
butyrate enables the cytosolic delivery of a green fluorescent protein (GFP) conjugate to a
cationic CPP.13 Additionally, several natural and synthetic protein transduction domains
(e.g., penetratin, TP10, and pVEC) consist of cationic and hydrophobic residues, which
impart an amphipathic character.7e,7f,14 Their hydrophobic residues are crucial for mediating
membrane translocation.
We envisioned a different strategy—one that invokes a chemoselective reaction that remodels the protein surface to become less anionic and more hydrophobic. The surface of proteins displays cationic groups (i.e., guanidinium, ammonium, and imidazolium) and anionic groups (carboxylates). We hypothesized that the esterification of its carboxyl groups could endow a protein with the ability to access the cytosol. In particular, by cloaking negative charges with a hydrophobic moiety, we might increase the nonpolar surface area while enabling endogenous positive charges to manifest favorable Coulombic interactions with anionic cell-surface components. The ensuing mode-of-action would resemble that of
small-molecule prodrugs, which have been in the pharmacopoeia for decades.15
To effect our strategy, we employed diazo compounds derived from
(p-methylphenyl)glycine. We had shown previously that the basicity of such diazo compounds
enables the efficient esterification of carboxylic acids in an aqueous environment.16 Now,
we exploited the modular nature of this scaffold. Specifically, we deimidogenated azide
precursors16,17 to access diazo compounds 1–6, which span a range of hydrophobicity
(Figure 1).
Then, we screened solution conditions for maximal protein esterification by our scaffold.
We were aware that the mechanism of esterification requires a protonated carboxyl group,18
which is encouraged by a low pH and an organic cosolvent. Using GFP and diazo compound
Mix et al. Page 2
J Am Chem Soc. Author manuscript.
Author Manuscript
Author Manuscript
Author Manuscript
3, we found that an aqueous solution at pH 6.5 that contains 20% v/v acetonitrile gives a
high yield of esters (Figure S1). These conditions should be tolerable by most proteins. Next, we evaluated diazo compounds 1–6 for their ability to esterify a protein and facilitate its internalization into a mammalian cell. We found that more polar diazo compounds alkylated more carboxyl groups than did less polar compounds (Figures 1 and S2). Then, we treated live cells with esterified proteins and quantified internalization with flow cytometry. We discovered that the level of cellular internalization parallels the number of labels per protein (Figure 1), which suggests that simply masking anionic groups is advantageous. Moreover, cellular fluorescence increases in a time-dependent manner (Figure S3), as expected for a process based on vectorial diffusion from the outside to the inside. Of the six diazo compounds, compound 1 was the most effective in engendering cellular uptake and was selected for further study. On average, 11 of the 32 carboxyl groups in GFP were masked as neutral esters by diazo compound 1 (Figure S2). Although the esterification
of 11 carboxyl groups in GFP could produce 32C11 = 1.2 × 10⁸ different molecules, esters
are most likely to form with solvent-accessible carboxyl groups that have a high pKa value
(Table S1).18 That trend was apparent in tandem mass spectrometry data (Figure S4). This
selectivity has fortuitous consequences. An aspartate or glutamate residue within a hydrophobic patch is a likely target for esterification, which would extend the size of the
patch. Clustered anionic residues likewise have high pKa values, and their esterification
would overcome a strong deterrent to cellular uptake. In contrast, an aspartate or glutamate residue within a salt bridge is unlikely to be esterified, but a salt bridge manifests less Coulombic repulsion with anionic cell-surface components than do isolated or clustered anionic residues.
We used confocal microscopy to visualize the uptake of GFP by live mammalian cells. For calibration, we compared the uptake of GFP with that of a “super-charged” variant in which
site-directed mutagenesis was used to replace anionic residues with arginine (Figure S5).5a
Unmodified GFP did not enter cells (Figure 2). Super-charged GFP did enter cells, but produced a punctate pattern of fluorescence that is suggestive of endosomal localization. At
4 °C, which is a temperature that precludes endocytosis,19 the fluorescence from
super-charged GFP was scant and localized to the plasma membrane.
Images of cells treated with GFP–1 were in marked contrast to those treated with unmodified GFP or super-charged GFP. At 37 °C, treatment with GFP–1 elicited diffuse fluorescence, suggestive of cytosolic localization (Figure 2). Most remarkably, this pattern persisted at 4 °C, indicating that uptake does not rely on endocytosis. In other words, GFP–1 appears to enter cells by passing directly through the plasma membrane, like a
small-molecule prodrug.15
To enter the nucleus, a protein must pass through the cytosol. To verify cytosolic entry, we
reiterated a known GFP variant bearing a nuclear localization signal (nlsGFP; Figure S5)20
and esterified that variant with compound 1 (Figure S6). We then treated live cells with either nlsGFP or esterified nlsGFP (nlsGFP–1) and visualized the cells with confocal microscopy. In the ensuing images (Figure 3), nlsGFP colocalizes with membrane stain
Mix et al. Page 3
Author Manuscript
Author Manuscript
Author Manuscript
(Pearson’s r = 0.21) and is excluded from the nucleus (r = −0.12). This result is expected, as GFP is impermeant but a nuclear localization signal is cationic and can form salt bridges with the anionic glycocalyx. In contrast, nlsGFP–1 not only exhibits diffuse staining like GFP–1 (Figure 2), but also colocalizes with a nuclear stain (r = 0.51) to an extent expected
for this particular variant.20 These data indicate that nlsGFP–1 accesses the nucleus and,
thus, the cytosol.
Finally, we investigated the bioreversibility of esterification. Incubation of a model protein esterified with diazo compound 1 in a mammalian cell extract resulted in the complete removal of labels (Figure S7). This finding is consistent with an inability of de-esterified GFP–1 (i.e., GFP) to escape from the cytosol and its accumulation there (Figure S3). Thus, the esters formed upon reaction with 1 are substrates for endogenous esterases, like
prodrugs.15 Moreover, the alcohol product of the esterase-mediated hydrolysis is benign to
mammalian cells (Figure S8).
In summary, we have demonstrated that esterification of protein carboxyl groups with a tuned diazo compound can engender delivery of the protein across the plasma membrane as if it were a small molecule. Further, this chemical modification is traceless, being removable by cellular esterases. This delivery strategy provides an unprecedented means to deliver native proteins into cells for applications in the laboratory and, potentially, the clinic.
Supplementary Material
Refer to Web version on PubMed Central for supplementary material.
Acknowledgments
We are grateful to Dr. K. A. Andersen for early observations, Dr. E. K. Grevstad for help with microscopy, L. B. Hyman for technical advice, Dr. T. T. Hoang for supplying FLAG–ANG, and Dr. C. L. Jenkins for contributive discussions. K.A.M. was supported by Molecular Biosciences Training Grant T32 GM007215 (NIH). J.E.L. was supported by a National Science Foundation Graduate Research Fellowship. This work was supported by grant R01 GM044783 (NIH) and made use of the National Magnetic Resonance Facility at Madison, which is supported by grant P41 GM103399 (NIH).
References
1. Dimitrov DS. Methods Mol Biol. 2012; 899:1–26. [PubMed: 22735943]
2. (a) Pisal DS, Kosloski MP, Balu-Iyer SV. J Pharm Sci. 2010; 99:2557–2575. [PubMed: 20049941] (b) Fu A, Tang R, Hardie J, Farkas ME, Rotello VM. Bioconjugate Chem. 2014; 25:1602–1608. 3. (a) Somia N, Verma IM. Nat Rev Genet. 2000; 1:91–99. [PubMed: 11253666] (b) Collins M,
Thrasher A. Proc Biol Sci. 2015; 282:20143003. [PubMed: 26702034]
4. Leader B, Baca QJ, Golan DE. Nat Rev Drug Discov. 2008; 7:21–39. [PubMed: 18097458] 5. (a) Fuchs SM, Raines RT. ACS Chem Biol. 2007; 2:167–170. [PubMed: 17319644] (b)
McNaughton BR, Cronican JJ, Thompson DB, Liu DR. Proc Natl Acad Sci USA. 2009; 106:6111– 6116. [PubMed: 19307578] (c) Bruce VJ, Lopez-Islas M, McNaughton BR. Protein Sci. 2016; 25:1129–1137. [PubMed: 26991318]
6. (a) Futami J, Yamada H. Curr Pharm Biotechnol. 2008; 9:180–184. [PubMed: 18673283] (b) Ellis GA, Palte MJ, Raines RT. J Am Chem Soc. 2012; 134:3631–3634. [PubMed: 22303837] 7. (a) Schwarze SR, Ho A, Vocero-Akbani A, Dowdy SF. Science. 1999; 285:1569–1572. [PubMed:
10477521] (b) Fuchs SM, Raines RT. Protein Sci. 2005; 14:1538–1544. [PubMed: 15930002] (c) Stanzl EG, Trantow BM, Vargas JR, Wender PA. Acc Chem Res. 2013; 46:2944–2954. [PubMed:
Mix et al. Page 4
J Am Chem Soc. Author manuscript.
Author Manuscript
Author Manuscript
Author Manuscript
23697862] (d) Nischan N, Herce HD, Natale F, Bohlke N, Budisa N, Cardoso MC, Hackenberger CPR. Angew Chem, Int Ed. 2015; 54:1950–1953.(e) LaRochelle JR, Cobb GB, Steinauer A, Rhoades E, Schepartz A. J Am Chem Soc. 2015; 137:2536–2541. [PubMed: 25679876] (f) Qian Z, Martyna A, Hard RL, Wang J, Appiah-Kubi G, Coss C, Phelps MA, Rossman JS, Pei D.
Biochemistry. 2016; 55:2601–2612. [PubMed: 27089101] (g) Nagel YA, Raschle PS, Wennemers H. Angew Chem, Int Ed. 2017; 56:122–126.
8. Zuris JA, Thompson DB, Shu Y, Guilinger JP, Bessen JL, Hu JH, Maeder ML, Joung JK, Chen ZY, Liu DR. Nat Biotechnol. 2015; 33:73–80. [PubMed: 25357182]
9. Kim S, Kim D, Cho SW, Kim J, Kim JS. Genome Res. 2014; 24:1012–1019. [PubMed: 24696461] 10. Palte MJ, Raines RT. J Am Chem Soc. 2012; 134:6218–6223. [PubMed: 22400897]
11. Turcotte RF, Lavis LD, Raines RT. FEBS J. 2009; 276:4270–4281.
12. Perrett F, Nishihara M, Takeuchi T, Futaki S, Lazar AN, Coleman AW, Sakai N, Matile S. J Am Chem Soc. 2005; 127:1114–1115.
13. Takeuchi T, Kosuge M, Tadokoro A, Sugiura Y, Nishi M, Kawata M, Sakai N, Matile S, Futaki S. ACS Chem Biol. 2006; 1:299–303. [PubMed: 17163758]
14. (a) Elmquist A, Hansen M, Langel Ü. Biochim Biophys Acta. 2006; 1758:721–729. [PubMed: 16808894] (b) Di Pisa M, Chassaing G, Swiecicki JM. Biochemistry. 2015; 54:194–207. [PubMed: 25490050]
15. (a) Testa, B., Mayer, JM. Hydrolysis in Drug and Prodrug Metabolism. Wiley–VCH; Weinheim, Germany: 2003. (b) Liederer BM, Borchardt RT. J Pharm Sci. 2006:1177–1195. [PubMed: 16639719] (c) Huttunen KM, Raunio H, Rautio J. Pharmacol Rev. 2011; 63:750–771. [PubMed: 21737530] (d) Redasani, VK., Bari, SB. Prodrug Design: Perspectives, Approaches and Applications in Medicinal Chemistry. Academic Press; New York, NY: 2015.
16. (a) McGrath NA, Andersen KA, Davis AKF, Lomax JE, Raines RT. Chem Sci. 2014; 6:752–755. (b) Mix KA, Raines RT. Org Lett. 2015; 17:2358–2361. [PubMed: 25938936] (c) Mix KA, Aronoff MR, Raines RT. ACS Chem Biol. 2016; 11:3233–3244. [PubMed: 27739661] 17. Myers EL, Raines RT. Angew Chem, Int Ed. 2009; 48:2359–2363.
18. (a) Roberts JD, Watanabe W, McMahon RE. J Am Chem Soc. 1951; 73:760–765.(b) Roberts JD, Watanabe W, McMahon RE. J Am Chem Soc. 1951; 73:2521–2523.
19. Tomoda H, Kishimoto Y, Lee YC. J Biol Chem. 1989; 264:15445–15450. [PubMed: 2768271] 20. (a) Maier K, Wagner E. J Am Chem Soc. 2012; 134:10169–10173. [PubMed: 22616892] (b) Ray
M, Tang R, Jiang Z, Rotello VM. Bioconjugate Chem. 2015; 26:1004–1007.
Mix et al. Page 5
Author Manuscript
Author Manuscript
Author Manuscript
Figure 1.
Bar graph showing the extent of esterification of the superfolder variant of GFP with diazo compounds 1–6 (black) and the internalization of the ensuing esterified GFPs into CHO-K1 cells (green). Values (± SD) were determined by mass spectrometry and flow cytometry, respectively. Parenthetical logP values were calculated with software from Molinspiration (Slovensky Grab, Slovak Republic).
Mix et al. Page 6
J Am Chem Soc. Author manuscript.
Author Manuscript
Author Manuscript
Author Manuscript
Figure 2.
Images of the cellular internalization of GFP and its super-charged and esterified variants. CHO-K1 cells were incubated with protein (15 μM) for 2 h at 37 or 4 °C. Cells were then washed, stained with Hoechst 33342 and wheat germ agglutinin (WGA)–Alexa Fluor 647, and imaged by confocal microscopy (Hoechst 33342: ex. 405 nm, em. 450 nm; WGA–Alexa Fluor 647: ex. 647 nm, em. 700 nm; GFP: ex. 488 nm, em. 525 nm). Scale bars: 25 μm.
Mix et al. Page 7
Author Manuscript
Author Manuscript
Author Manuscript
Figure 3.
Images of the nuclear internalization of a protein that contains a nuclear localization signal and its esterified variant. CHO-K1 cells were incubated with nlsGFP or nlsGFP–1 (15 μM) for 2 h at 37 °C. Cells were then washed, stained with Hoechst 33342 and WGA–Alexa Fluor 647, and imaged by confocal microscopy (Hoechst 33342: ex. 405 nm, em. 450 nm; WGA–Alexa Fluor 647: ex. 647 nm, em. 700 nm; GFP: ex. 488 nm, em. 525 nm). Scale bars: 25 μm.
Mix et al. Page 8
J Am Chem Soc. Author manuscript.
Author Manuscript
Author Manuscript
Author Manuscript
Supporting Information
Cytosolic Delivery of Proteins by Bioreversible Esterification
Kalie A. Mix,†,‡ Jo E. Lomax,§ and Ronald T. Raines*,†,‡,#
†Department of Biochemistry, §Program in Cellular and Molecular Biology, and #Department of Chemistry,
University of Wisconsin–Madison, Madison, Wisconsin 53706, United States; ‡Department of Chemistry,
Massachusetts Institute of Technology, Cambridge, Massachusetts 02139, United States *[email protected] Content Page Table of Contents S1 General Experimental S2 Chemical Synthesis S2 Protein Preparation S6 Protein Esterification S8
Mammalian Cell Culture S10
Flow Cytometry S10
Confocal Microscopy S11
Esterification Reversibility S11
Cytotoxicity Assay S12
References S11
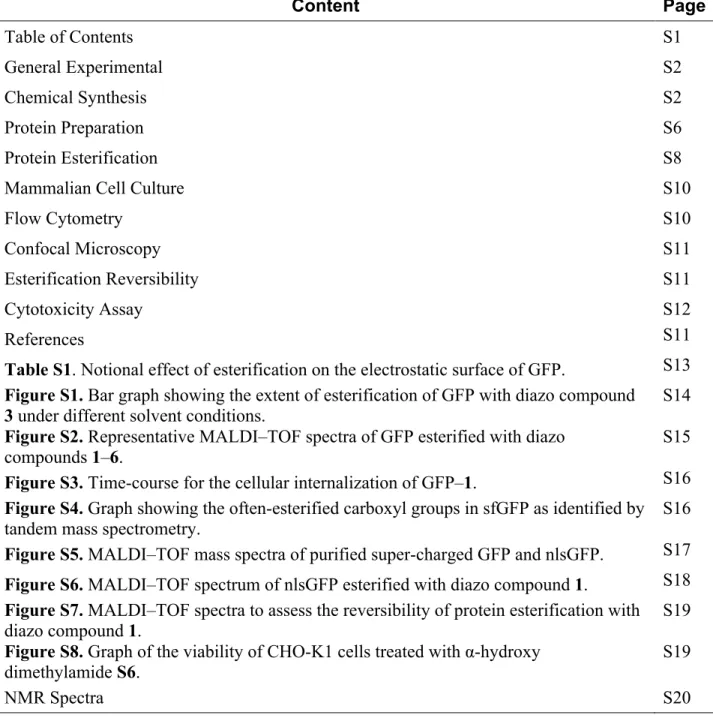
Table S1. Notional effect of esterification on the electrostatic surface of GFP. S13 Figure S1. Bar graph showing the extent of esterification of GFP with diazo compound
3 under different solvent conditions. S14
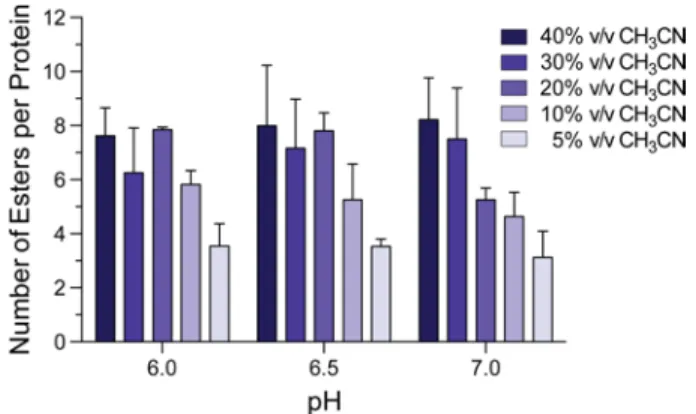
Figure S2. Representative MALDI–TOF spectra of GFP esterified with diazo
compounds 1–6. S15
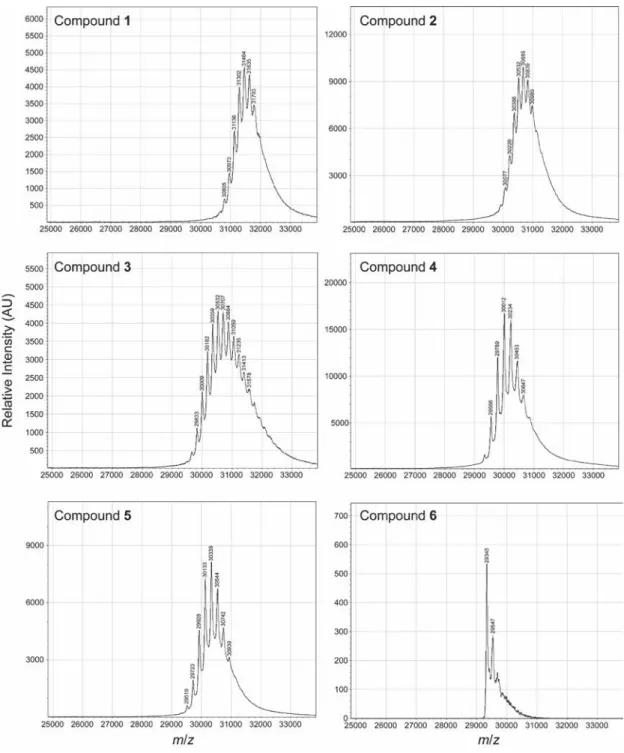
Figure S3. Time-course for the cellular internalization of GFP–1. S16 Figure S4. Graph showing the often-esterified carboxyl groups in sfGFP as identified by
tandem mass spectrometry. S16
Figure S5.MALDI–TOF mass spectra of purified super-charged GFP and nlsGFP. S17
Figure S6.MALDI–TOF spectrum of nlsGFP esterified with diazo compound 1. S18
Figure S7.MALDI–TOF spectra to assess the reversibility of protein esterification with
diazo compound 1. S19
Figure S8.Graph of the viability of CHO-K1 cells treated with α-hydroxy
dimethylamide S6. S19
Mix et al. Supporting Information
–S2–
General Experimental
Materials. Silica gel (40 µm, 230–400 mesh) was from SiliCycle. Reagent chemicals were
obtained from commercial sources and used without further purification. Dichloromethane and tetrahydrofuran were dried by passage over a column of alumina. The progress of reactions was monitored by thin-layer chromatography using plates of 250-µm silica 60-F254 from EMD
Millipore.
Conditions. All procedures were performed in air at ambient temperature (~22 °C) and
pressure (1.0 atm) unless indicated otherwise.
Solvent removal. The phrase “concentrated under reduced pressure” refers to the removal of solvents and other volatile materials using a rotary evaporator at water aspirator pressure (<20 torr) while maintaining a water bath below 40 °C. Residual solvent was removed from samples at high vacuum (<0.1 torr).
NMR spectroscopy. 1H and 13C NMR spectra for all compounds were acquired with Bruker
spectrometers in the National Magnetic Resonance Facility at Madison operating at 500 MHz. Chemical shift data are reported in units of δ (ppm) relative to an internal standard (residual solvent or TMS).
Mass spectrometry. Mass spectra were acquired at the Mass Spectrometry Facility in the Department of Chemistry at the University of Wisconsin–Madison. Electrospray ionization (ESI) mass spectra for small-molecule characterization were acquired with an LCT instrument from Waters. Atmospheric solids analysis probe (ASAP) mass spectra for small-molecule characterization were acquired with a Thermo Q Exactive Plus instrument from Thermo Fisher Scientific. Matrix-assisted laser desorption-ionization–time-of-flight (MALDI–TOF) mass spectra for protein characterization were acquired with a microflex LRF instrument form Bruker.
Melting point. The melting point of diazo compound 1 was determined with an Optimelt
automated melting point system from Stanford Research Systems.
Chemical Synthesis
Scheme S1. Route for the synthesis of diazo compound 1. Overall yield: 28% (unoptimized).
S1
2-Amino-2-(4-methylphenyl)acetic acid (5.0 g, 30.3 mmol) from Matrix Scientific was dissolved in acetonitrile (50 mL). 1,8-Diazabicyclo(5.4.0)undec-7-ene (DBU; 13.8 g, 90.9 mmol) and
p-O OH NH2 O OH N3 DBU CH3CN S O N3 O N H O
Mix et al. Supporting Information aminobenzenesulfonyl azide (8.0 g, 33.3 mmol) were added, and the resulting solution was stirred overnight. The solution was concentrated under reduced pressure. The resulting residue was dissolved in EtOAc (50 mL) and washed twice with 1 M HCl(aq). The organic layer was dried over anhydrous Na2SO4(s) and concentrated under reduced pressure to afford α-azido acid
S1(5.2 g, 90%) as a white solid. 1H NMR (500 MHz, CDCl
3, δ): 7.31 (d, 2H, J = 8.1 Hz), 7.24
(d, 2H, J = 7.9 Hz), 5.01 (s, 1H), 2.38 (s, 3H). 13C NMR (125 MHz, CDCl3, δ): 173.0, 139.7,
130.2, 129.9, 127.6, 64.8, 21.3. HRMS–ESI (m/z): [M – H]– calcd for C
9H9N3O2, 190.0622;
found 190.0622.
S1 S2
α-Azido acid S1 (5.2 g, 27.4 mmol) was dissolved in THF (100 mL). N-Hydroxysuccinimide (3.1 g, 27.4 mmol) and DCC (6.2 g, 30.1 mmol) were added, and the resulting solution was stirred overnight. The slurry was removed by filtration, and the solution was concentrated under reduced pressure. The residue was dissolved in EtOAc (50 mL) and washed with saturated aqueous NaHCO3. The organic layer was dried over anhydrous Na2SO4(s) and concentrated
under reduced pressure. The residue was purified by chromatography on silica gel, eluting with 3:7 EtOAc/hexanes to afford α-azido N-hydroxysuccinimide ester S2 (6.7 g, 85%) as a white solid. 1H NMR (500 MHz, CDCl
3, δ): 7.36 (d, 2H, J = 8.1 Hz), 7.28 (d, 2H, J = 8.0 Hz), 5.25 (s,
1H), 2.83 (s, 4H), 2.38 (s, 3H). 13C NMR (125 MHz, CDCl
3, δ): 168.4, 165.2, 140.2, 130.1,
128.8, 127.9, 63.2, 25.6, 21.3. HRMS–ESI (m/z): [M + NH4]+ calcd for C13H12N4O4, 306.1197;
found, 306.1191.
S2 S3
α-Azido N-hydroxysuccinimide ester S2 (417 mg; 1.4 mmol) was dissolved in CH2Cl2 (15 mL).
A solution of dimethylamine (0.8 mL; 2.0 M in THF) and DIEA (361 mg; 2.8 mmol) were added, and the resulting solution was stirred overnight. The solution was concentrated under reduced pressure. The residue was dissolved in EtOAc and washed twice with 1 M HCl(aq) and saturated aqueous NaHCO3 (2 × 10 mL). The organic layer was dried over anhydrous Na2SO4(s)
and concentrated under reduced pressure. The residue was purified by chromatography on silica gel, eluting with 1:1 EtOAc/hexanes to afford α-azido dimethylamide S3 (192 mg; 61%) as a white solid. 1H NMR (500 MHz, CDCl3, δ): 7.28 (d, 2H, J = 8.2 Hz), 7.23 (d, 2H, J = 8.0 Hz),
4.91 (s, 1H), 3.01 (s, 3H), 2.81 (s, 3H), 2.37 (s, 3H). 13C NMR (125 MHz, CDCl
3, δ): 169.0,
139.2, 130.7, 130.0, 127.9, 63.5, 36.9, 36.1, 21.2. HRMS–ESI (m/z): [M + H]+ calcd for
C11H14N4O, 219.1240; found, 219.1235. O OH N3 NHS DCC THF N3 O O N O O N3 O O N O O N3 O N (CH3)2NH DIEA CH2Cl2, THF
Mix et al. Supporting Information
–S4–
S3 1
α-Azido dimethylamide S3 (100 mg, 0.46 mmol) was dissolved in 20:3 THF/H2O (4.6 mL).
N-Succinimidyl 3-(diphenylphosphino)propionate (179 mg, 0.50 mmol) was added, and the resulting solution was stirred for 3 h under N2(g). 1,8-Diazabicycloundec-7-ene (DBU; 140 mg,
0.92 mmol) was added, and the solution was stirred for 1 h. The solution was diluted with brine (10 mL) and extracted with CH2Cl2 (2 × 10 mL). The organic layer was dried over anhydrous
Na2SO4(s) and concentrated under reduced pressure. The residue was purified by
chromatography on silica gel, eluting with 3:7 EtOAc/hexanes to afford α-diazo dimethylamide 1 (56 mg, 60%) as an orange solid with mp 57.2–61.6 °C. 1H NMR (500 MHz, CDCl
3, δ): 7.19 (d,
2H, J = 8.1 Hz), 7.11 (d, 2H, J = 8.2 Hz), 2.95 (s, 6H), 2.34 (s, 3H). 13C NMR (125 MHz, CDCl
3,
δ): 166.1, 135.7, 129.9, 124.7, 124.4, 37.7, 21.0. HRMS–ESI (m/z): [M + H]+ calcd for
C11H13N3O, 204.1131; found, 204.1128.
S2 S4
α-Azido N-hydroxysuccinimidyl ester S2 (1.1 g, 3.7 mmol) was dissolved in CH2Cl2 (20 mL).
Propargylamine (0.2 g, 4.0 mmol) was added, and the resulting solution was stirred overnight. The solution was concentrated under reduced pressure. The resulting residue was dissolved in EtOAc and washed with 1.0 M HCl (2 × 10 mL), followed by saturated aqueous NaHCO3 (2 ×
10 mL). The organic layer was dried with anhydrous Na2SO4(s) and concentrated under reduced
pressure to afford α-azido propargylamide S4 (0.6 g, 75%) as an off-white solid. 1H NMR (500
MHz, CDCl3, δ): 7.25 (d, J = 6.3 Hz, 2H), 7.21 (d, J = 8.1 Hz, 2H), 6.64 (s, 1H), 5.03 (s, 1H),
4.08 (dd, J = 2.5, 5.25 Hz, 2H), 2.36 (s, 3H), 2.26 (t, J = 2.4 Hz, 1H); 13C NMR (125 MHz,
CDCl3, δ): 167.8, 139.3, 131.6, 129.8, 127.7, 78.8, 72.1, 67.0, 29.4, 21.2; HRMS–ESI (m/z):
[M–N2 + H]+ calcd for C12H12N4O, 229.1084; found, 229.1085.
S4 3
α-Azido propargyl amide S4 (0.6 g, 2.7 mmol) was dissolved in 16 mL of 20:3 THF/H2O.
N-Succinimidyl 3-(diphenylphosphino)propionate (1.1 g, 3.1 mmol) was added under N2(g), and
the resulting solution was stirred for 5 h. 1,8-Diazabicycloundec-7-ene (DBU; 0.8 g, 5.5 mmol) was added, and the solution was stirred for 1 h. The solution was diluted with brine (20 mL) and extracted with CH2Cl2 (2 × 10 mL). The organic layer was dried with anhydrous Na2SO4(s) and
N3 O N N2 O N 20:3 THF/H2O 2. DBU Ph2P O O N 1. O O N3 O O N O O H2N N3 O H N CH2Cl2 N3 O H N N2 O H N 20:3 THF/H2O 2. DBU Ph2P O O N 1. O O
Mix et al. Supporting Information concentrated under reduced pressure. The residue was purified by chromatography on silica gel, eluting with 3:7 EtOAc/hexanes to afford α-diazo propargylamide 3 (0.176 g, 30%) as a red solid. 1H NMR (500 MHz, CDCl3, δ): 7.28–7.24 (m, 4H), 5.52 (s, 1H), 4.15–4.14 (dd, J = 2.5,
5.4 Hz, 2H), 2.38 (s, 3H), 2.23 (s, 1H); 13C NMR (125 MHz, CDCl
3, δ): 164.9, 138.3, 130.5,
128.0, 122.6, 79.6, 71.6, 64.0, 29.7, 21.2; HRMS–ESI (m/z): [M + H]+ calcd for C
12H11N3O,
214.0975; found, 214.0975.
4
α-Diazo benzylamide 4 was prepared as described previously1. Yields and spectral data
replicated those reported previously.
S2 S5
α-Azido N-hydroxysuccinimidyl ester S2 (3.4 g, 11.6 mmol) was dissolved in 50 mL of 20:3 THF/H2O. N-Succinimidyl 3-(diphenylphosphino)propionate (4.5 g, 12.8 mmol) was added
under N2(g), and the resulting solution was stirred for 5 h. Triethylamine (TEA; 2.3 g, 23.2
mmol) was added, and the solution was stirred for 1 h. The solution was diluted with brine (20 mL) and extracted with CH2Cl2 (2 × 10 mL). The organic layer was dried with anhydrous
Na2SO4(s) and concentrated under reduced pressure. The residue was purified by
chromatography on silica gel, eluting with 3:7 EtOAc/hexanes to afford α-diazo N-hydroxysuccinimidyl ester S5 (0.31 g, 10%) as an orange solid. 1H NMR (500 MHz, CDCl3, δ):
7.32 (d, J = 8.3 Hz, 2H), 7.22 (d, J = 8.1 Hz, 2H), 2.88 (s, 4H), 2.35 (s, 3H); 13C NMR (125
MHz, CDCl3, δ): 169.4, 160.5, 137.1, 129.9, 124.6, 119.8, 25.6, 21.1; HRMS–ASAP (m/z): [M–
N2 + H]+ calcd for C13H11N3O4, 246.0761; found, 246.0764.
S5 5
α-Diazo N-hydroxysuccinimidyl ester S2 (100 mg, 0.37 mmol) was dissolved in CH2Cl2
(37 mL). n-Pentylamine (35.4 mg, 0.41 mmol) and DIEA (143 mg, 1.1 mmol) were added, and the resulting solution was stirred overnight. The solution was concentrated under reduced pressure, and the residue was dissolved in EtOAc. The residue was purified by chromatography on silica gel, eluting with 1:4 EtOAc/hexanes to afford α-diazo pentylamide 5 (65 mg, 72%) as a red solid. 1H NMR (500 MHz, CDCl 3, δ): 7.26–7.23 (m, 4H), 5.37 (s, 1H), 3.36–3.32 (q, J = 7.0 13 N2 O H N 20:3 THF/H2O 2. TEA Ph2P O ON 1. O O N3 O O N O O N2 O O N O O N2 O O N O O N2 O H N DIEA CH2Cl2 NH2
Mix et al. Supporting Information
–S6–
NMR (125 MHz, CDCl3, δ): 164.9, 137.9, 130.4, 127.8, 123.3, 63.8, 40.3, 29.6, 29.0, 22.3, 21.2,
14.0; HRMS–ESI (m/z): [M–N2 + H]+ calcd for C14H19N3O, 218.1539; found, 218.1541.
S5 6
α-Diazo N-hydroxysuccinimidyl ester S5 (55 mg, 0.20 mmol) was dissolved in CH2Cl2 (20 mL).
1-Pyrene methylamine (47.0 mg, 0.2 mmol) was added, and the solution was stirred overnight. The solution was concentrated under reduced pressure, and the residue was dissolved in EtOAc. The residue was purified by chromatography on silica gel, eluting with 1:1 EtOAc/hexanes to afford α-diazo pyrenylamide 6 (18 mg, 23%) as an orange solid. 1H NMR (500 MHz, CDCl3, δ):
8.35 (d, 1H, J = 9.2 Hz), 8.28–8.22 (m, 3H), 8.17 (d, 1H, J = 7.8 Hz), 8.13–8.06 (m, 3H), 8.00 (d, 1H, J = 7.8 Hz), 7.21 (d, 2H, J = 8.2 Hz), 7.15 (d, 2H, J = 8.1 Hz), 5.78 (t, 1H, J = 4.8 Hz), 5.31 (d, 2H, J = 5.4 Hz), 2.29 (s, 3H); 13C NMR (125 MHz, CDCl
3, δ): 164.7, 137.9, 131.2,
131.17, 130.9, 130.7, 130.4, 129.0, 128.2, 127.7, 127.5, 127.2, 127.1, 126.1, 126.0, 125.4, 125.3, 125.0, 124.8, 124.6, 122.8, 64.0, 42.6, 21.0; HRMS–ASAP (m/z): [M + H]+ calcd for
C26H19N3O, 390.1601; found, 390.1596.
1 S6
α-Diazo dimethylamide 1 (80 mg, 0.39 mmol) was dissolved in 10 mL of 3:10 CH3CN/H2O.
Acetic acid (10 µL, 0.17 mmol) was added, and the resulting solution was stirred for 1 h. The solution was concentrated under reduced pressure, and the residue was dissolved in EtOAc. The residue was purified by chromatography on silica gel, eluting with 3:7 EtOAc/hexanes. The eluate was purified further by recrystallization from DCM and hexanes to afford α-hydroxy dimethylamide S6 (6 mg, 14%) as a white solid. 1H NMR (500 MHz, CDCl
3, δ): 7.21 (d, 2H, J =
8.2 Hz), 7.17 (d, 2H, J = 8.1 Hz), 5.17 (d, 1H, J = 6.4 Hz), 4.71 (d, 1H, J = 6.4 Hz), 3.03 (s, 3H), 2.78 (s, 3H), 2.34 (s, 3H); 13C NMR (125 MHz, CDCl
3, δ): 172.5, 138.3, 136.2, 129.7, 127.4,
71.3, 36.4, 36.3, 21.2; HRMS–ASAP (m/z): [M + H]+ calcd for C
11H15NO2, 194.1176; found,
194.1176.
Protein Preparation
Preparation of Green Fluorescent Protein (GFP)
The “superfolder” variant of GFP was prepared as described previously2. The protein was
dialyzed into 10 mM Bis-Tris buffer, pH 6.5, prior to esterification.
Preparation of Super-Charged GFP
A gene encoding enhanced GFP was amplified from a mammalian expression vector (Promega) and inserted into a novel vector derived from a pET vector (Novagen). The following
N2 O H N N2 O O N O O NH2 CH2Cl2 N2 O N O N OH AcOH 3:10 CH3CN/H2O
Mix et al. Supporting Information substitutions were introduced using site-directed mutagenesis to recapitulate those in the “superfolder”3 and “cell-penetrating”4 variants: F64L, S65T, F99S, M153T, V163A, S30R,
Y145F, I171V, A106V, Y39I, N105K, I128T, K166T, I167V, S205T, L221H, F223Y, T225N, E17R, D19R, D21R, V111R, and E124R. The expression vector was transformed into BL21(DE3) electrocompetent E. coli cells (New England Biolabs) and plated on LB agar containing ampicillin (amp; 200 µg/mL). The resulting plates were incubated overnight at 37 °C. A single colony was added to 50 mL of LB–amp (which contained 200 µg/mL amp) and incubated overnight at 37 °C in a shaking incubator. On the following day, 10 mL of starter culture was added to each of 4 L of Terrific Broth–amp medium (which contained 200 µg/mL amp). Cultures were grown at 37 °C in a shaking incubator until the cell density reached an OD600 = 0.6–0.8. Cultures were incubated for 20 min at 20 °C, and then induced by the addition
of IPTG (to 1.0 mM). Cells were grown overnight at 20 °C in a shaking incubator.
Cells were harvested by centrifugation at 5,000 rpm for 20 min at 4 °C. Cell pellets were collected and resuspended in 15 mL of lysis buffer per 1 L liquid growth. (Lysis buffer was 50 mM Tris–HCl buffer, pH 7.0, containing 100 mM NaCl, 30 mM imidazole, 1% v/v Triton X-100, and 20% w/v sucrose.) The resuspended cells were stored frozen overnight at –20 °C. On the following day, cells were thawed and lysed by mechanical disruption using a cell disruptor (Constant Systems) at 22 kPsi. The lysate was cleared by centrifugation at 11,000 rpm for 1 h at 4 °C. The supernatant was collected and filtered through a 0.2-µm PES filter (GE Healthcare). Super-charged GFP in the filtered cell lysate was purified by chromatography with a HisTrap nickel column (GE Healthcare). The binding (wash) buffer was 20 mM sodium phosphate buffer, pH 7.4, containing NaCl (0.50 M) and imidazole (30 mM). The elution buffer was 20 mM sodium phosphate buffer, pH 7.4, containing NaCl (0.50 M) and a linear gradient of imidazole (30 mM–0.50 M). Eluted fractions were pooled and dialyzed against 4 L of 20 mM Tris–HCl buffer, pH 7.4, containing EDTA (1.0 mM).
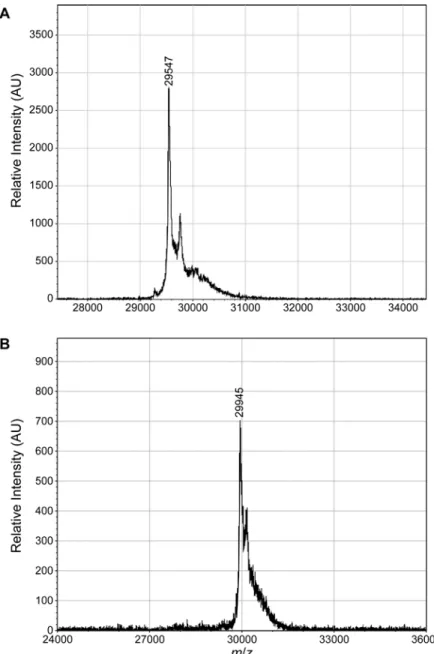
Dialyzed material was purified further by chromatography with a HiTrap SP HP cation-exchange column (GE Healthcare). The binding (wash) buffer was 20 mM Tris–HCl buffer, pH 7.4, containing EDTA (1.0 mM). The elution buffer was 20 mM Tris–HCl buffer, pH 7.4, containing EDTA (1.0 mM) and NaCl (1.0 M). Upon elution, colored fractions were pooled and dialyzed against PBS overnight and concentrated as needed. m/z, 29,547; expected: 29,539 (Supplementary Figure 1a).
Preparation of GFP Containing a Nuclear Localization Sequence (nlsGFP)
A vector containing the gene that encodes “superfolder” GFP gene was reported previously.2
This vector was modified to install a nuclear localization sequence3 at the N-terminus of the
encoded protein by using the primers:
5′–AAGAAACGCAAGGTACTGGTCCCGGTGGCGACAGTGAGCAAGGGCGAGGAGC–3′
5′–CGGGACCAGTACCTTGCGTTTCTTCTTCGGCATATCTATATCTCCTTCTTAAGGTAAA–3′ In addition, the His6 tag was moved from the N terminus to the C terminus, and the TEV
Mix et al. Supporting Information –S8– 1 50 MPKKKRKVLVPVATVSKGEELFTGVVPILVELDGDVNGHKFSVRGEGEGDA TIGKLTLKFICTTGKLPVPWPTLVTTLTYGVQCFSRYPDHMKQHDFFKSA MPEGYVQERTISFKDDGKYKTRAVVKFEGDTLVNRIELKGTDFKEDGNIL GHKLEYNFNSHNVYITADKQKNGIKANFTVRHNVEDGSVQLADHYQQNTP IGDGPVLLPDNHYLSTQTVLSKDPNEKRDHMVLHEYVNAAGITLGMDELY KAVDKLAAALEHHHHHH
The expression vector was transformed into BL21(DE3) electrocompetent E. coli cells (New England Biolabs). The resulting cells were plated on LB agar containing amp (200 µg/mL), and the plates were incubated overnight at 37 °C. A single colony was added to 50 mL of LB–amp (which contained 200 µg/mL amp), and the resulting culture was incubated overnight at 37 °C in a shaking incubator. On the following day, 10 mL of starter culture was added to each of 4 L of Terrific Broth–amp medium (which contained 200 µg/mL amp). Cultures were grown at 37 °C in a shaking incubator until the cell density reached an OD600 of 0.6–0.8. Cultures were incubated
for 20 min at 20 °C, and then induced by the addition of IPTG (to 1.0 mM). Cells were grown overnight at 20 °C in a shaking incubator.
Cells were harvested by centrifugation at 5,000 rpm for 20 min at 4 °C. Cell pellets were collected and resuspended in 15 mL of lysis buffer per 1 L of liquid growth. (Lysis buffer was 50 mM Tris–HCl buffer, pH 7.0, containing 100 mM NaCl, 30 mM imidazole, 1% v/v Triton X-100, and 20% w/v sucrose.) The resuspended cells were stored frozen overnight at –20 °C. On the following day, cells were thawed and lysed by mechanical disruption using a cell disruptor (Constant Systems) at 22 kPsi. The lysate was cleared by centrifugation for 1 h at 11,000 rpm at 4 °C. The supernatant was collected and filtered through a 0.2-µm PES filter (GE Healthcare), and nlsGFP was purified by chromatography using a HisTrap nickel column, dialysis, and anion-exchange chromatography, as described above m/z, 29,945; expected: 29,943 (Supplementary Figure 1b).
Protein Esterification
Optimization of Solvent Conditions for GFP Esterification
A solution of diazo compound 3 (1.2 mg, 0.054 µmol) in acetonitrile was added to a solution of GFP (0.0017 µmol) in 10 mM Bis-Tris buffer (pH 6.0, 6.5, or 7.0). Additional Bis-Tris buffer was added so that the final composition of the solution ranged from 5–40% v/v acetonitrile. The esterification reaction was incubated for 4 h at 37 °C. Precipitated protein was removed by filtration through a 0.2-µm PES syringe filter (GE Healthcare), and the number of esters per protein was assigned from the mass of the peak with the highest relative intensity in the MALDI–TOF mass spectrum. The mildest condition that enabled a high level of esterification was 10 mM Bis-Tris buffer, pH 6.5, containing acetonitrile (20% v/v) (Supplementary Figure 2).
N2 O H N 3 GFP (CO2H)32 – n O O O N H n GFP (CO2H)32
Mix et al. Supporting Information
Esterification of GFP with Diazo Compounds 1–6
A solution of diazo compound 1–6 (34.1 µmol) in acetonitrile (400 µL) was added to a solution of GFP (0.341 µmol) in 1600 µL of 10 mM Bis-Tris buffer, pH 6.5, and incubated for 4 h at 37 °C. Precipitated protein was removed by filtration through a 0.2-µm PES syringe filter (GE Healthcare). The number of esters per protein was assigned from the mass of the peak with the highest relative intensity in the MALDI–TOF mass spectrum (Supplementary Figure 3). Protein in each mixture was then purified and exchanged into PBS buffer using PD10 desalting columns (GE Healthcare). Protein was concentrated as needed by centrifugation, and the protein concentration was determined with a Bradford assay (Thermo Fisher Scientific).
Identification of GFP Carboxyl Groups Esterifed with Diazo Compound 1
For each digest, a 10-µg aliquot of protein solution was diluted with water to 100 µL, and 1 µL of 10% v/v aqueous formic acid was added. Immobilized pepsin (Thermo Fisher Scientific product 20343) was washed with 0.1% v/v formic acid according to the manufacturer's instructions and resuspended as a 50% slurry. A 50-µL aliquot of the immobilized pepsin slurry was added to each sample. Samples were placed on a shaking incubator at 37 °C at 200 rpm and incubated for 2, 5, 10, or 20 min. Upon removal from the incubator, samples were subjected to centrifugation, and the supernatant was removed to quench the digestion.
Data were acquired on an Orbitrap Elite mass spectrometer equipped with a Thermo EasySpray column (15 cm × 75 µm, packed with 3-µm PepMap C18 resin) and eluted over a 45-min gradient using solvents of 0.1% v/v formic acid in water (A) and 0.1% v/v formic acid in acetonitrile (B). A top-20 method was used to acquire MS/MS spectra on the 20 highest abundance precursors in each MS scan with dynamic exclusion of precursors that had been selected already within the preceding 30 s for MS/MS analysis.
Data were searched against an e.coli database to which was added the sfGFP sequence, and the +175 modification was allowed as a variable modification. Pepsin was used as the enzyme specificity with up to 4 missed cleavages per peptide. Precursor tolerance was set at 15 ppm, and MS/MS fragment ion tolerance was set to 0.5 Da (MS/MS data collected in the linear ion trap portion of the Orbitrap Elite).
Residues identified as being esterified are indicated in red:
1 50
MHHHHHHSSGVDLGTENLYFQGMVSKGEELFTGVVPILVELDGDVNGHKFS
VRGEGEGDATIGKLTLKFICTTGKLPVPWPTLVTTLTYGVQCFSRYPDHM
KQHDFFKSAMPEGYVQERTISFKDDGKYKTRAVVKFEGDTLVNRIELKGT
DFKEDGNILGHKLEYNFNSHNVYITADKQKNGIKANFTVRHNVEDGSVQL ADHYQQNTPIGDGPVLLPDNHYLSTQTVLSKDPNEKRDHMVLHEYVNAAG ITLGMDELYK 1–6 10 mM Bis-Tris buffer, pH 6.5 20% v/v CH3CN 4 h, 37 °C GFP (CO2H)32 GFP (CO2H)32 – n O O O N n R1 R2
Mix et al. Supporting Information
–S10–
Note: This GFP variant contains additional residues at its N and C termini relative to the protein used to calculate the electrostatic surface in Table S1; thus, 3 esterified carboxyl groups are not listed in Table S1.
Esterification of nlsGFP with Diazo Compound 1
A solution of diazo compound 1 (3.5 mg, 17.1 µmol) in acetonitrile (400 µL) was added to a solution of nlsGFP (0.341 µmol) in 1.6 mL of 10 mM Bis-Tris buffer, pH 6.5, and the resulting solution was incubated for 4 h at 37 °C. Precipitated protein was removed by filtration through a 0.2-µm PES syringe filter (GE Healthcare). Protein was purified and exchanged into PBS buffer using a PD10 desalting column (GE Healthcare). The number of esters per protein was assigned from the peak with the highest relative intensity in the MALDI–TOF mass spectrum (Supplementary Figure 4). Protein was concentrated as needed, and the protein concentration was determined with a Bradford assay (Thermo Fisher Scientific).
Mammalian Cell Culture
Chinese hamster ovary- (CHO-) K1 cells were from the American Tissue Culture Collection and cultured according to recommended protocols. Cells were grown in F12K nutrient medium supplemented with fetal bovine serum (10% v/v), penicillin (100 units/mL) and streptomycin (100 µg/mL). Cells were grown in T75 sterile culture flasks in a cell culture incubator at 37 °C under CO2 (5% v/v). Cells were counted to determine seeding density using a hemacytometer.
Flow Cytometry
Cells were seeded at a density of 50,000 cell/well in a sterile 8-well dish (Ibidi) 24 h prior to treatment. Cells were incubated with either unmodified GFP or GFP esterified with compounds
1–6 (15 µM) in F12K medium supplemented with penicillin (100 units/mL) and streptomycin
(100 µg/mL) for 2 h at 37 °C. Cells were rinsed twice with DPBS, and released from the plate with 250 µL of 0.25% v/v trypsin–EDTA mix. Tryspin was quenched by the addition of 500 µL of medium, and cells were then subjected to centrifugation for 5 min at 130g. Cells were resuspended in 300 µL of DPBS supplemented with fetal bovine serum (10% v/v). 7AAD stain (10 µL of a 1.0 mg/mL solution)was added to each sample, and cells were kept on ice until the time of analysis. The fluorescence intensity of at least 10,000 events was measured by flow cytometry with an Accuri C6 flow cytometer (BD Biosciences). The median fluorescence intensity of live, single cells is reported.
Time-Dependence of GFP–1 Internalization
Cells were seeded at a density of 100,000 cells/well in a sterile 12-well dish (CellStar) 24 h prior to treatment. The cells were then incubated with GFP–1 (4 µM) in F12K medium supplemented with penicillin (100 units/mL) and streptomycin (100 µg/mL) for 30, 120, or 240 min at 37 °C.
10 mM Bis-Tris buffer, pH 6.5 20% v/v CH3CN 4 h, 37 °C nlsGFP (CO2H)32 nlsGFP (CO2H)32 – n O O O N n N2 O N 1
Mix et al. Supporting Information Cells were rinsed with DPBS, and released from the plate with 250 µL of 0.05% trypsin–EDTA. Trypsin was quenched by the addition of 250 µL of medium. Propidium iodide was added to each sample (final concentration: 10 µg/mL), and cells were kept on ice until the time of analysis. The fluorescence intensity of at least 10,000 events was measured by flow cytometry with a FACS Canto II HTS flow cytometer (BD Biosciences). The median fluorescence intensity of live, single cells is reported (Figure S3).
Confocal Microscopy Internalization of GFP–1
Cells were seeded at a density of 50,000 cell/well in a sterile 8-well dish (Ibidi) 24 h prior to treatment. Cells were incubated with either unmodified GFP or GFP–1 (15 µM) in F12K medium supplemented with penicillin (100 units/mL) and streptomycin (100 µg/mL) for 2 h at 37 °C. Cells were rinsed twice with DPBS, and nuclei were stained by incubation with Hoechst 33342 dye (2 µg/mL) for 5 min at 37 °C. Cell membranes were stained by incubation with wheat germ agglutinin (WGA)–Alexa Fluor® 647 dye (5 µg/mL) for 15 min on ice. Cells were then
washed twice and kept in medium on ice until the time of analysis. Live cells were examined using a Nikon A1R+ scanning confocal microscope. The results are shown in Figure 2. Image acquisition and processing settings were maintained between all samples.
Internalization of GFP, Super-Charged GFP, and GFP–1 at 37 °C and 4 °C
Cells were seeded at a density of 50,000 cell/well in a sterile 8-well dish (Ibidi) 24 h prior to treatment. Cells were incubated with unmodified GFP, super-charged GFP, or GFP–1 (15 µM) in F12K medium supplemented with penicillin (100 units/mL) and streptomycin (100 µg/mL) for 2 h at either 37 or 4 °C. Cells were rinsed twice with DPBS, and nuclei were stained by incubation with Hoechst 33342 dye (2 µg/mL) for 5 min at 37 °C. Cell membranes were stained by incubation with WGA–Alexa Fluor® 647 dye (5 µg/mL) for 15 min on ice. Cells were then washed twice and kept in medium on ice until the time of analysis. Live cells were examined using a Nikon A1R+ scanning confocal microscope. Image acquisition and processing settings were maintained between all samples. The results are shown in Figure 2.
Internalization of nlsGFP and nlsGFP–1
Cells were seeded at a density of 50,000 cell/well in a sterile 8-well dish (Ibidi) 24 h prior to treatment. Cells were incubated with either unmodified GFP or nlsGFP–1 (15 µM) in F12K medium supplemented with penicillin (100 units/mL) and streptomycin (100 µg/mL) for 2 h at 37 °C. Cells were rinsed twice with DPBS, and nuclei were stained by incubation with Hoechst 33342 dye (2 µg/mL) for 5 min at 37 °C. Cell membranes were stained by incubation with WGA–Alexa Fluor® 647 dye (5 µg/mL) for 15 min on ice. Cells were then washed twice and
kept in medium on ice until the time of analysis. Live cells were examined using a Nikon A1R+ scanning confocal microscope. Image acquisition and processing settings were maintained between all samples. The results are shown in Figure 3. Pearson’s correlation coefficient (r) was calculated with the PSC colocalization plugin in ImageJ software.
Esterification Reversibility
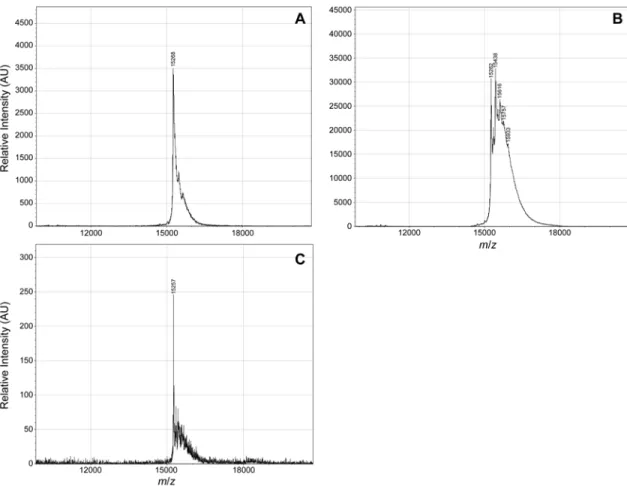
Unlike GFP, human angiogenin is a small protein (15.3 kDa) that maintains its structure after incubation with a detergent-containing cell lysate and produces a well-resolved peak in a MALDI–TOF spectrum. Moreover, a FLAG-tagged variant of angiogenin5 binds to an
anti-Mix et al. Supporting Information
–S12–
FLAG antibody with extremely high affinity, thus enabling high recovery of this protein from a cell lysate. Thus, we used angiogenin for a rigorous assessment of the bioreversibility of protein esterification with diazo compound 1.
Diazo compound 1 (437 µg, 2.2 µmol) in acetonitrile (40 µL) was added to a solution of FLAG–angiogenin (0.043 µmol) in 160 µL of 10 mM Bis-Tris buffer, pH 6.5. The resulting solution was incubated at 37 °C for 4 h, and the number of esters was determined with MALDI– TOF mass spectrometry. Acetonitrile was removed using a Vivaspin filtration column (5,000 MWCO) from GE Life Sciences. The resulting solution was added to a CHO-cell extract (50 µL), which was prepared by using CelLytic M lysis reagent (Sigma–Aldrich product C2978) supplemented with 1× protease inhibitor (Thermo Fisher Scientific product 78430). The solution was incubated at 25 °C overnight. FLAG–angiogenin was reisolated using anti-FLAG magnetic beads from Sigma–Aldrich and analyzed again with MALDI–TOF mass spectrometry (Figure S7).
Cytotoxicity Assay
The cytotoxicity of compound S4 was measured with a CellTiter96® AQueous One Cell
Proliferation (MTS) Assay from Promega according to the manufacturer’s instructions. Cells were plated at a density of 50,000 cells/well in a sterile 96-well plate 24 h prior to treatment. Cells were treated with either vehicle (1% v/v DMSO in medium) or compound S6(50–500 µM in 1% v/v DMSO in medium) for 2½ h. The medium was replaced, and 20 µL of CellTiter96®
AQeous One Solution Reagent was added to each well. Cells were incubated for 1 h, and absorbance at 490 nm was measured with a Tecan Infinite M1000 plate reader. Cell viability is expressed relative to vehicle control (Figure S8).
References
(1) Mix, K. A.; Raines, R. T. Org. Lett. 2015, 17, 2358–2361.
(2) Andersen, K. A.; Smith, T. P.; Lomax, J. E.; Raines, R. T. ACS Chem. Biol. 2016, 11, 319– 323.
(3) Pédelacq, J. D.; Cabantous, S.; Tran, T.; Terwilliger, T. C.; Waldo, G. S. Nat. Biotechnol.
2006, 24, 79–88.
(4) Fuchs, S. M.; Raines, R. T. ACS Chem. Biol. 2007, 2, 167–170. (5) Hoang, T. T.; Raines, R. T. Nucleic Acids. Res. 2017, 45, 818–831.
Mix et al. Supporting Information
Table S1. Notional effect of esterification on the electrostatic surface of GFP.
Residue
type Residue number Calculated pKaa Esterified?
b Calculated electrostatic surfacesc
Lys 140 12.55 GFP (Z = –9) front back esterified GFP (Z = +2) front back Lys 45 12.53 Lys 209 12.47 Lys 79 12.43 Lys 3 12.41 Lys 131 12.31 Lys 162 12.19 Lys 113 12.07 Lys 101 12.06 Lys 41 12.05 Lys 105 11.96 Lys 26 11.93 Lys 126 11.86 Lys 107 11.79 Lys 85 11.10 Glu 222 8.64 His 139 7.54 His 77 7.43 His 217 7.41 His 25 7.30 His 81 7.15 His 231 7.13 His 221 7.12 Asp 82 6.44 His 148 6.44 His 199 5.65 His 181 5.57 Asp 103 4.88 Glu 124 4.75 Asp 155 4.71 Glu 115 4.67 Glu 172 4.61 Glu 6 4.59 Glu 90 4.58 Glu 132 4.50 Glu 142 4.47 Glu 95 4.42 Glu 34 4.41 Glu 17 4.34 Glu 5 4.27 Glu 213 4.24 Asp 190 4.17 Glu 32 4.16 Asp 129 4.13 Asp 133 4.09 Asp 117 4.03 His 169 3.76 Asp 197 3.76 Asp 36 3.75 Asp 180 3.71 Asp 19 3.69 Asp 21 3.54 Asp 76 3.53 Asp 102 3.34 Asp 216 2.72 Asp 210 2.62 Asp 173 2.51 apK
a values were calculated with the program Depth (Tan, K.P.; Nguyen, T.B.; Patel, S.; Varadarajan, R.; Madhusudhan, M. S.
Nucleic Acids Res. 2013, 41, W314–W321. bEsterification with diazo compound 1, as detected by MS/MS analysis. cElectrostatic
surfaces were calculated with the program PyMOL from Schrödinger (New York, NY). Glu222 and Asp82 (red highlight in table) are not solvent accessible. To generate the “esterified GFP” image, the other eleven aspartate and glutamate residues (green highlight
Mix et al. Supporting Information
–S14–
Figure S1. Bar graph showing the extent of
esterification of GFP with diazo compound 3 under different solvent conditions.
Mix et al. Supporting Information
Figure S2. Representative MALDI–TOF spectra of GFP esterified with diazo compounds 1–6 (100 equiv, 3 equiv per carboxyl group) in 10 mM Bis-Tris buffer, pH 6.5, containing CH3CN
Mix et al. Supporting Information
–S16–
Figure S3. Time-course for the cellular
internalization of GFP–1. CHO-K1 cells were incubated with GFP–1 (4 µM) at 37 °C, and internalization was quantified by flow cytometry after 30, 120, and 240 min.
Peptide Residues Peptidic sfGFP Number 2b3p Number Modified Residue
MHHHHHHSSGVDLGTENL 1–18 Glu16 NA
YFQGMVSKGEEL 14–20 Glu29 Glu6
VELDGDVNGHKFSVRGEGEGDATIGKLTLKF 39–69 Glu40 Glu17
VELDGDVNGHKFSVRGEGEGDATIGKLTLKF 39–69 Asp42 Asp19
VELDGDVNGHKFSVRGEGEGDATIGKL 39–65 Glu57 Glu34
KSAMPEGYVQERTISF 108–123 Glu113 Glu90
KSAMPEGYVQERTISF 108–123 Glu118 Glu95
KDDGKYKTRAVVKFEGDTLVNRIEL 124–148 Asp140 Asp117
KDDGKYKTRAVVKFEGDTLVNRIEL 124–148 Glu147 Glu124
KGTDFKEDGNILGHKLEYNF 149–168 Glu165 Glu142
TVRHNVEDGSVQL 189–201 Glu195 Glu172
ADHYQQNTPIGDGPVL 202–217 Asp213 Asp190
GMDELYK 255–261 Asp257 NA
HEYVNAAGITLGMDELYK 244-261 Glu258 NA
Figure S4. Graph showing the often-esterified carboxyl groups in sfGFP as identified by tandem
mass spectrometry. Values of calculated carboxyl group pKa are for PDB entry 2b3p (Table S1).
Mix et al. Supporting Information
Figure S5. MALDI–TOF mass spectra of purified super-charged GFP and nlsGFP. (A) Super-charged GFP. m/z, 29,547; expected: 29,536 without an N-terminal methionine residue. (B) nlsGFP. m/z, 29,945; expected: 29,940 without an N-terminal methionine residue.
Mix et al. Supporting Information
–S18–
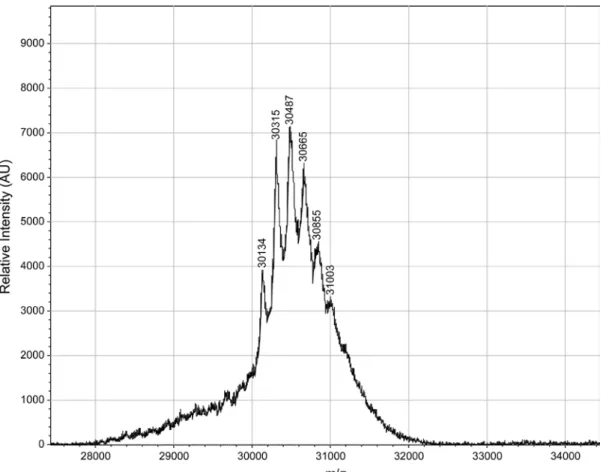
Figure S6. MALDI–TOF spectrum of nlsGFP esterified with diazo compound 1. Expected m/z: 29,943 + 175 per ester group.
Mix et al. Supporting Information
Figure S7. MALDI–TOF spectra to assess the reversibility of protein esterification with diazo compound 1. (A) FLAG–angiogenin. (B) FLAG–angiogenin after treatment with diazo compound 1. (C) FLAG–angiogenin after treatment with diazo compound 1 and subsequent incubation with a CHO-cell extract. Expected m/z: 15,270 + 175 per ester group.
Figure S8. Graph of the viability of CHO-K1 cells treated with α-hydroxy dimethylamide S6.
Mix et al. Supporting Information –S20– NMR Spectra 1H NMR spectrum of compound S1in CDCl 3 (500 MHz): 13C NMR spectrum of compound S1 in CDCl 3 (125 MHz): -3 -2 -1 0 1 2 3 4 5 6 7 8 9 10 11 12 13 14 15 16 f1 (ppm) 3 .0 0 1 .0 0 2 .0 6 2 .0 5 2 .3 8 5 .0 1 7 .2 3 7 .2 5 7 .2 6 7 .3 0 7 .3 1 -10 0 10 20 30 40 50 60 70 80 90 100 110 120 130 140 150 160 170 180 190 200 210 f1 (ppm) 2 1 .2 5 6 4 .8 3 1 2 7 .6 3 1 2 9 .9 1 1 3 0 .2 1 1 3 9 .7 0 1 7 2 .9 6 O OH N3
Mix et al. Supporting Information 1H NMR spectrum of compound S2in CDCl 3 (500 MHz): 13C NMR spectrum of compound S2in CDCl 3 (125 MHz): -3 -2 -1 0 1 2 3 4 5 6 7 8 9 10 11 12 13 14 15 16 f1 (ppm) 3 .0 4 4 .0 0 1 .0 0 2 .0 0 2 .0 0 2 .3 8 2 .8 3 5 .2 5 7 .2 7 7 .2 9 7 .3 5 7 .3 7 -10 0 10 20 30 40 50 60 70 80 90 100 110 120 130 140 150 160 170 180 190 200 210 f1 (ppm) 2 1 .3 0 2 5 .5 5 6 3 .2 2 1 2 7 .9 4 1 2 8 .7 8 1 3 0 .0 8 1 4 0 .2 0 1 6 5 .2 3 1 6 8 .3 5 N3 O O N O O
Mix et al. Supporting Information –S22– 1H NMR spectrum of compound S3in CDCl 3 (500 MHz): 13C NMR spectrum of compound S3in CDCl 3 (125 MHz): -3 -2 -1 0 1 2 3 4 5 6 7 8 9 10 11 12 13 14 15 16 f1 (ppm) 3 .0 5 3 .0 0 3 .0 0 0 .9 7 2 .0 0 1 .9 9 2 .3 7 2 .8 1 3 .0 1 4 .9 1 7 .2 2 7 .2 4 7 .2 7 7 .2 8 -10 0 10 20 30 40 50 60 70 80 90 100 110 120 130 140 150 160 170 180 190 200 210 f1 (ppm) 2 1 .2 2 3 6 .0 8 3 6 .8 5 6 3 .5 0 1 2 7 .8 8 1 3 0 .0 1 1 3 0 .6 8 1 3 9 .2 2 1 6 8 .9 7 N3 O N
Mix et al. Supporting Information 1H NMR spectrum of compound 1in CDCl 3 (500 MHz): 13C NMR spectrum of compound 1in CDCl 3 (125 MHz): -3 -2 -1 0 1 2 3 4 5 6 7 8 9 10 11 12 13 14 15 16 f1 (ppm) 3 .0 0 6 .0 0 2 .0 0 2 .0 3 2 .3 4 2 .9 5 7 .1 0 7 .1 2 7 .1 8 7 .1 9 -10 0 10 20 30 40 50 60 70 80 90 100 110 120 130 140 150 160 170 180 190 200 210 f1 (ppm) 2 1 .0 1 3 7 .7 4 1 2 4 .3 7 1 2 4 .6 8 1 2 9 .8 5 1 3 5 .6 5 1 6 6 .0 7 N2 O N
Mix et al. Supporting Information –S24– 1H NMR spectrum of compound 2 in CDCl 3 (500 MHz): 13C NMR spectrum of compound 2 in CDCl 3 (125 MHz): -1.0 -0.5 0.0 0.5 1.0 1.5 2.0 2.5 3.0 3.5 4.0 4.5 5.0 5.5 6.0 6.5 7.0 7.5 8.0 8.5 9.0 9.5 10.0 10.5 11.0 11.5 12.0 12.5 13.0 f1 (ppm) 3 .0 3 3 .0 1 0 .9 8 4 .4 1 2 .3 7 2 .8 9 2 .9 0 5 .3 6 7 .2 5 -10 0 10 20 30 40 50 60 70 80 90 100 110 120 130 140 150 160 170 180 190 200 210 f1 (ppm) 2 1 .1 6 2 6 .9 6 6 3 .7 3 1 2 3 .1 6 1 2 7 .9 2 1 3 0 .4 1 1 3 7 .9 9 1 6 5 .6 1 N2 O H N
Mix et al. Supporting Information 1H NMR spectrum of compound S4 in CDCl 3 (500 MHz): 13C NMR spectrum of compound S4 in CDCl 3 (125 MHz): -1.0 -0.5 0.0 0.5 1.0 1.5 2.0 2.5 3.0 3.5 4.0 4.5 5.0 5.5 6.0 6.5 7.0 7.5 8.0 8.5 9.0 9.5 10.0 f1 (ppm) 0 .9 7 3 .0 1 2 .0 2 1 .0 0 0 .9 9 4 .2 0 2 .2 6 2 .2 6 2 .2 7 2 .3 6 4 .0 7 4 .0 7 4 .0 8 4 .0 9 5 .0 3 6 .6 4 7 .2 0 7 .2 2 7 .2 4 7 .2 6 -10 0 10 20 30 40 50 60 70 80 90 100 110 120 130 140 150 160 170 180 190 200 210 f1 (ppm) 2 1 .2 3 2 9 .3 9 6 6 .9 7 7 2 .1 3 7 8 .8 0 1 2 7 .6 5 1 2 9 .8 4 1 3 1 .5 7 1 3 9 .3 2 1 6 7 .8 0 N3 O H N
Mix et al. Supporting Information –S26– 1H NMR spectrum of compound 3 in CDCl 3 (500 MHz): 13C NMR spectrum of compound 3 in CDCl 3 (125 MHz): -1. -1.0 -0.5 0.0 0.5 1.0 1.5 2.0 2.5 3.0 3.5 4.0 4.5 5.0 5.5 6.0 6.5 7.0 7.5 8.0 8.5 9.0 9.5 10.0 10.5 11.0 11.5 2.0 f1 (ppm) 0 .9 1 3 .0 3 2 .0 0 0 .9 7 4 .5 1 2 .2 3 2 .3 8 4 .1 4 4 .1 4 4 .1 5 4 .1 5 5 .5 2 7 .2 4 7 .2 7 7 .2 8 -10 0 10 20 30 40 50 60 70 80 90 100 110 120 130 140 150 160 170 180 190 200 210 f1 (ppm) 2 1 .1 9 2 9 .7 3 6 3 .9 9 7 1 .6 3 7 9 .6 0 1 2 2 .6 0 1 2 7 .9 9 1 3 0 .5 1 1 3 8 .2 6 1 6 4 .8 8 N2 O H N
Mix et al. Supporting Information 1H NMR spectrum of compound S5 in CDCl 3 (500 MHz): 13C NMR spectrum of compound S5 in CDCl 3 (125 MHz): -1.0 -0.5 0.0 0.5 1.0 1.5 2.0 2.5 3.0 3.5 4.0 4.5 5.0 5.5 6.0 6.5 7.0 7.5 8.0 8.5 9.0 9.5 10.0 10.5 11.0 11.5 f1 (ppm) 3 .0 5 4 .0 1 2 .0 0 2 .0 0 2 .3 5 2 .8 8 7 .2 2 7 .2 3 7 .3 1 7 .3 3 -10 0 10 20 30 40 50 60 70 80 90 100 110 120 130 140 150 160 170 180 190 200 210 f1 (ppm) 2 1 .0 8 2 5 .5 5 1 1 9 .8 3 1 2 4 .5 8 1 2 9 .9 4 1 3 7 .1 0 1 6 0 .4 5 1 6 9 .3 5 N2 O O N O O
Mix et al. Supporting Information –S28– 1H NMR spectrum of compound 5 in CDCl 3 (500 MHz): 13C NMR spectrum of compound 5 in CDCl 3 (125 MHz): -1.0 -0.5 0.0 0.5 1.0 1.5 2.0 2.5 3.0 3.5 4.0 4.5 5.0 5.5 6.0 6.5 7.0 7.5 8.0 8.5 9.0 9.5 10.0 10.5 11.0 11.5 12.0 f1 (ppm) 3 .0 5 4 .0 3 2 .0 4 3 .0 0 2 .0 0 0 .9 8 4 .4 2 0 .8 8 0 .8 9 0 .9 0 1 .2 8 1 .3 0 1 .3 0 1 .3 2 1 .3 3 1 .4 9 1 .5 1 1 .5 2 1 .5 3 2 .3 8 3 .3 2 3 .3 3 3 .3 4 3 .3 6 5 .3 7 7 .2 3 7 .2 4 7 .2 5 7 .2 6 -10 0 10 20 30 40 50 60 70 80 90 100 110 120 130 140 150 160 170 180 190 200 210 f1 (ppm) 1 3 .9 9 2 1 .1 6 2 2 .3 3 2 9 .0 4 2 9 .5 9 4 0 .2 5 6 3 .7 6 1 2 3 .3 1 1 2 7 .7 8 1 3 0 .4 2 1 3 7 .8 6 1 6 4 .8 5 N2 O H N