O
pen
A
rchive
T
OULOUSE
A
rchive
O
uverte (
OATAO
)
OATAO is an open access repository that collects the work of Toulouse researchers and
makes it freely available over the web where possible.
This is an author-deposited version published in :
http://oatao.univ-toulouse.fr/
Eprints ID : 8449
To cite this version :
Zened, Asma and Troegeler-Meynadier, Annabelle and Najar, Taha
and Enjalbert, Francis Effects of oil and natural or synthetic
vitamin E on ruminal and milk fatty acid profiles in cows receiving
a high-starch diet. (2012) Journal of Dairy Science, 95 (n°10). pp.
5916-5926. ISSN 0022-0302
Any correspondance concerning this service should be sent to the repository
administrator: [email protected].
5916
http://dx.doi.org/ 10.3168/jds.2012-5326
© American Dairy Science Association®, 2012 .
ABSTRACT
Among trans fatty acids, trans-10,cis-12 CLA has negative effects on cow milk fat production and can af-fect human health. In high-yielding dairy cows, a shift from the trans-11 to the trans-10 pathway of biohydro-genation (BH) can occur in the rumen of cows receiv-ing high-concentrate diets, especially when the diet is supplemented with unsaturated fat sources. In some but not all experiments, vitamin E has been shown to control this shift. To ascertain the effects of vitamin E on this shift of BH pathway, 2 studies were conducted. The first study explored in vitro the effects of addition of natural (RRR-α-tocopherol acetate) and synthetic (dl-α-tocopherol acetate) vitamin E. Compared with control and synthetic vitamin E, the natural form resulted in a greater trans-10/trans-11 ratio; however, the effect was very low, suggesting that vitamin E was neither a limiting factor for rumen BH nor a modulator of the BH pathway. An in vivo study investigated the effect of natural vitamin E (RRR-α-tocopherol) on this shift and subsequent milk fat depression. Six rumen-fistulated lactating Holstein cows were assigned to a 2 × 2 crossover design. Cows received 20-kg DM of a con-trol diet based on corn silage with 22% of wheat, and after 2 wk of adaptation, the diet was supplemented with 600 g of sunflower oil for 2 more weeks. During the last week of this 4-wk experimental period, cows were divided into 2 groups: an unsupplemented control group and a group receiving 11 g of RRR-α-tocopherol acetate per day. A trans-10 shift of ruminal BH associ-ated with milk fat depression due to oil supplementa-tion of a high-wheat diet was observed, but vitamin E supplementation of dairy cows did not result in a
reversal toward a trans-11 BH pathway, and did not restore milk fat content.
Key words: rumen biohydrogenation , trans-10 shift ,
milk fatty acid , vitamin E
INTRODUCTION
Due to partial and incomplete ruminal biohydroge-nation (BH) of unsaturated FA, ruminant products, especially milk, contain BH intermediates, mainly
trans FA including trans C18:1 and conjugated
lino-leic acids (CLA). A large number of positional and geometric isomers can be encountered. Among CLA,
trans-10,cis-12 CLA has been shown to decrease the
mammary synthesis of de novo FA and induces milk fat depression in dairy cows (Baumgard et al., 2000). Moreover, trans-10,cis-12 CLA has possible detrimental effects on human health (Ip et al., 2007). On the con-trary, cis-9,trans-11 CLA is most desirable because of its anticarcinogenic and other health-promoting properties (Kritchevsky, 2000). Decreasing the trans-10/trans-11 ratio is, therefore, desirable. In most dietary condi-tions, trans-11 isomers are much more abundant than
trans-10 isomers in milk fat. However, high-concentrate
diets can result in a shift of BH from the trans-11 to
trans-10 pathway, especially when based on corn silage
or associated with an enrichment of the diet with an unsaturated FA source (Piperova et al., 2002; Loor et al., 2004; Nielsen et al., 2006). After addition of an un-saturated FA source, the isomeric profile progressively but strongly evolves, trans-10 C18:1 reaching a plateau after 10 d, and trans-11 C18:1 reaching a peak after 6 d and then decreasing (Roy et al., 2006; Shingfield et al., 2006).
Because such a shift is not encountered with grass-based diets, Kay et al. (2005) hypothesized that vita-min E, which is abundant in pasture, could prevent it. However, as supplementing a TMR based on corn and grass silages with a large amount of synthetic vitamin E resulted in a trans-10 C18:1 proportion in milk fat
Effects of oil and natural or synthetic vitamin E on ruminal
and milk fatty acid profiles in cows receiving a high-starch diet
A. Zened ,*†‡ A. Troegeler-Meynadier ,*†‡ T. Najar ,§ and F. Enjalbert *†‡1
* INRA, UMR1289 Tissus Animaux Nutrition Digestion Ecosystème et Métabolisme, F-31326 Castanet-Tolosan, France
† Université de Toulouse, INPT ENSAT, UMR1289 Tissus Animaux Nutrition Digestion Ecosystème et Métabolisme, F-31326 Castanet-Tolosan, France
‡ Université de Toulouse, INPT ENVT, UMR1289 Tissus Animaux Nutrition Digestion Ecosystème et Métabolisme, F-31076 Toulouse, France § Institut National Agronomique de Tunis, T-1082 Tunis, Tunisia
Received January 6, 2012. Accepted April 29, 2012.
1
Journal of Dairy Science Vol. 95 No. 10, 2012 VITAMIN E AND RUMEN BIOHYDROGENATION 5917
that was much over that encountered in pasture-fed cows, they concluded that vitamin E is not the primary reason explaining that trans-10 FA are not produced with grass diets. Pottier et al. (2006) partly succeeded in preventing the low milk fat syndrome due to trans-10 FA in cows receiving linseed-supplemented diets by add-ing supranutritional amounts of synthetic vitamin E to the diet, but when this vitamin addition started 3 wk after beginning linseed supplementation, no effect could be observed, suggesting an interaction between vitamin E and disturbance over time of ruminal microbiota by fat. This 3-wk interval is often considered as allowing a complete adaptation of the ruminal microbiota to a new diet, and the effects of vitamin E on the trans-10 shift sooner after oil addition (i.e., when the trans-10/
trans-11 ratio strongly evolves; Roy et al., 2006) have
not been investigated.
Pottier et al. (2006) measured the effects of vita-min E after 21 d of supplementation, and discussed the changes due to vitamin E as probably resulting from effects on ruminal BH, but did not directly study BH. Moreover, they used synthetic vitamin E (dl-α-tocopherol). The activity of synthetic vitamin E is known to be lower than that of natural vitamin E (RRR-α-tocopherol) in animals (Dersjant-Li and Peisker, 2010), but the difference has not been studied in microbes, and lower activity could be overcome by a higher dose. As a consequence, the objectives of our study were, with a diet inducing a trans-10 shift, to investigate in vitro the differences of effects between natural and synthetic vitamins E, and to investigate in vivo the effects of natural vitamin E supplementation beginning 1 wk after fat supplementation on ruminal and milk FA profiles.
MATERIALS AND METHODS
In Vitro Experiment
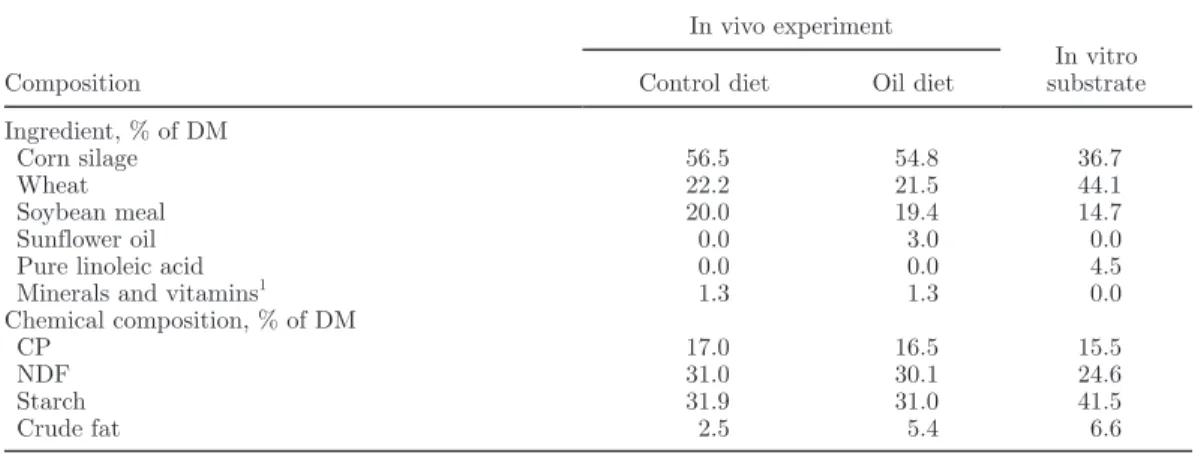
For the in vitro experiment, 2 ruminally fistulated lactating cows were used. They were adapted for 2 wk to the control diet described in Table 1. In vitro incuba-tions were conducted during 3 consecutive weeks, and lasted 52 h. One liter of rumen fluid was collected from each donor cow before the morning meal, and strained through a metal sieve (1.6-mm mesh). The rumen fluids were transported quickly (30 min) to the laboratory in anaerobic conditions at 39°C. In the laboratory, the pH of the rumen fluids was measured and the 2 rumen flu-ids were mixed. The incubation substrate (Table 1) was based on the same ingredients as the cow diet, ground through a 0.5-mm screen, and supplemented with pure linoleic acid (Sigma Co., St. Louis, MO).
Three series of incubations were performed during 3 successive weeks. On d 1 of each week, 40 mL of each rumen fluid and 40 mL of a bicarbonate buf-fer solution (19.5 g of Na2HPO4·12H2O/L, 9.24 g of NaHCO3/L, 0.705 g of NaCl/L, 0.675 g of KCl/L, 0.108 g of CaCl2·2H2O/L, and 0.180 g of MgSO4·7H2O/L) were placed into six 250-mL flasks containing 1.20 g of substrate, including 60 mg of pure linoleic acid. Two flasks were not supplemented with vitamin E, 2 flasks were supplemented with 30 mg of a 37% RRR-α-tocopherol acetate oil solution (Artimon Sarl, Plérin, France), and 2 flasks were supplemented with 24 mg of 50% dl-α-tocopherol acetate (DSM Nutritional Products France SAS, Courbevoie, France). The buffer solution was prewarmed to 39°C and saturated with CO2. Its pH was then lowered to 6.0 with hydrochloric Table 1. Ingredient and chemical composition of cow diets and in vitro incubation substrate
Composition
In vivo experiment
In vitro substrate Control diet Oil diet
Ingredient, % of DM
Corn silage 56.5 54.8 36.7
Wheat 22.2 21.5 44.1
Soybean meal 20.0 19.4 14.7
Sunflower oil 0.0 3.0 0.0
Pure linoleic acid 0.0 0.0 4.5
Minerals and vitamins1 1.3 1.3 0.0
Chemical composition, % of DM CP 17.0 16.5 15.5 NDF 31.0 30.1 24.6 Starch 31.9 31.0 41.5 Crude fat 2.5 5.4 6.6 1
Contained 4% P, 26% Ca, 5% Mg, 2% Na, 5 g of Zn/kg, 4 g of Mn/kg, 1 g of Cu/kg, 40 mg of I/kg, 20 mg of Co/kg, 450,000 IU of vitamin A/kg, 100,000 IU of vitamin D/kg, and 1,500 IU of vitamin E/kg.
acid (6 N) before being added to the 40 mL of rumen fluid. Next, the flasks were gassed with CO2 and closed with a rubber cap with a plastic tube immersed in wa-ter to vent fermentation gas without allowing oxygen entry. Incubations were carried out at 39°C in a water bath rotary shaker (Aquatron; Infors AG, Bottmingen, Switzerland). Flasks were stirred at 130 rpm and kept out of the light during incubation. After 24 and 48 h of incubation, flasks were opened and 30 mL of buffer solution and the same substrate as at d 1, including linoleic acid and vitamins, was added. Flasks were filled with CO2 before closing.
After 52 h of incubation, fermentations were stopped by placing the flasks into ice and the pH was measured. The contents of the flasks were immediately frozen at −20°C and freeze dried (Virtis Freezemobile 25; Virtis Co. Inc., Gardiner, NY), weighed, ground, and homogenized in a ball mill (Dangoumau; Prolabo SA, Nogent-sur-Marne, France), and then stored at −20°C until analysis.
In Vivo Experiment
For the in vivo experiment, 6 ruminally fistulated midlactation Holstein dairy cows were used in a 2 × 2 crossover design. Cows were housed in individual stalls. Each period lasted 4 wk and was divided into 2 subperiods: a 2-wk washout subperiod, followed by a 2-wk oil diet subperiod, with the supplementation of vitamin E beginning at d 8 of this oil diet subperiod. The washout was used to obtain a similar basal state of ruminal digestion before oil supplementation, allowing the study of FA profile kinetics without carryover effect of the diet used during the previous period.
During the washout subperiod, cows were allowed to consume 20-kg DM of a control diet based on corn silage (Table 1). During the 2-wk oil diet subperiod, cows received the control diet supplemented with 600 g of sunflower oil. The ingredients of the control diet were mixed before distribution, and oil was poured on the mixed ration. From d 8 of the oil diet subperiod, cows received daily either no supplemental vitamin E or 30 g of a 37% RRR-α-tocopherol acetate oil solution (Artimon Sarl). This dose was similar to that used by Pottier et al. (2006) and, assuming a 100-L rumen vol-ume, was in the same range as our in vitro dose. Diets and vitamin E supplement were distributed in 2 equal meals at 0900 and 1700 h and water was available ad libitum.
Milk yield was determined daily at each milking (0630 and 1730 h). Ruminal and milk samples were taken at morning and evening milkings on d 1, 3, 5,
7, 9, 11, and 13 of the second subperiod. One liter of ruminal content was taken 5 h after the morning meal, strained through a metal sieve (1.6-mm mesh), and the pH was measured. Two 8-mL aliquots were transferred into 10-mL vials containing 0.8 mL of 2% HgCl2 and were stored at −20°C until VFA analysis, and a 100-mL sample was kept at −20°C for FA analysis. Milk samples were taken from morning and evening milking and were composited based on milk yield.
Chemical Analysis
Milk fat and true protein contents were determined by infrared analysis (MilkoScan 605; Foss Electric, Paris, France). The FA of milk and rumen in vivo and in vitro samples were analyzed as detailed by Zened et al. (2011). Briefly, FA were extracted and methylated using a procedure adapted from Park and Goins (1994). Thereafter, they were analyzed by GC (Agilent 6890N, equipped with a model 7683 auto-injector, Network GC System; Agilent Technologies Inc., Palo Alto, CA) using a fused silica capillary col-umn (100 m × 0.25 mm i.d., 0.20-μm film thickness; CPSil88; Varian Inc., Middelburg, the Netherlands). Two temperature programs were used. The first tem-perature program started at 60°C for 2 min and the temperature then was increased by 8°C/min to 150°C, held at 150°C for 12 min, increased by 2°C/min to 175°C, held at 175°C for 20 min, increased by 5°C/ min to 225°C, held at 225°C for 10 min, and finally increased by 10°C/min to 240°C and maintained at 240°C for 10 min. The second temperature program, which improved the separation of trans-13+trans-14 C18:1 from cis-9 C18:1, started at 60°C for 3 min and the temperature was then increased by 8°C/min to 190°C, held at 190°C for 13 min, increased by 5°C/min to 225°C, held at 225°C for 10 min, increased by 10°C/ min to a final temperature of 230°C, and maintained at 230°C for 10 min.
Concentrations of VFA in the rumen were determined by the method of Playne (1985) using automated gas separation, modified as follows: the ruminal samples were first centrifuged at 4,000 × g for 20 min to separate the liquid phase. For protein removal, 1 mL of super-natant was mixed with 200 μL of 25% metaphosphoric acid and further centrifuged at 20,000 × g for 15 min. One milliliter of supernatant was added to 200 μL (1% vol/vol) of 4-methylvaleric acid as internal standard and 1 μL of the mixture was then injected into a gas chromatograph [model 5890 Series II, equipped with a flame ionization detector (FID); Hewlett-Packard Co., Avondale, PA].
Journal of Dairy Science Vol. 95 No. 10, 2012 VITAMIN E AND RUMEN BIOHYDROGENATION 5919
Calculations and Statistical Analysis
Sums of CLA, trans C18:1, and trans-10 and trans-11 isomers were calculated by adding the assayed isomers. Data from the in vitro experiment were analyzed using the following model:
Variable = mean + series effect + treatment effect + residual error,
where treatment levels were no vitamin, natural vita-min E, and synthetic vitavita-min E. When the treatment effect was significant, a Tukey test was used for pair-wise comparisons.
Data from the in vivo experiment collected from d 1 to d 7 (i.e., before vitamin E supplementation) were analyzed using a repeated measures procedure with SYSTAT (version 9; SPSS Inc., Chicago, IL), deter-mining linear, quadratic, and cubic effects of time and interaction of sampling day by vitamin E supplementa-tion (time × vitamin E). The model used was
Variable = mean + sampling day effect + cow effect + residual error.
Data from the in vivo experiment collected from d 7 to 13 (i.e., the last sampling day before the beginning of vitamin E supplementation and the samples
follow-ing vitamin E supplementation) were analyzed usfollow-ing a repeated measures procedure with the following model:
Variable = mean + sampling day effect + cow effect + vitamin E effect + residual error.
Effects were declared significant at P < 0.05.
RESULTS
In Vitro Experiment
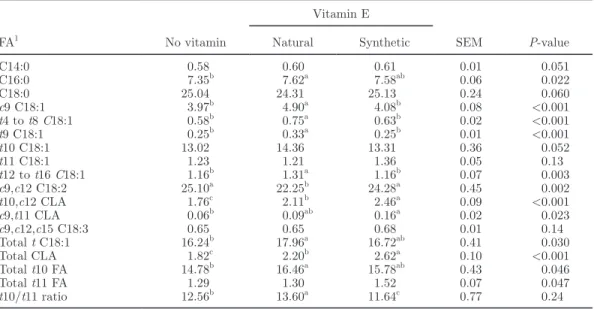
Compared with the control, natural vitamin E in-creased the percentages of C16:0, cis-9 C18:1, total
trans C18:1, and some minor individual trans C18:1,
total CLA, and trans-10,cis-12 CLA, but decreased the percentages of cis-9,cis-12 C18:2 (Table 2). Compared with the control, synthetic vitamin E increased both
trans-10,cis-12 CLA and cis-9,trans-11 CLA. Compared
with natural vitamin E, synthetic vitamin E resulted in lower cis-9 C18:1 and higher cis-9,cis-12 C18:2 and CLA proportions.
In Vivo Experiment
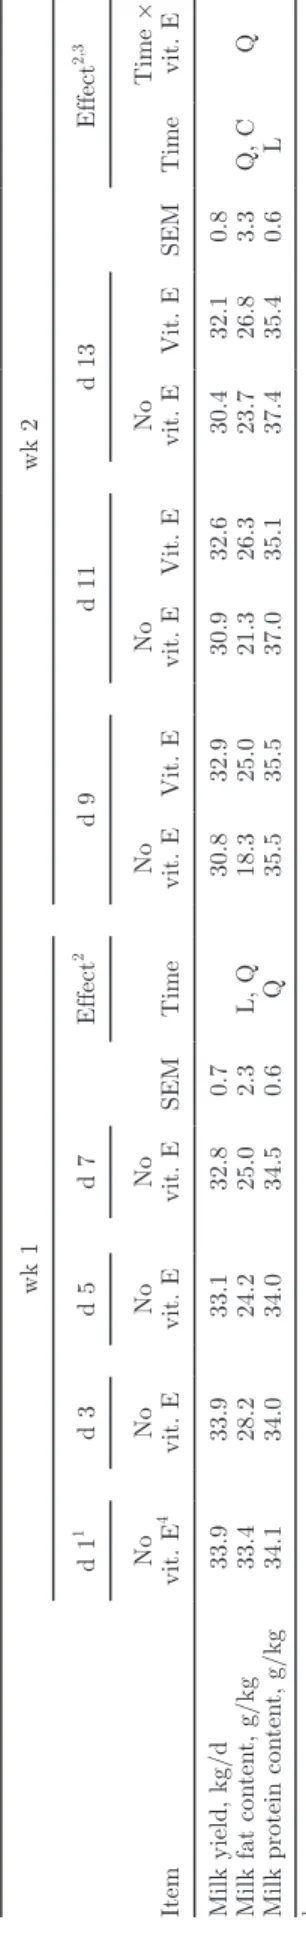
During the first week of the oil diet subperiod, milk yield was not affected over time (Table 3), but milk fat content decreased from 33.4 to 25.0 g/kg. Milk protein content varied quadratically but within a narrow range. Table 2. In vitro experiment: effects of natural or synthetic vitamin E on rumen FA profile (% of total FA
methyl esters) FA1 No vitamin Vitamin E SEM P-value Natural Synthetic C14:0 0.58 0.60 0.61 0.01 0.051 C16:0 7.35b 7.62a 7.58ab 0.06 0.022 C18:0 25.04 24.31 25.13 0.24 0.060 c9 C18:1 3.97b 4.90a 4.08b 0.08 <0.001 t4 to t8 C18:1 0.58b 0.75a 0.63b 0.02 <0.001 t9 C18:1 0.25b 0.33a 0.25b 0.01 <0.001 t10 C18:1 13.02 14.36 13.31 0.36 0.052 t11 C18:1 1.23 1.21 1.36 0.05 0.13 t12 to t16 C18:1 1.16b 1.31a 1.16b 0.07 0.003 c9,c12 C18:2 25.10a 22.25b 24.28a 0.45 0.002 t10,c12 CLA 1.76c 2.11b 2.46a 0.09 <0.001 c9,t11 CLA 0.06b 0.09ab 0.16a 0.02 0.023 c9,c12,c15 C18:3 0.65 0.65 0.68 0.01 0.14 Total t C18:1 16.24b 17.96a 16.72ab 0.41 0.030 Total CLA 1.82c 2.20b 2.62a 0.10 <0.001 Total t10 FA 14.78b 16.46a 15.78ab 0.43 0.046 Total t11 FA 1.29 1.30 1.52 0.07 0.047 t10/t11 ratio 12.56b 13.60a 11.64c 0.77 0.24
a–cMeans within a row with different superscripts differ (P < 0.05). 1c = cis; t = trans.
During the second week of the oil diet subperiod, milk yield was not affected by time and no time × vitamin E interaction was detected. Milk fat content increased with quadratic and cubic components, and a quadratic time × vitamin E interaction was linked to a decrease in milk fat content at d 9 in cows that did not receive supplemental vitamin E. Milk protein content slightly increased over time and no time × vitamin E interac-tion was observed.
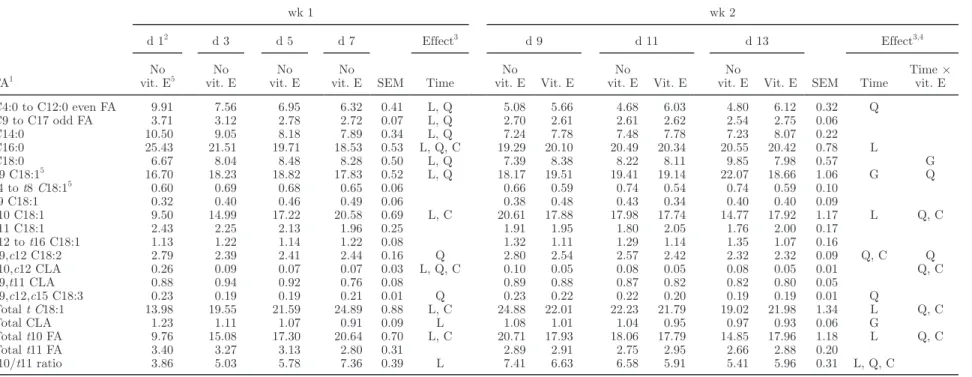
During wk 1 of the oil diet subperiod, the propor-tions of FA containing less than 18 carbons decreased in milk fat (Table 4). For C18 FA, the C18:0 propor-tion slightly increased and the proporpropor-tion of cis-9,cis-12 C18:2, which is the main FA of sunflower oil, quadrati-cally decreased over time, as did the proportion of total CLA, mainly due to a decrease in trans-10,cis-12 CLA. On the contrary, the proportion of total trans C18:1 FA increased over time, due to a more than 2-fold increase in trans-10 C18:1.
During wk 2 of the oil diet subperiod, time effects on FA with less than 18 carbons were much more lim-ited: decreases in proportions were in a narrower range than during wk 1, and were not observed for C14:0 and C16:0. On the contrary, the proportion of this latter FA increased over time, but remained far lower than that observed at the beginning of the oil diet subperiod. Quadratic time × vitamin E interaction for even-chain saturated C4:0 to C12:0 FA reflected values that in-creased over time with vitamin E supplementation and were almost steady in the unsupplemented cows. The proportion of cis-9,cis-12 C18:2 was fairly constant with vitamin E addition and followed a quadratic pattern, with a maximal value at d 9 in unsupplemented cows. Total CLA were not affected by time or time × vitamin E interaction, but the proportion of trans-10,cis-12 CLA was affected by a time × vitamin E interaction, resulting in a 40% lower proportion in supplemented than in unsupplemented cows from d 9. Trans-10 C18:1 was also affected by a time × vitamin E interaction, but average values during the supplementation period were similar in supplemented and unsupplemented cows. During this second week, C18:0 proportion was not affected over time. The time × vitamin E interac-tion had a significant effect with a trend (P = 0.064) toward a quadratic effect.
In the rumen, pH and VFA concentrations were not affected by time during the 2 wk of oil supplementation, and were not affected by time × vitamin E interaction (Table 5). The proportions of acetate and isovalerate decreased during wk 1 and increased during wk 2, inde-pendently of vitamin E supplementation, whereas the proportion of valerate followed an opposite pattern.
The ruminal proportions of FA with less than 18 car-bons were only slightly affected by time (Table 6): even-
T
able 3.
In viv
o exp
erimen
t: effects of time from the b
eginning of oil incorp
oration to the diet and vitamin E supplemen
tation on milk
yield and comp
osition Item wk 1 wk 2 d 1 1 d 3 d 5 d 7 SEM Effect 2 d 9 d 11 d 13 SEM Effect 2,3 No vit. E 4 No vit. E No vit. E No vit. E Time No vit. E Vit. E No vit. E Vit. E No vit. E Vit. E Time Time × vit. E Milk yield, kg/d 33.9 33.9 33.1 32.8 0.7 30.8 32.9 30.9 32.6 30.4 32.1 0.8
Milk fat con
ten t, g/kg 33.4 28.2 24.2 25.0 2.3 L, Q 18.3 25.0 21.3 26.3 23.7 26.8 3.3 Q, C Q
Milk protein con
ten t, g/kg 34.1 34.0 34.0 34.5 0.6 Q 35.5 35.5 37.0 35.1 37.4 35.4 0.6 L 1First da y = switc h from con
trol to oil diet.
2 L = linear effect; Q = quadratic effect; C = cubic effect. 3Rep
eated measures analysis from d 7 to 13; no significan
t effect of vitamin E w
as observ
ed.
4 No vitamin (vit.) E addition. Vitamin E w
as added from d 8 (30 g of 37% RRR-α-to
Journal of Dairy Science V
ol. 95 No. 10, 2012
VIT
AMIN E
AND RUMEN BIOHYDROGENA
TION
5921
Table 4. In vivo experiment: effects of time from the beginning of oil incorporation to the diet and vitamin E supplementation on milk FA profile (% of total FA methyl esters)
FA1 wk 1 wk 2 d 12 d 3 d 5 d 7 SEM Effect3 d 9 d 11 d 13 SEM Effect3,4 No vit. E5 No vit. E No vit. E No vit. E Time No vit. E Vit. E No vit. E Vit. E No
vit. E Vit. E Time
Time × vit. E C4:0 to C12:0 even FA 9.91 7.56 6.95 6.32 0.41 L, Q 5.08 5.66 4.68 6.03 4.80 6.12 0.32 Q C9 to C17 odd FA 3.71 3.12 2.78 2.72 0.07 L, Q 2.70 2.61 2.61 2.62 2.54 2.75 0.06 C14:0 10.50 9.05 8.18 7.89 0.34 L, Q 7.24 7.78 7.48 7.78 7.23 8.07 0.22 C16:0 25.43 21.51 19.71 18.53 0.53 L, Q, C 19.29 20.10 20.49 20.34 20.55 20.42 0.78 L C18:0 6.67 8.04 8.48 8.28 0.50 L, Q 7.39 8.38 8.22 8.11 9.85 7.98 0.57 G c9 C18:15 16.70 18.23 18.82 17.83 0.52 L, Q 18.17 19.51 19.41 19.14 22.07 18.66 1.06 G Q t4 to t8 C18:15 0.60 0.69 0.68 0.65 0.06 0.66 0.59 0.74 0.54 0.74 0.59 0.10 t9 C18:1 0.32 0.40 0.46 0.49 0.06 0.38 0.48 0.43 0.34 0.40 0.40 0.09 t10 C18:1 9.50 14.99 17.22 20.58 0.69 L, C 20.61 17.88 17.98 17.74 14.77 17.92 1.17 L Q, C t11 C18:1 2.43 2.25 2.13 1.96 0.25 1.91 1.95 1.80 2.05 1.76 2.00 0.17 t12 to t16 C18:1 1.13 1.22 1.14 1.22 0.08 1.32 1.11 1.29 1.14 1.35 1.07 0.16 c9,c12 C18:2 2.79 2.39 2.41 2.44 0.16 Q 2.80 2.54 2.57 2.42 2.32 2.32 0.09 Q, C Q t10,c12 CLA 0.26 0.09 0.07 0.07 0.03 L, Q, C 0.10 0.05 0.08 0.05 0.08 0.05 0.01 Q, C c9,t11 CLA 0.88 0.94 0.92 0.76 0.08 0.89 0.88 0.87 0.82 0.82 0.80 0.05 c9,c12,c15 C18:3 0.23 0.19 0.19 0.21 0.01 Q 0.23 0.22 0.22 0.20 0.19 0.19 0.01 Q Total t C18:1 13.98 19.55 21.59 24.89 0.88 L, C 24.88 22.01 22.23 21.79 19.02 21.98 1.34 L Q, C Total CLA 1.23 1.11 1.07 0.91 0.09 L 1.08 1.01 1.04 0.95 0.97 0.93 0.06 G Total t10 FA 9.76 15.08 17.30 20.64 0.70 L, C 20.71 17.93 18.06 17.79 14.85 17.96 1.18 L Q, C Total t11 FA 3.40 3.27 3.13 2.80 0.31 2.89 2.91 2.75 2.95 2.66 2.88 0.20 t10/t11 ratio 3.86 5.03 5.78 7.36 0.39 L 7.41 6.63 6.58 5.91 5.41 5.96 0.31 L, Q, C 1c = cis; t = trans.
2First day = switch from control to oil diet.
3
G = global effect without significance of linear; quadratic and cubic effects; L = linear effect; Q = quadratic effect; C = cubic effect.
4Repeated measures analysis from d 7 to 13; the effect of vitamin E was significant only for the trans10/trans11 ratio.
5
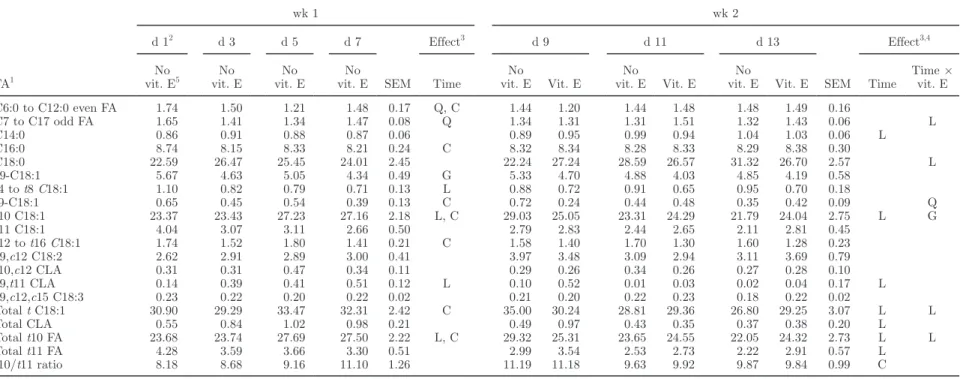
and odd-chain FA with less than 18 carbons decreased at the beginning of the first week and then remained stable. During the second week, C14:0 increased over time, and vitamin E supplementation resulted in an increase of odd-chain FA over time. The proportions of
cis-9 C18:1, cis-9,cis-12 C18:2, and cis-9,cis-12,cis-15
C18:3 in the rumen content were not affected by time or time × vitamin interaction. Total CLA decreased during wk 2, but with high variability. Among CLA isomers, trans-10,cis-12 CLA remained fairly constant over time and did not depend on vitamin E supplemen-tation, and cis-9,trans-11 CLA strongly increased from 0.14 to 0.51% of total FA during wk 1, and decreased to 0.03% during wk 2, independently of vitamin E supplementation. Trans-10 C18:1 was the major trans isomer and increased during wk 1 and decreased during wk 2. A time × vitamin E interaction with a trend toward a linear effect (P = 0.057) was observed during wk 2, the proportions of trans-10 C18:1 being fairly constant in vitamin-supplemented cows, but decreasing in unsupplemented cows. The proportion of C18:0 also was stable at around 27% during wk 2 in vitamin-sup-plemented cows, but increased from 22 to 31% between d 9 and 13 in unsupplemented cows.
DISCUSSION
Effects of Oil Addition
Our dietary management resulted in a very rapid and important trans-10 shift, as ruminal proportions of trans-10,cis-12 CLA and trans-10 C18:1 were 2.2 and 5.8 times greater than those of cis-9,trans-11 CLA and trans-11 C18:1, respectively, as early as d 1 of the oil diet subperiod. The trans-10/trans-11 ratio reached around 10 in the rumen and 6 in milk from d 3. Our trans-10,cis 12-CLA proportions were very high compared with the literature data. In a recent meta-analysis, Glasser et al. (2008) reported that this isomer ranged from 0.0 to 6.6% of total duodenal C18:2 in their data set, whereas it represented 6.1 to 12.5% of total ruminal C18:2 in our experiment. Our kinetics data of milk FA also contrast from those of Roy et al. (2006) who, using a 72% concentrate diet based on corn silage and adding sunflower oil, observed trans-10/
trans-11 ratios around 0.6 before oil supplementation
and during wk 1 of the oil diet subperiod, and around 5 after 10 d of oil feeding. The difference between stud-ies could be due to the nature of concentrate: we used wheat, a highly fermentable starch, whereas Roy et al. (2006) used corn grain, a slowly fermentable starch. Accordingly, Jurjanz et al. (2004) observed higher milk
trans-10 FA content when cows received wheat than
when they received potatoes (another slowly
ferment-T
able 5.
In viv
o exp
erimen
t: effects of time from the b
eginning of oil incorp
oration to the diet and vitamin E supplemen
tation on rumen fermen tation parameters Item wk 1 wk 2 d 1 1 d 3 d 5 d 7 SEM Effect 2 d 9 d 11 d 13 SEM Effect 2,3 No vit. E 4 No vit. E No vit. E No vit. E Time No vit. E Vit. E No vit. E Vit. E No vit. E Vit. E Time pH 5.79 5.85 5.66 5.82 0.11 5.72 5.77 5.79 5.76 5.77 5.74 0.11 T otal VF A, m M 116 107 118 116 6 117 108 115 95 102 99 7 Individual VF A, % of total VF A Acetate 52.9 51.9 50.1 48.5 1.4 L 48.3 48.9 47.6 50.3 55.4 54.2 1.6 L Propionate 32.0 33.5 34.9 34.0 1.8 33.3 34.0 36.7 32.1 28.2 29.4 2.1 Isobut yrate 0.69 0.64 0.62 0.65 0.05 0.64 0.63 0.70 0.84 1.18 1.00 0.09 L But yrate 9.54 8.92 9.38 10.82 0.65 Q 12.10 10.59 9.59 11.27 10.58 10.63 0.72 Iso v alerate 1.38 1.36 1.22 1.30 0.17 L 1.27 1.14 1.24 1.27 1.99 1.68 0.17 Q V alerate 3.41 3.65 3.80 4.72 0.31 L 4.43 4.70 4.12 4.20 2.60 3.10 0.42 L, Q 1First da y = switc h from con
trol to oil diet.
2 L = linear effect; Q = quadratic effect; C = cubic effect. 3Rep
eated measures analysis from d 7 to 13; no significan
t effects of vitamin E or time × vitamin E in
teraction w
ere observ
ed.
4 No vitamin (vit.) E addition. Vitamin E w
as added from d 8 (30 g of 37% RRR-α-to
Journal of Dairy Science V
ol. 95 No. 10, 2012
VIT
AMIN E
AND RUMEN BIOHYDROGENA
TION
5923
Table 6. In vivo experiment: effects of time from the beginning of oil incorporation to the diet and vitamin E supplementation on rumen FA profile (% of total FA methyl esters)
FA1 wk 1 wk 2 d 12 d 3 d 5 d 7 SEM Effect3 d 9 d 11 d 13 SEM Effect3,4 No vit. E5 No vit. E No vit. E No vit. E Time No vit. E Vit. E No vit. E Vit. E No
vit. E Vit. E Time
Time × vit. E C6:0 to C12:0 even FA 1.74 1.50 1.21 1.48 0.17 Q, C 1.44 1.20 1.44 1.48 1.48 1.49 0.16 C7 to C17 odd FA 1.65 1.41 1.34 1.47 0.08 Q 1.34 1.31 1.31 1.51 1.32 1.43 0.06 L C14:0 0.86 0.91 0.88 0.87 0.06 0.89 0.95 0.99 0.94 1.04 1.03 0.06 L C16:0 8.74 8.15 8.33 8.21 0.24 C 8.32 8.34 8.28 8.33 8.29 8.38 0.30 C18:0 22.59 26.47 25.45 24.01 2.45 22.24 27.24 28.59 26.57 31.32 26.70 2.57 L c9-C18:1 5.67 4.63 5.05 4.34 0.49 G 5.33 4.70 4.88 4.03 4.85 4.19 0.58 t4 to t8 C18:1 1.10 0.82 0.79 0.71 0.13 L 0.88 0.72 0.91 0.65 0.95 0.70 0.18 t9-C18:1 0.65 0.45 0.54 0.39 0.13 C 0.72 0.24 0.44 0.48 0.35 0.42 0.09 Q t10 C18:1 23.37 23.43 27.23 27.16 2.18 L, C 29.03 25.05 23.31 24.29 21.79 24.04 2.75 L G t11 C18:1 4.04 3.07 3.11 2.66 0.50 2.79 2.83 2.44 2.65 2.11 2.81 0.45 t12 to t16 C18:1 1.74 1.52 1.80 1.41 0.21 C 1.58 1.40 1.70 1.30 1.60 1.28 0.23 c9,c12 C18:2 2.62 2.91 2.89 3.00 0.41 3.97 3.48 3.09 2.94 3.11 3.69 0.79 t10,c12 CLA 0.31 0.31 0.47 0.34 0.11 0.29 0.26 0.34 0.26 0.27 0.28 0.10 c9,t11 CLA 0.14 0.39 0.41 0.51 0.12 L 0.10 0.52 0.01 0.03 0.02 0.04 0.17 L c9,c12,c15 C18:3 0.23 0.22 0.20 0.22 0.02 0.21 0.20 0.22 0.23 0.18 0.22 0.02 Total t C18:1 30.90 29.29 33.47 32.31 2.42 C 35.00 30.24 28.81 29.36 26.80 29.25 3.07 L L Total CLA 0.55 0.84 1.02 0.98 0.21 0.49 0.97 0.43 0.35 0.37 0.38 0.20 L Total t10 FA 23.68 23.74 27.69 27.50 2.22 L, C 29.32 25.31 23.65 24.55 22.05 24.32 2.73 L L Total t11 FA 4.28 3.59 3.66 3.30 0.51 2.99 3.54 2.53 2.73 2.22 2.91 0.57 L t10/t11 ratio 8.18 8.68 9.16 11.10 1.26 11.19 11.18 9.63 9.92 9.87 9.84 0.99 C 1c = cis; t = trans.
2First day = switch from control to oil diet.
3
G = global effect without significance of linear, quadratic, and cubic effects; L = linear effect; Q = quadratic effect; C = cubic effect.
4Repeated measures analysis from d 7 to 13; no significant effect of vitamin E was observed.
5
able starch). Indeed, the quick ruminal degradation of wheat starch both leads to a large amount of starch degraded in the rumen and a big pH decrease after meals, compared with corn or potato starches. This can explain that corn or potatoes result in a lower trans-10/
trans-11 ratio than wheat, as both decreasing dietary
starch (Kucuk et al., 2001) and adding ruminal buffers to the diet (Troegeler-Meynadier et al., 2007) decrease
trans-10 FA in the rumen.
Milk fat content linearly and quadratically decreased during wk 1 of the oil diet subperiod, which is in line with present knowledge regarding the relationship between trans-10,cis-12 CLA and milk fat content (Baumgard et al., 2000). Nevertheless, in spite of high values of trans-10,cis-12 CLA in milk and rumen at d 1, milk fat content decrease was delayed. This is in agreement with the study of Perfield et al. (2004): using ruminal protected CLA, these authors observed a pro-gressive decrease of milk fat content that became stable after 4 d of supplementation, but they published the FA composition of milk after 6 and 7 d of supplementa-tion, preventing any kinetics approach of the relation-ship between milk trans-10,cis-12 CLA and milk fat content. In our experiment, at d 1, milk trans-10,cis-12 CLA exhibited a very high value compared with sub-sequent days, whereas rumen trans-10,cis-12 CLA was similar to values observed during the following days. This decrease in trans-10,cis-12 CLA in milk in spite of a constant ruminal proportion could suggest an evolu-tion of the transfer of this FA from the digestive tract to milk fat. Consistent with our much lower proportion of trans-10,cis-12 CLA in milk fat than in the rumen from d 3, Chouinard et al. (1999) already demonstrated a low transfer of trans-10,cis-12 CLA from the diges-tive tract to milk, but their measures were performed after 5 d of abomasal infusion, which does not preclude a time evolution at the beginning of infusions. Such a decrease over time of trans-10,cis-12 CLA transfer from the digestive tract to milk could be explained by an effect of this isomer on milk transfer of FA with more than 16 carbons, as enzymes implicated in their mammary uptake are inhibited by trans-10,cis-12 CLA (Peterson et al., 2003). As for milk fat depression, re-duction of FA uptake could have been delayed in the present study, underlying a time-dependent adaptation of mammary metabolism to a high ruminal production of trans-10,cis-12 CLA.
Beside this rapid change of trans FA, time effects were observed on other milk FA. The percentages of short- and medium-chain FA decreased during wk 1 of the oil diet subperiod, which is consistent with the literature relative to the effects of fat supplementation (Glasser et al., 2007). Some odd- and branched-chain VFA and FA in the rumen and milk fat also decreased
during wk 1, which suggests modifications of microbial populations (Vlaeminck et al., 2006).
Effects of Vitamin E Addition
In vitro, both vitamin E forms increased the propor-tions of cis-9,trans-11 and trans-10,cis-12 CLA, syn-thetic vitamin E resulting in larger increases than the natural form, but in a higher proportion of cis-9,cis-12 C18:2 than the natural vitamin E, which suggests that the differences in CLA percentages were not due to differences in isomerization efficiency. Similarly, the proportion of total trans-10 C18:1 was increased by natural vitamin E, but, whereas statistically significant, the change was within a narrow range. Although not completely similar, the effects of natural and synthetic vitamin E were very limited, suggesting that vitamin E was neither a limiting factor for rumen BH nor a modulator of BH pathway.
Vitamin E supplementation did not affect fermen-tation parameters in vivo, which contrasts with the results of Naziro÷lu et al. (2002), who observed in vitro that vitamin E addition increased the concentrations of acetate and propionate, but decreased that of bu-tyrate. Hino et al. (1993) demonstrated that vitamin E addition partly alleviates the depression of growth and fibrolytic activity of rumen bacteria in incubates supplemented with safflower oil. Such an effect could be expected to affect rumen VFA production. In our experiment, we only measured rumen VFA concentra-tions. They were not clearly depressed by oil addition, which could explain the lack of effect of vitamin E.
As a whole, effects of vitamin E on FA profiles were limited. Vitamin E did not affect the rumen proportions of unsaturated dietary FA and most BH intermediates, which is consistent with the results of Chikunya et al. (2004), who demonstrated that vitamin E supplemen-tation of the sheep diet did not affect the efficiency of rumen BH and the proportion of trans C18:1 among FA. Some time × vitamin E interactions slightly af-fected FA profiles: during wk 2 of the oil diet subperiod in the in vivo experiment, vitamin E addition resulted in fairly steady percentages of rumen and milk C18:0, total trans C18:1 and trans-10 C18:1, whereas with-out vitamin E supplementation, the C18:0 percentage increased and the trans C18:1 percentage decreased over time. These different patterns could suggest that vitamin E resulted in a more rapid adaptation of the reduction of trans C18:1 FA to C18:0 with a high-oil diet. The implication of vitamin E in the reduction of
trans C18:1 to C18:0 has not been studied, contrary to
the known implication of vitamin E in the reduction of CLA to trans C18:1 (Hughes et al., 1982). In this latter reaction, α-tocopherolquinol acts as an electron donor
Journal of Dairy Science Vol. 95 No. 10, 2012 VITAMIN E AND RUMEN BIOHYDROGENATION 5925
during the reduction, but, as far as we are aware, no quantitative recommendation of vitamin E supply for cows related to this function has been proposed. In our study, vitamin E supplementation did not affect the ratio of trans C18:1 to CLA, which could be due to the 300 mg of vitamin E supplied by the standard com-mercial premix to all cows being sufficient to sustain this reduction. The more stable proportion of trans-10 C18:1 observed in milk fat in vitamin E-supplemented cows was due to a decrease in this proportion at d 9 (i.e., 1 d after the beginning of vitamin E supplementa-tion). However, the same decrease was observed in the rumen at d 7 in cows that began to receive vitamin E at d 8 (results not shown), which makes a true rela-tionship between vitamin E supplementation and this stabilization questionable.
The trans-10,cis-12 CLA proportion was lowered by vitamin E supplementation in milk fat, but not in rumen content. This suggests that vitamin E could have modified the transfer efficiency of trans10,cis12 CLA isomer from the rumen to the mammary gland, which could create discrepancies between digestive and metabolic effects of vitamin E. Previous experiments regarding the effects of vitamin E on the trans-10 shift of BH only addressed FA composition of tissues or milk and milk fat content, and also showed limited effects of vitamin E supplementation. In steers receiving high-grain diets, Juárez et al. (2010) observed a reduction in the trans-10/trans-11 ratio in the backfat when steers fed a high-barley diet received supplemental vitamin E, but the same authors observed no effect of vitamin E on trans-10 C18:1 in intramuscular fat when steers re-ceived flax as a source of PUFA (Juárez et al., 2011). In dairy cows, vitamin E supplementation resulted in an increase in trans-10 FA (Bell et al., 2006) or no effect (Ferlay et al., 2010), but with a trans-10/trans-11 ratio that was far under 1, which strongly differs from our experimental conditions. In dairy cows, Pottier et al. (2006) observed a decrease in this ratio when vitamin E was supplemented from the beginning of linseed oil ad-dition, but did not observe this effect when vitamin E was provided 3 wk after oil supplementation. Similarly, in our experiment, vitamin E was supplemented after the trans-10 shift, so our lack of effects is in line with the results of Pottier et al. (2006).
CONCLUSIONS
Vitamin E supplementation of dairy cows exhibiting a trans-10 shift of ruminal BH due to addition of oil supplementation to a high wheat diet did not result in a reversal of BH pathway toward trans-11 isomers production, which precluded any conclusion regarding differential effects of natural and synthetic vitamin E.
ACKNOWLEDGMENTS
The authors thank Y. Farizon, L. Reymond, and the staff at the experimental station (all of UMR 1289 Tandem, Castanet-Tolosan, France).
REFERENCES
Baumgard, L. H., B. A. Corl, D. A. Dwyer, A. Saebø, and D. E. Bau-man. 2000. Identification of the conjugated linoleic acid isomer that inhibits milk fat synthesis. Am. J. Physiol. Regul. Integr. Comp. Physiol. 278:R179–R184.
Bell, J. A., J. M. Griinari, and J. J. Kennelly. 2006. Effect of safflower oil, flaxseed oil, monensin, and vitamin E on concentration of con-jugated linoleic acid in bovine milk fat. J. Dairy Sci. 89:733–748. Chikunya, S., G. Demirel, M. Enser, J. D. Wood, R. G. Wilkinson, and
L. A. Sinclair. 2004. Biohydrogenation of dietary n-3 PUFA and stability of ingested vitamin E in the rumen, and their effects on microbial activity in sheep. Br. J. Nutr. 91:539–550.
Chouinard, P. Y., L. Corneau, D. M. Barbano, L. E. Metzger, and D. E. Bauman. 1999. Conjugated linoleic acids alter milk fatty acid composition and inhibit milk fat secretion in dairy cows. J. Nutr. 129:1579–1584.
Dersjant-Li, Y., and M. Peisker. 2010. Utilization of stereoisomers from alpha-tocopherol in livestock animals. J. Anim. Physiol. Anim. Nutr. (Berl.) 94:413–421.
Ferlay, A., B. Martin, S. Lerch, M. Gobert, P. Pradel, and Y. Chilliard. 2010. Effects of supplementation of maize silage diets with extrud-ed linseextrud-ed, vitamin E and plant extracts rich in polyphenols, and morning v. evening milking on milk fatty acid profiles in Holstein and Montbéliarde cows. Animal 4:627–640.
Glasser, F., M. Doreau, A. Ferlay, J. J. Loor, and Y. Chilliard. 2007. Milk fatty acids: Mammary synthesis could limit transfer from duodenum in cows. Eur. J. Lipid Sci. Technol. 109:817–827. Glasser, F., P. Schmidely, D. Sauvant, and M. Doreau. 2008. Digestion
of fatty acids in ruminants: A meta-analysis of flows and variation factors: 2. C18 fatty acids. Animal 2:691–704.
Hino, T., N. Andoh, and H. Ohgi. 1993. Effects of β-carotene and α-tocopherol on rumen bacteria in the utilization of long-chain fatty acids and cellulose. J. Dairy Sci. 76:600–605.
Hughes, P. E., W. J. Hunter, and S. B. Tove. 1982. Biohydrogenation of unsaturated fatty acids. Purification and properties of cis-9,trans-11-octadecadienoate reductase. J. Biol. Chem. 257:3643–3649. Ip, M. M., S. O. McGee, P. A. Masso-Welch, C. Ip, X. Meng, L. Ou,
and S. F. Shoemaker. 2007. The t10,c12 isomer of conjugated lin-oleic acid stimulates mammary tumorigenesis in transgenic mice over-expressing erbB2 in the mammary epithelium. Carcinogen-esis 28:1269–1276.
Juárez, M., M. E. R. Dugan, J. L. Aalhus, N. Aldai, J. A. Basarab, V. S. Baron, and T. A. McAllister. 2010. Dietary vitamin E inhibits the trans 10-18:1 shift in beef backfat. Can. J. Anim. Sci. 90:9–12. Juárez, M., M. E. R. Dugan, J. L. Aalhus, N. Aldai, J. A. Basarab,
V. S. Baron, and T. A. McAllister. 2011. Effects of vitamin E and flaxseed on rumen-derived fatty acid intermediates in beef intra-muscular fat. Meat Sci. 88:434–440.
Jurjanz, S., V. Monteils, P. Juaneda, and F. Laurent. 2004. Variations of trans octadecenoic acid in milk fat induced by feeding different starch-based diets to cows. Lipids 39:19–24.
Kay, J. K., J. R. Roche, E. S. Kolver, N. A. Thomson, and L. H. Baum-gard. 2005. A comparison between feeding systems (pasture and TMR) and the effect of vitamin E supplementation on plasma and milk fatty acid profiles in dairy cows. J. Dairy Res. 72:322–332. Kritchevsky, D. 2000. Antimutagenic and some other effects of
conju-gated linoleic acid. Br. J. Nutr. 83:459–465.
Kucuk, O., B. W. Hess, P. A. Ludden, and D. C. Rule. 2001. Effect of forage:concentrate ratio on ruminal digestion and duodenal flow of fatty acids in ewes. J. Anim. Sci. 79:2233–2240.
Loor, J. J., K. Ueda, A. Ferlay, Y. Chilliard, and M. Doreau. 2004. Biohydrogenation, duodenal flow, and intestinal digestibility of
trans-fatty acids and conjugated linoleic acids in response to
di-etary forage:concentrate ratio and linseed oil in dairy cows. J. Dairy Sci. 87:2472–2485.
Naziro÷lu, M., T. Güler, and A. Yüce. 2002. Effect of vitamin E on ruminal fermentation in vitro. J. Vet. Med. A Physiol. Pathol. Clin. Med. 49:251–255.
Nielsen, T. S., E. M. Straarup, M. Vestergaard, and K. Sejrsen. 2006. Effect of silage type and concentrate level on conjugated linoleic acids, trans-C18:1 isomers and fat content in milk from dairy cows. Reprod. Nutr. Dev. 46:699–712.
Park, P. W., and R. E. Goins. 1994. In situ preparation of fatty acid methyl esters for analysis of fatty acid composition in foods. J. Food Sci. 59:1262–1266.
Perfield, J. W. II, A. L. Lock, A. M. Pfeiffer, and D. E. Bauman. 2004. Effects of amide-protected and lipid-encapsulated conjugated lin-oleic acid (CLA) supplements on milk fat synthesis. J. Dairy Sci. 87:3010–3016.
Peterson, D. G., E. A. Matitashvili, and D. E. Bauman. 2003. Diet-in-duced milk fat depression in dairy cows results in increased trans-10,cis-12 CLA in milk fat and coordinate suppression of mRNA abundance for mammary enzymes involved in milk fat synthesis. J. Nutr. 133:3098–3102.
Piperova, L. S., L. Sampugna, B. B. Teter, K. F. Kalscheur, M. P. Yurawecz, Y. Ku, K. M. Morehouse, and R. A. Erdman. 2002. Duodenal and milk trans octadecenoic acid and conjugated lin-oleic acid (CLA) isomers indicate that postabsorptive synthesis is the predominant source of cis-9-containing CLA in lactating dairy cows. J. Nutr. 132:1235–1241.
Playne, M. J. 1985. Determination of ethanol, volatile fatty acids, lactic acid and succinic acid in fermentation liquids by gas chro-matography. J. Sci. Food Agric. 36:638–644.
Pottier, J., M. Focant, C. Debier, G. De Buysser, C. Goffe, E. Mi-gnolet, E. Froidmont, and Y. Larondelle. 2006. Effect of dietary vitamin E on rumen biohydrogenation pathways and milk fat de-pression in dairy cows fed high-fat diets. J. Dairy Sci. 89:685–692. Roy, A., A. Ferlay, K. J. Shingfield, and Y. Chilliard. 2006. Examina-tion of the persistency of milk fatty acid composiExamina-tion responses to plant oils in cows given different basal diets, with particular em-phasis on trans-C18:1 fatty acids and isomers of conjugated linoleic acid. Anim. Sci. 82:479–492.
Shingfield, K. J., C. K. Reynolds, G. Hervás, J. M. Griinari, A. S. Grandison, and D. E. Beever. 2006. Examination of the persis-tency of milk fatty acid composition responses to fish oil and sun-flower oil in the diet of dairy cows. J. Dairy Sci. 89:714–732. Troegeler-Meynadier, A., M. C. Nicot, and F. Enjalbert. 2007.
Ef-fects of fat source and dietary sodium bicarbonate plus straw on the conjugated linoleic acid content of milk of dairy cows. Arch. Anim. Nutr. 61:406–415.
Vlaeminck, B., V. Fievez, A. R. J. Cabrita, A. J. M. Fonseca, and R. J. Dewhurst. 2006. Factors affecting odd- and branched-chain fatty acids in milk: A review. Anim. Feed Sci. Technol. 131:389–417. Zened, A., A. Troegeler-Meynadier, M. C. Nicot, S. Combes, Y.
Fa-rizon, and F. Enjalbert. 2011. Starch and oil in the donor cow diet and starch in substrate differently affect the in vitro rumi-nal biohydrogenation of linoleic and linolenic acids. J. Dairy Sci. 94:5634–5645.

![Effects of fish oil and starch added to a diet containing sunflower-seed oil on dairy goat performance, milk fatty acid composition and in vivo Δ9-desaturation of [13C]-vaccenic acid](data:image/gif;base64,R0lGODlhAQABAIAAAP///wAAACH5BAEAAAAALAAAAAABAAEAAAICRAEAOw==)