HAL Id: hal-03009613
https://hal.archives-ouvertes.fr/hal-03009613
Submitted on 26 Mar 2021
HAL is a multi-disciplinary open access
archive for the deposit and dissemination of
sci-entific research documents, whether they are
pub-lished or not. The documents may come from
teaching and research institutions in France or
abroad, or from public or private research centers.
L’archive ouverte pluridisciplinaire HAL, est
destinée au dépôt et à la diffusion de documents
scientifiques de niveau recherche, publiés ou non,
émanant des établissements d’enseignement et de
recherche français ou étrangers, des laboratoires
publics ou privés.
The 3-D Velocity Models and Seismicity Highlight
Forearc Deformation Due to Subducting Features
(Central Vanuatu)
O. Foix, W. Crawford, I. Koulakov, C. Baillard, M. Régnier, B. Pelletier, E.
Garaebiti
To cite this version:
O. Foix, W. Crawford, I. Koulakov, C. Baillard, M. Régnier, et al.. The 3-D Velocity Models and
Seismicity Highlight Forearc Deformation Due to Subducting Features (Central Vanuatu). Journal
of Geophysical Research : Solid Earth, American Geophysical Union, 2019, 124 (6), pp.5754-5769.
�10.1029/2018JB016861�. �hal-03009613�
Features (Central Vanuatu)
O. Foix1 , W. C. Crawford1 , I. Koulakov2 , C. Baillard3, M. Régnier4, B. Pelletier5, and E. Garaebiti6
1Institut de Physique du Globe de Paris, CNRS, Université de Paris, Paris, France,2Institute of Petroleum Geology and
Geophysics–SB RAS, Novosibirsk State University, Novosibirsk, Russia,3School of Oceanography, University of
Washington, Seattle, WA, USA,4UMR Géoazur, Université Nice Sophia‐Antipolis, Valbonne, France,5UMR Géoazur, Institut de Recherche pour le Développement, Noumea, New Caledonia,6Vanuatu Meteorology and Geohazards
Department, Port Vila, Vanuatu
Abstract
The central Vanuatu forearc is characterized by a reduced convergence rate at the trench, significant uplift of the overriding plate, and the presence of large forearc islands. Volcanic activity and intermediate‐depth seismicity behind the forearc are among the highest on Earth. These features are presumed to be associated with the subduction of a large seamount chain and an immersed ridge. We used a catalog of P and S arrivals from a local seismological network to construct thefirst 3‐D velocity model of the region and to relocate earthquakes beneath the forearc. The 3‐D model reveals a highly heterogeneous velocity distribution in thefirst 40 km beneath the surface. Trench‐parallel low P and S velocity zones in the upper tens of kilometers beneath the western edges of the two largest forearc islands correlate to the major features entering into subduction and suggest highly fractured and probably water‐infiltrated features. Trench‐parallel high‐velocity zones at 5–15‐km depth, further to the east, may be part of a continuous consolidated rock structure that acts as a backstop. Thick overriding plate crust (29 ± 3 km) in the forearc is consistent with the presence of continental remnants. The earthquake distribution is generallyheterogeneous, suggesting a complex fault structure and variable stress. Earthquakes are, however, well aligned at the plate interface in between the subducting features, where they constrain the angle of subduction to be 15° on average, down to 10–15‐km depth.
1. Introduction
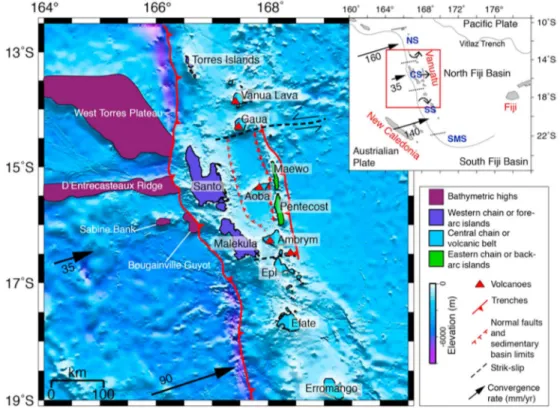
The Vanuatu Subduction Zone (VSZ) in the Southwest Pacific Ocean (11–23°S, 165–171°E) resulted from the interaction of the North Fiji Basin and Vanuatu microplates (also referred to as the“forearc plate”) with the Australian plate (also referred to as the“oceanic plate”) since the late Miocene (Chase, 1971; Figure 1). The central segment of the VSZ (14–17°S) is dominated by the subduction‐collision interaction of the island arc with large morphologic features on the Australian Plate, notably the D'Entrecasteaux Fracture Zone (DFZ) and the West Torres plateau. In front of these features, the subduction trench vanishes (Collot et al., 1985); the forearc uplifts—currently up to 6 mm/year (Bergeot et al., 2009; Taylor et al., 1980, 1987, 1990; Taylor et al., 2005)—and convergence across the subduction front slows to 35 mm/year (compared to 160 mm/year to the north and 120 mm/year to the south (Calmant, 1995; Calmant et al., 2003; Louat & Pelletier, 1989; Taylor, 1995)).
Deformation due to the DFZ may cause seismic velocity variations associated with fracturing,fluids, and petrologic variations. Previous seismological studies of the upper mantle and crust beneath central Vanuatu suggested the presence of complex subsurface structures and processes associated with subducting features (e.g., Dubois, 1971; Kaila & Krishna, 1978; Pontoise & Tiffin, 1986; Zhou, 1990), but lacked the necessary resolution to determine the effect of individual asperities.
The presence of large forearc islands within 20–50 km of the trench makes this an ideal area to study the seismogenic zone using a local seismological network. We present here thefirst three‐dimensional velocity model and improved earthquake locations beneath the western part of the central VSZ. We performed a 3‐D joint inversion of the 2008–2009 ARC‐VANUATU local earthquake catalog for P and S velocities, using the LOcal TOmography Software (LOTOS) package (Koulakov, 2009a; Koulakov, 2012). We used the new 3‐D
©2019. American Geophysical Union. All Rights Reserved.
Key Points:
• Trench‐parallel low P and S velocity anomalies beneath the forearc correlate to major reliefs entering subduction
• A trench‐parallel high‐velocity anomaly may be part of a continuous consolidated rock structure (backstop) • The earthquake distribution is
heterogeneous, suggesting a complex stress regime and fault structure Supporting Information: • Supporting Information S1 Correspondence to: O. Foix, foix@ipgp.fr Citation:
Foix, O., Crawford, W. C., Koulakov, I., Baillard, C., Régnier, M., Pelletier, B., & Garaebiti, E. (2019). The 3‐D velocity models and seismicity highlight forearc deformation due to subducting features (central Vanuatu). Journal of Geophysical Research: Solid Earth, 124, 5754–5769. https://doi.org/10.1029/ 2018JB016861
Received 11 OCT 2018 Accepted 4 MAY 2019
Accepted article online 10 MAY 2019 Published online 17 JUN 2019
model and the Non‐Linear Location (NLLoc) software package. Lomax et al. (2000) to relocate earthquakes, including 10,486 events beneath the seismic network. The 3‐D model and the earthquake distribution reveal the importance of subducted features on the structure, faulting, and seismicity on and around the subduction interface.
2. Geological and Local Seismological Overview
One of the most striking features of the central segment of the VSZ is the existence of three trench‐parallel island ranges: (1) the central volcanic arc islands; (2) the western forearc islands, dominated by Vanuatu's two largest islands: Santo and Malekula; and (3) the eastern back arc composed of two elongated islands (Maewo and Pentecoste; Mitchell & Warden, 1971; Mallick, 1975; Carney & MacFarlane, 1982; Figure 1). All three ranges have a volcanic composition but with different ages, ranging from Oligocene to Quaternary, indicating a complex subduction history (e.g., Carney & MacFarlane, 1982; Greene et al., 1994). Recently, Buys et al. (2014) dated the formation of the central segment's forearc range from the late Eocene to Miocene but discovered very old zircon grains in the volcanic rocks (2.8 Ga to 220 Ma), suggesting that the range's basement comprises continental material rifted from Australia prior to the Cenozoic. Subducting features appear to drive the deformation of Vanuatu's central segment and particularly the fore-arc range, whose islands come as close as 25 km to the subduction front and which has many features which appear to directly correlate with the subducting DFZ. The DFZ is believed to be responsible for the uplift and tilting of the Quaternary surface on Santo and Malekula islands (Taylor et al., 1980; Gilpin, 1982) and for the reactivation of normal faults on Santo (Mallick & Greenbaum, 1977; Isacks et al., 1981). The collision appears to push the central segment to the east, generating compression in the back‐arc region (Maewo and Pentecost Islands) and strike‐slip faults accompanied by clockwise rotation of the northern section and counterclockwise rotation of the southern section (Bergeot et al., 2009; Calmant, 1995; Calmant et al., 2003; Collot et al., 1985; Louat & Pelletier, 1989; Taylor, 1995).
Figure 1. Overview of the Vanuatu subduction zone. Inset: the four segments of the arc defined by Louat and Pelletier (1989) and their GPS motions, NS = North Segment, CS = Central Segment, SS = South Segment, SMS =
Southernmost Segment. Central map: central segment of the Vanuatu subduction zone, modified from Baillard et al. (2015). Convergence vectors are from Calmant et al. (2003).
10.1029/2018JB016861
The DFZ is composed of two parallel features: (1) a northern ridge and (2) a southern volcanic chain that includes Sabine Bank and Bougainville guyot (Daniel & Katz, 1981; Maillet et al., 1983; Collot et al., 1985; Fisher et al., 1991; Figure 1). The northern ridge is 40 km wide, oriented east west, and rises up to 3,000 m above the surrounding seafloor. It is composed of Paleocene‐Eocene oceanic crust and is covered by sedi-ments (Collot et al., 1994; Maillet et al., 1983). Maillet et al. (1983) proposed that the ridge is a remnant of the Eocene Vitiaz subduction zone, in which the Pacific plate to the north subducted beneath the Australian plate to the south. In the DFZ's southern volcanic chain, Bougainville guyot is a Eocene volcano covered by Oligocene, Miocene, and Pleistocene neritic limestone and pelagic carbonates, indicating that it was sub-jected to several subaerial exposures before subsidence (Collot et al., 1992; Maillet et al., 1983; Quinn et al., 1994).
North of the DFZ, the West Torres plateau covers an area of 35,000 km2and rises up to 4,000 m above the seafloor. Yan and Kroenke (1993) proposed that the plateau was formed in the Oligocene by a mantle plume and its collision with the central segment is dated at 0.7 Ma (Meffre & Crawford, 2001).
Seismological studies in the region have used global data, a 1978–1988 network of 27 land stations deployed over the island arc (e.g., Coudert et al., 1984; Prevot et al., 1991) and the 2008–2009 ARC‐VANUATU local forearc seismology network (Baillard et al., 2015). These studies indicate that the probable prolongation of the DFZ beneath Vanuatu correlates with a locally shallow subduction interface (Baillard et al., 2015) and, at 100–250‐km depth, with alignments in seismicity and a region of high P wave attenuation (Baillard et al., 2018; Chung & Kanamori, 1978; Marthelot et al., 1985; Pascal et al., 1978).
Seismological studies also indicate a mean forearc plate crustal thickness of 25–30 km (Baillard et al., 2015; Coudert et al., 1984; Prevot et al., 1991). Prevot et al. (1991) showed evidence that the Moho was locally shal-lower beneath south Santo and deeper beneath Malekula.
Station corrections for a 1‐D velocity inversion (Baillard et al., 2015) indicate strong variations in near‐ surface velocities, with low velocities beneath west Santo and high velocities beneath east Santo. Baillard et al. (2015) proposed that the low velocities were associated with the dense fault network characterizing the western Santo mountain ranges and that the high velocities could be caused by compacted limestones beneath eastern Santo.
3. Methodologies and Materials
We calculated 3‐D P and S velocity models using the LOTOS joint inversion software package on a selected subset of the ARC‐VANUATU catalog. We then relocated the full catalog using the 3‐D model and the NLLoc software package.
3.1. Data Set
The ARC‐VANUATU project included the deployment of a seismological network of 20 land stations and 10 ocean bottom seismometers (OBS) over the central Vanuatu forearc (Figure 2; Baillard, 2014; Baillard et al., 2015). The stations were spaced 15–25 km apart and the start date was in April 2008, with the land stations collecting 10 months of data and the OBSs 4 months of data. Eight of the OBS seismometers failed and so most events were picked on the hydrophone channel, allowing only P waves to be reliably picked. Over 40,000 local earthquakes were detected using an automatic picking procedure and 31,190 of them were located using a 1‐D velocity model and the HYPOCENTER code (Baillard et al., 2014; Baillard et al., 2015; Lienert & Havskov, 1995). The catalog's magnitude of completion is 2.1 ML, the largest magnitude is 6.8
ML, and the b value is 0.92.
The ARC‐VANUATU catalog is divided into two broad groups of events: (1) about 14,600 “shallow” earth-quakes (<80‐km depth, maximum MLof 5.9), which are mostly located beneath the network, and (2) about
16,600 intermediate‐depth earthquakes (80–250 km), which are mostly on the subducting slab east of the network. Hypocenters of the second group are poorly constrained by the ARC‐VANUATU network. For the joint inversion, we selected a subset of well‐constrained earthquakes according to the following criteria: RMS time residuals <0.6 s, horizontal uncertainties <10 km, vertical uncertainties <15 km, depths <80 km, at leastfive stations picked (P plus S), and a maximal distance of 100 km to the nearest station. We did not use azimuthal gap constraints in the LOTOS inversion as they greatly reduce the number of
earthquakes and inversion resolution without increasing reliability (Koulakov, 2009b; Kuznetsov & Koulakov, 2014; Martí et al., 2017; Giampiccolo et al., 2017; Figure S1). The earthquake selection distribution is managed by LOTOS (section 3.2). This selection provided an“inversion catalog” of 2,552 earthquakes, with 21,764 P picks and 20,129 S picks (Figure 2).
3.2. Passive Local Tomography
We used the LOTOS package (Koulakov, 2009a) to calculate our 3‐D velocity model. LOTOS uses a tomo-graphic algorithm which jointly inverts for P and S velocity structures, station corrections, origin times, and earthquake coordinates using the LSQR method (Van der Sluis & Van der Vorst, 1987). LOTOS inverts first in 1‐D, then in 3‐D (Figure S2). In the 1‐D stage, LOTOS selects a subset of events that are uniformly distributed over depth (Koulakov, 2009a) and relocates them using a grid search method (Koulakov & Sobolev, 2006). In the 3‐D stage, sources are located using a gradient method for efficiency. Rays are traced using a modified bending algorithm, based on the Fermat principle of travel time minimization.
The parameterization grid has a uniform spacing in map view. In the vertical direction, the distance between nodes is set according to the ray density. Our P and S velocity models are composed of 22,000 and 19,000 nodes, respectively. To reduce any artifacts related to grid orientations, the inversions are performed on four grids with basic azimuthal orientations of 0, 22, 45, and 66 degrees and the results are then averaged. We chose smoothing and damping parameters of 0.7 and 3 for Vpand 2 and 6 for Vs. These values were selected
by evaluating checkerboard tests and RMS time residuals.
Our velocity grid is a 290 × 290 × 103 km (x, y, z) volume with nodes every 5 km (Figure S3). The initial 1‐D velocity model and Vp/Vsratio are from Baillard (2014) (Figure 2). We calculate roughness as the integrated
square of the second differences of the model in three dimensions (Lees & Crosson, 1989; Zelt & Barton, 1998). The solution was optimal after three iterations, with RMS time residuals no longer significantly decreasing and roughness monotonically increasing for subsequent iterations (Figure 3).
We evaluated the resolution of our solutions using checkerboard tests (5 to 30 km3, with ±10% velocity change), free‐shape anomaly tests, and ray coverage (Figures 4 and S4–S8). The forms for the free‐shape anomaly tests have similar shapes to those output by the data inversion, and are set using polygonal patterns within defined depth intervals. Synthetic travel times were computed for the same source‐receiver pairs as in the experimental data set. The synthetic travel times were calculated and then perturbed by random noise with an average standard deviation of 0.1 s which corresponds to the manual‐automatic pick time residuals for P waves (Baillard et al., 2014). The inversion was then run with starting source positions moved back to the locations provided in the starting 1‐D model.
Figure 2. The principal inputs for the 3‐D inversion. (a) Positions of the ARC‐VANUATU seismological network stations. The black line represents the subduction boundary. (b) The input 1‐D velocity model, from Baillard et al. (2015). (c) The 2,552 earthquakes selected for the joint inversion: each circle represents one earthquake, with size proportional to the magnitude and color dependent on depth. The black box represents the limits for the tomography and earthquake inversion.
10.1029/2018JB016861
Checkerboard tests indicate that 15‐km3anomalies could be resolved to a maximum depth of 25 km and that 20–30‐km3anomalies could be resolved to a maximum depth of 40 km. The 5‐km3resolution tests are not resolved and 10‐km3
anomalies are weakly resolved down to 15 km3in the middle of the network. Thefirst 5–8‐km depth is not well resolved because of the lack of ray crossing at these depths (Figure S8). The Vs
model is less well constrained than the Vpmodel—the model roughness is 3 times larger for Vpthan for
Vs(Vproughness = 4.4 × 10⁴km/s and Vsroughness = 1.4 × 10⁴km/s), whereas the RMS time residuals
are only 13% higher (0.228 s for Vpversus 0.202 s for Vs). The difference in roughness is particularly strong
beneath west Santo and Malekula Islands, probably because the OBS data did not allow reliable S picks. This makes Vp/Vs anomalies impossible to evaluate, as these anomalies mostly reflect the higher Vp
roughness (Figure S9).
Checkerboard and free‐shape anomaly tests indicate that the area beneath the network is well resolved enough to interpret anomalies with minimum dimensions of 10–15 km. We also tested the effect of different 1‐D input velocity model on our output model: all of the anomalies discussed in this paper are present regardless of the input model (Figure S10).
Figure 3.P and S mean RMS and roughness of the 3‐D velocity model(s) at each iteration. The vertical black line indicates the chosen iteration.
Figure 5. Map sections of the 3‐D Vpmodel. Grey triangles correspond to seismic stations. White dots are earthquake locations within 4 km of the slice depth. The unmasked regions have the highest node density. The thick black line indicates the subduction limit at the seafloor and the thin black subparallel line indicates the subduction interface at the given depth.“DER” marks the D'Entrecasteaux Ridge and “BG” marks Bougainville Guyot. Velocity anomalies are marked by letters and dotted contours, earthquake clusters by numbers, and solid contours.
10.1029/2018JB016861
3.3. The 3‐D Earthquake Locations
We relocated the 1‐D ARC‐VANUATU catalog events using the new 3‐D velocity models and the NLLoc software (Lomax et al., 2000). The NLLoc algorithm computes travel times in a heterogeneous 3‐D model by solving for the eikonal equation and searches for hypocenters using the Oct‐Tree method (Lomax et al., 2000). The smaller the velocity model grid size is, the smaller the location errors are (Monteiller, 2005), but below a threshold grid size, the calculation time increases for negligible improvements in location. We use the same 3‐D model bounds as for LOTOS: 290 × 290 × 103 km3, and we found that a 1 × 1 x 1‐km3 grid size works well for this zone.
We required a minimum of eight picks per earthquake, including a minimum of two S picks. This reduced the number of input events to 22,048, of which 9,364 had been located within the 3‐D inversion box bounds by the 1‐D inversion. NLLoc located 10,486 events within the inversion box. Because of our stricter selection criteria and because the NLLoc software does not correlate input and output hypocenters, we cannot directly correlate our locations with the 1‐D locations of Baillard (2014), but we analyze earthquakes common to both catalogs in section 4.2.
4. Results
The 3‐D P and S velocity models and the earthquake distribution indicate (1) a line of shallow low‐velocity anomalies parallel to and approximately 40 km from the subduction front; (2) a parallel line of high‐velocity anomalies, further from the subduction front and generally slightly deeper, (3) high velocities at shallow depths beneath east Santo; (4) variations in crustal thickness that correlate with subducting features; and (5) a low‐ angle plate interface down to 10–20‐km depth.
4.1. The 3‐D Velocity Models
The anomalies that we describe in this section are labeled from A to F for low‐velocity anomalies and from G to K for high‐velocity anomalies (Figures 5–8). Figures S11 and S12 are map views (like Figures 5 and 6), but of velocity anomalies rather than absolute velocities and reveal the same velocity variations.
The most striking feature of the velocity model is the presence offive shallow (5–15‐km depth) low‐velocity anomalies, extending from west Santo to northwest Malekula and aligned approximately parallel to the sub-duction front (anomalies A–E; Figures 5–8). These anomalies extend from the subduction interface up to near the surface. The A and E anomalies are up to 16 km wide, whereas anomalies B, C, and D are from 7 to 12 km wide. Anomaly D is collocated with a low‐velocity region detected in the block model of Prévot et al. (1991).
A sixth low‐velocity anomaly (anomaly F) lies further east, beneath the central‐east part of Malo island. This anomaly is shallower (5–10‐km depth) than anomalies A–E and is well above the subduction interface. Viewed from above, it is smaller than anomalies A‐B and D‐E, but larger than anomaly C.
Five high‐velocity anomalies (G–K) are on a line parallel to and east of anomalies A–E. Their depths are much more variable than anomalies A–E, with central depths ranging from 5 km (anomalies G, I, and K) to 15 km (anomaly H). The anomalies are up to 18 km wide in the convergence direction and above but gen-erally near to the plate interface. They all have similar velocities (7.5 ± 0.2 km/s) and the anomaly that they create depends mostly on the velocities of the surrounding rock. Shallow (<10 km) velocities are particularly fast and variable beneath east Santo, with Vpfrom 6.3 to 7.3 km/s compared to 5.7–6.3 km/s at the same
depths beneath the rest of the western range (Figures 5 and 6). This is consistent with the trend of station corrections found by Baillard et al. (2015) (Figure S13).
We use isovelocity contours of 7.8 and 6.5 km/s as Moho proxies to estimate the crustal thickness of the forearc and the incoming plate, respectively. While isovelocities are not as precise as Moho reflectors, they allow us to get a sense of crustal thickness variations in each region. For the forearc, 7.8 km/s corre-sponds to a change in velocity with depth in our inverted models (Figure S14) and gives thicknesses con-sistent with those estimated by Prévot et al. (1991). For the incoming plate, we chose a value concon-sistent with hydrated crust and upper mantle (Fox et al., 1973), as indicated by our estimated thicknesses and supported by the double seismic zone and possibly also by the strong uplift observed where this plate sub-ducts beneath the forearc (Baillard et al., 2018).
We estimate the average forearc plate crustal thickness (constrained only east of Santo and Malekula islands) as 29 ± 3 km (Figures 7 and S15a). Crustal thickness is relatively constant in most cross sections, except in the north (cross sections 1 and 2) and center (cross section 7), where it increases toward the trench. We estimate the incoming plate thickness as 8 to 15 km (Figure S15b). This is thicker than the normal ocea-nic crust range of 7 ± 1.5 km (White et al., 1992), most likely because of the presence of the DFZ.
Figure 6. Map sections of 3‐D Vsmodel obtained with LOTOS software. Symbols and lines are the same as in Figure 5.
10.1029/2018JB016861
4.2. Earthquake Locations
The 10,486 earthquakes relocated in the inversion box using the new 3‐D velocity model are shown in Figures 5–8. Figure 9 compares our locations with those from Baillard et al. (2015), in the center of the network. There, our 3‐D model reduces RMS time residuals from 0.58 s to 0.23 s and position Figure 7. Cross sections of the 3‐D Vpmodel. White triangles are seismic stations, and white dots are earthquake locations. The unmasked parts of the cross sec-tions have the highest node density. Solid grey line marks the subduction interface from Baillard et al. (2014); solid black line marks our new estimate. Thickest solid line marks the forearc plate Moho, based on the 7.8‐km/s contour. Black arrows mark the subduction front. S = Santo, Ao = Aore, Ml = Malo, Ma = Malekula.
uncertainties (x, y, z) from 10.9, 6.8, and 19.3 km to 4.8, 2.8, and 5.0 km (Figure S16). Clustering and alignment of these earthquakes are clearer than for the 1‐D model and the mean distance between hypocenters in each cluster is reduced (for example, from 10.9 to 7.4 km in cluster 1 and from 16.1 to 2.6 km in cluster 3). The average depths of some of these alignments also change significantly.
The new locations do not change the basic conclusions of Baillard et al. (2015) about clustering: (1) there is no clear alignment of earthquakes along the subduction interface beneath most of the network, (2) most of the crustal seismicity is scattered and most clusters are not aligned with one another, and (3) there is signif-icant seismicity within the subducting plate. They do, however, refine some of these observations: Figure 8. Cross sections of the 3‐D Vsmodel. Symbols and lines are the same as in Figure 7.
10.1029/2018JB016861
1. At the plate interface, the most significant alignment of earthquakes, between south Santo and north Malekula, is slightly deeper than indicated by Baillard et al. (2015; Figure 9, cluster labeled“1”). 2. Within the oceanic plate, clusters of seismicity are better defined. Notably, sections 3–6 contain a
cluster that is subparallel to and approximately 20 km beneath the plate interface (labeled “2” in sections 5 and 6).
3. Some of the clusters in the forearc plate coincide with features in the velocity model. At the north end of the network, a cluster at approximately 15‐km depth coincides with high‐velocity anomaly G (section 1 and Figure 5). Another cluster is observed east of Malo island at about 20‐km depth (sections 7 and 8 and Figures 7 and 8, labeled“3”). This cluster is not near the high‐velocity anomalies but lies above what appears to be deformed Moho. Sections 2, 6, and 12 exhibit enhanced seismicity in the forearc plate man-tle just beneath the Moho.
We also note a large cluster of earthquakes southwest of Malekula island, well outside of our network (Figure 5, labeled“4”). This cluster is in a region where the global seismological network detected enhanced seismicity from 1984 to 2014.
5. Discussions
Although the central Vanuatu forearc has several atypical features for a Marine Forearc, the underlying seis-mic velocities are similar to those observed at other Marine Forearcs (e.g., Hicks et al., 2014). The particula-rities of the forearc are mostly observed through velocity anomalies, seismicity patterns, and the shape of the slab, each of which we discuss below.
5.1. Low‐Velocity Anomalies
Low‐velocity anomalies A‐B and D‐E appear to correlate with features of the DFZ (the northern D'Entrecasteaux ridge plus the southern volcanic chain; Figure 5). Anomalies A and B, beneath southwest Santo, align roughly with the DER (which curves to the south as it subducts; Baillard et al., 2018), whereas anomalies D and E, near and beneath northwest Malekula, correspond to the continuation of the DFZ's southern volcanic chain. These low‐velocity anomalies may reflect both the high water content of the strongly fractured subducted features through sediments andfluid associated with slab dehydration or change in porefluid content (Liu & Zhao, 2018; Mishra et al., 2003; Ranero et al., 2005; Zhao et al., 2011) and a forearc plate damaged zone resulting from the subduction collision of the DFZ. A line through Figure 9. Comparison of event hypocenters from Baillard et al. (2015) and this study. (right) Map view, the two lines par-allel to the cross‐section projection show the section width (50 km). DER = D'Entrecasteaux Ridge, BG = Bougainville Guyot. (left) Cross sections from (top) Baillard et al. (2015) and (bottom) this study. The dashed line is the subduction interface from Baillard et al. (2015). Circles outline clusters discussed in the text.
these anomalies crosses the region of maximum Holocene uplift rate on south Santo island (Taylor et al., 2005), further indicating that these are subducted features that play an important role in the forearc geodynamics.
Low‐velocity anomaly C lies between major features on the subducting plate. It is also slightly east of the line formed by anomalies A‐B and D‐E and is aligned along‐dip with low‐velocity anomaly F (Figures 5 (Z = 10 km) and 7 and section 7). There is no clear source on the oceanic plate for anomalies C and F (moreover, F is well above the subduction interface), but C could be an isolated feature on the subducting plate and/or one or both could be effect of the high‐velocity feature discussed in section 5.2. The West Malo area around these anomalies has undergone some uplift and subsidence cycles, probably due to impinging bathymetric fea-tures (Taylor et al., 2005).
5.2. High‐Velocity Anomalies, or High‐Velocity Feature
High‐velocity anomalies G–K may be part of a continuous or semicontinuous along‐arc high‐velocity fea-ture. Indeed a zone with the same velocity (7.5 ± 0.2 km/s) is seen in nearly all cross sections, at the same distance from the subduction front, but its visibility as an anomaly depends on the surrounding velocities. This feature varies in depth, creating a greater velocity anomaly when it is shallower than when it is dee-per. The feature is located in the forearc plate and its position corresponds generally with a high‐velocity zone indicated by Prévot et al. (1991).
There are several possible causes for this high‐velocity feature. It could be a crystalline structure related to the history of the forearc, it could be Australian continental remnants (Buys et al., 2014), or it could be cre-ated by the exhumation of deep materials through major faulting (e.g., Theunissen et al., 2012). Exhumation could explain the large number of surface faults and up to 20–60% of the observed uplift of Santo and Malekula (Baillard, 2014; Bergeot et al., 2009; Taylor et al., 2005). This structure could play the role of a backstop against which the material going into subduction is accreted (e.g., Peacock, 1993; Reyners et al., 1999).
5.3. High and Heterogeneous Velocities in East Santo Upper Crust
High and heterogeneous velocities in the upper crust beneath east Santo may be caused by variations in rock types or a heterogeneous stressfield in the plate. These variations are probably in the volcanic layers, as the sedimentary rock layer is less than 4 km thick (Robinson, 1969; Mallick & Greenbaum, 1977; Pelletier et al., 1994). Some of the variations could come from tilting and erosion of this region, and/or from the heteroge-neous strain and faulting indicated by the chaotic‐seeming distribution of earthquake clusters. Alternatively, they could come from past volcanic eruptions through a continental (or previous volcanic) basement. The higher velocities here than beneath Malekula or western Santo could be due to less major faulting, as the region is further from the plate boundary and should be less affected by the subduction of features on the oceanic plate. This region is located east of the point where the slap dip rapidly increases and is consequently much farther above the subduction interface (generally >20 km, compared to <10 km for west Santo). 5.4. Seismicity
The region between Santo and Malekula islands is the only area where earthquakes clearly align at the sub-duction interface (Figures 7 and 9 and sections 7–9). This region is approximately in front of Bougainville seamount, but deep seismicity and morphologic features suggest that the impacting features are migrating north along the subduction front over time (e.g., Taylor & Quinn, 1994), so this area would fall between the subducted DER and Bougainville seamount chains.
Elsewhere, collision with features on the DFZ could block strain accommodation at the plate interface. Alternatively, low seismicity could be a sign of efficient slipping due to highly hydrated subducted crust (mantle wedge serpentinization; Baillard et al., 2015). The relatively high levels of seismicity observed in the crust of both plates suggest that the former explanation is at least part of the story, with surrounding crust highly deformed by strain accumulating at the plate interface. The presence or absence of aligned seis-micity at the subduction interface may reflect “locked” and “unlocked” areas (Figure 10). Locked regions lack aligned seismicity at the subduction interface because of the collision with major DFZ features. Unlocked regions, on the other hand, lack major subducted bathymetric features and consequently have an earthquake alignment at the interface.
10.1029/2018JB016861
Earthquake clusters at about 40‐km depth in the mantle wedge (sections 2, 6, and 12) are near to the region of the subduction interface and could be explained by the stick‐slip behavior of the interface. At these depths the mantle wedge is barely serpentinized, as dehydration processes are shifted to relatively deep depth due to the high thermal parameter of the oceanic plate (Baillard et al., 2015).
5.5. Crustal Thickness
The forearc plate crust thickness of ~29 ± 3 km is relatively thick for a Marine Forearc and could be asso-ciated with a continental Australian crust origin (Buys et al., 2014). The oceanic plate crust thickness varies from 8 to 15 km.
Changes in the crustal thickness of both plates correlate with subducting features. The forearc plate Moho is perturbed where the two legs of the DFZ enter into subduction (sections 1‐2 and 11‐12). The subducting plate crust, thin in the north and of oceanic type, appears to thicken greatly south of the DFZ, which corresponds well with the interpretation of the DFZ as an ancient subduction zone with a south polarity (Pontoise & Tiffin, 1986).
5.6. Shape of the Subducting Plate
The tomography model and its associated earthquake hypocenters provide new constraints on the subduc-tion interface (Figure 7). In thefirst 5–30‐km depth, this limit is generally deeper (steeper) in sections 1–8 and shallower (flatter) in sections 9–12 than that indicated by Baillard (2014). This is especially notable in front of the DER (sections 1–5). The average subduction interface slope is 13–17° down to 10 km below the depth of the subduction front, indicating that the subduction interface could be as shallow as 6 km beneath parts of the west coast of Santo island.
6. Conclusions
We calculated a 3‐D, 290 × 290 × 103 km3
, velocity model of the central Vanuatu forearc, using earthquakes recorded by the 10‐month, 30‐station ARC‐VANUATU land‐sea seismological network. We used this model to locate 10,486 earthquakes beneath the network. The model and earthquake locations reveal the following (see also Figure 10):
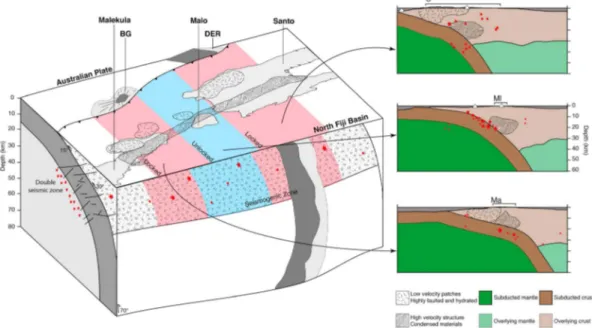
Figure 10. A summary of structure and geodynamics beneath central Vanuatu. DER = D'Entrecasteaux Ridge, BG = Bougainville Guyot, S = Santo, Ml = Malo, Ma = Malekula. Red stars represent earthquakes. (left) Locked (red): colli-sion with bathymetric features, no aligned seismicity at the plate interface. Unlocked (blue): Little or no subducting bathymetric features, aligned seismicity at the plate interface. The position of the subducted DER is from Baillard et al. (2014). (right) Schematic cross sections of locked and unlocked areas.
1. A trench‐parallel line of low‐velocity anomalies, passing approximately beneath the west coasts of the forearc islands. The anomalies are probably caused by subducted features of the DFZ.
2. A trench‐parallel high‐velocity “backstop” located further inland beneath the forearc islands, approximately beneath Santo island's transition from western mountains to eastern plateau. This backstop could be created by underplating, uplift of deeper materials, or remnants of Australian con-tinental crust.
3. High and heterogeneous velocities at shallow (5–10 km) depths beneath east Santo. The high velocities could be associated with the relatively unfaulted crust in this region, whereas the heterogeneity could be caused by magmatic intrusions.
4. A mostly heterogeneous distribution of earthquakes in the forearc plate crust and upper mantle, indicat-ing complex strains and fault structures associated with the subductindicat-ing features.
5. Aligned seismicity on the seismogenic zone only between the two main ridges of the DFZ. In this region the interface is low angle (13–17°) to about 10‐km depth. The interface depth beneath the west coasts of the forearc islands could be as little as 6 km.
6. A relatively thick forearc plate crust (29 ± 3 km), which could be associated with a continental crust ori-gin for the region.
References
Baillard, C., (2014). Sismicité et géodynamique dans la zone de subduction du Vanuatu. Ph. D thesis, IPGP, Paris
Baillard, C., Crawford, W. C., Ballu, V., Hibert, C., & Mangeney, A. (2014). An automatic kurtosis‐based P‐ and S‐phase picker designed for local seismic networks. Bulletin of the Seismological Society of America, 104(1), 394–409. https://doi.org/10.1785/0120120347 Baillard, C., Crawford, W. C., Ballu, V., Pelletier, B., & Garaebiti, E. (2018). Tracking subducted ridges through intermediate‐depth
seis-micity in the Vanuatu subduction zone. Geology, 46(9), 767–770. https://doi.org/10.1130/G45010.1
Baillard, C., Crawford, W. C., Ballu, V., Régnier, M., Pelletier, B., & Garaebiti, E. (2015). Seismicity and shallow slab geometry in the central Vanuatu subduction zone. Journal of Geophysical Research: Solid Earth, 120, 5606–5623. https://doi.org/10.1002/2014jb011853 Bergeot, N., Bouin, M. N., Diament, M., Pelletier, B., Regnier, M., Calmant, S., & Ballu, V. (2009). Horizontal and vertical interseismic
velocityfields in the Vanuatu subduction zone from GPS measurements: Evidence for a central Vanuatu locked zone. Journal of Geophysical Research, 114, B06405.
Buys, J., Spandler, C., Holm, R. J., & Richards, S. (2014). Remnants of ancient Australia in Vanuatu: Implications for crustal evolution in island arcs and tectonic development of the southwest Pacific. Geology, 42(11), 939–942. https://doi.org/10.1130/G36155.1
Calmant, S. (1995). Geodetic measurements of convergence across the New Hebrides subduction zone. Geophysical Research Letters, 22(19), 2573–2576. https://doi.org/10.1029/95GL01780
Calmant, S., Pelletier, B., Lebellegard, P., Bevis, M., Taylor, F. W., & Phillips, D. A. (2003). New insights on the tectonics along the New Hebrides subduction zone based on GPS results. Journal of Geophysical Research, 108(B6), 2319.
Carney, J. N., & MacFarlane, A. (1982). Geological evidence bearing on the Miocene to Recent structural evolution of the New Hebrides arc. Tectonophysics, 87(1–4), 147–175. https://doi.org/10.1016/0040‐1951(82)90225‐6
Chase, C. G. (1971). Tectonic history of the Fiji Plateau. GSA Bulletin, 82(11), 3087–3110. https://doi.org/10.1130/0016‐7606(1971)82[3087: THOTFP]2.0.CO;2
Chung, W., & Kanamori, H. (1978). A mechanical model for plate deformation associated with aseismic ridge subduction in the New Hebrides arc. Tectonophysics, 50, 29–40.
Collot, J., Daniel, J., & Burne, R. (1985). Recent tectonics associated with the subduction/collision of the D'Entrecasteaux zone in the central New Hebrides. Tectonophysics, 112(1‐4), 325–356. https://doi.org/10.1016/0040‐1951(85)90185‐4
Collot, J., Lallemand, S., Pelletier, B., Eissen, J., Glacon, G., Fisher, M., & Monzier, M. (1992). Geology of the d'Entrecasteaux‐New Hebrides island arc collision zone: Results from a deep sea submersible survey. Tectonophysics, 212(3‐4), 213–241. https://doi.org/10.1016/0040‐ 1951(92)90292‐E
Collot, J. Y., Greene, H. G., Fisher, M. A., & Geist, E. L. (1994). Tectonic accretion and deformation of the accretionary wedge in the north d'entrecasteaux ridge‐new Hebrides Island arc collision zone: Evidence from multichannel seismic reflection profiles and LEG 134 results. Proceeding of the Ocean Drilling Program, Scientific Results, 134, 5–18.
Coudert, E., Cardwell, R. K., Isacks, B. L., & Chatelain, J.‐L. (1984). P‐wave velocity of the uppermost mantle and crustal thickness in the central Vanuatu islands (New Hebrides island arc). Bulletin of the Seismological Society of America, 74(3), 913–924.
Daniel, J., & Katz, H. R. (1981). d'Entrecasteaux Zone, trench and western chain of the central New Hebrides island arc: Their significance and tectonic relationship. Geo‐Marine Letters, 1(3–4), 213–219. https://doi.org/10.1007/BF02462436
Dubois, J. (1971). Propagation of P waves and Rayleigh waves in Melanesia: Structural implications. Journal of Geophysical Research, 76(29), 7217–7240. https://doi.org/10.1029/JB076i029p07217
Fisher, M., Collot, J., & Geist, E. (1991). The collision zone between the North d'Entrecasteaux Ridge and the New Hebrides Island Arc: 2. Structure from multichannel seismic data. Journal of Geophysical Research, 96(B3), 4479–4495. https://doi.org/10.1029/90JB00715 Fox, P. J., Schreiber, E., & Perterson, J. J. (1973). The geology of the oceanic crust: Compressional wave velocities of oceanic rocks. Journal
of Geophysical Research, 78(23), 5155–5172. https://doi.org/10.1029/JB078i023p05155
Giampiccolo, E., Brancato, A., Manuella, F. C., Carbone, S., Gresta, S., & Scribano, V. (2017). New evidence for the serpentinization of the Palaeozoic basement of southeastern Sicily from joint 3‐D seismic velocity and attenuation tomography. Geophysical Journal International, 211(3), 1375–1395. https://doi.org/10.1093/gji/ggx369
Gilpin, L. (1982). Tectonic geomorphology of Santo Island, Vanuatu (New Hebrides) (Thesis Master of Sci.)
Greene, H. G., Collot, J.‐y., Fisher, M. A., & Crawford, A. J. (1994). Neogene tectonic evolution of the New Hebrides Island Arc: A review incorporating ODP drilling results. Proceedings of the Ocean Drilling Program, Scientific Results, Volume 134, Vanuatu, 134(1974), 19–46.
10.1029/2018JB016861
Journal of Geophysical Research: Solid Earth
Acknowledgments
We would like to express our deepest gratitude to all the people who helped us to collect the ARC‐VANUATU seismological data, especially the Vanuatu Government and Geohazards Observatory. The data used in this study were collected throughout the ARC‐ VANUATU program, which was funded by the French National Research Agency (ANR), and seism-ometer stations used were from the French national SISMOB‐RESIF pool. The earthquake catalog, the 1‐D velo-city model used, and the station coor-dinates are available online at https:// drive.google.com/open?id= 0BwsPENuZf_JwU2swOGU3T215a0E. Seismological data are available at through https://doi.org/10.15778/ RESIF.3A2008. Data resulting from this study are in open access in Pangaea (https://doi.pangaea.de/10.1594/ PANGAEA.900962). Ivan Koulakov was supported by the Russian Foundation of Basic Research (RFBR) project 18‐55‐52003_MNT_a. We thank Audrey Galvé for her suggestions on the tomography. We add a special thanks to Kairly Jaxybulatov who provided great help in the use of LOTO Software. Kairly passed away in June 2018. We also thank the reviewers for their com-ments and recommendations.
Hicks, S., Rietbrock, A., Ryder, I., Lee, C. S., & Miller, M. (2014). Anatomy of a megathrust: The 2010 M8.8 Maule, Chile earthquake rupture zone imaged using seismic tomography. Earth and Planetary Science Letters, 405, 142–155. https://doi.org/10.1016/j. epsl.2014.08.028
Isacks, B., Cardwell, R., Chatelain, J., Barazangi, M., Marthelot, J.‐M., Chinn, D., & Louat, R. (1981). Seismicity and tectonics of the Central New Hebrides island arc. In D. W. Simpson, & P. G. Richards (Eds.), Earthquake Prediction: An International Review: American Geophysical Union Maurice Ewing Series, 4, (pp. 93–116).
Kaila, K. L., & Krishna, V. G. (1978). Upper mantle velocity structure in the New Hebrides island arc region. Journal of Physics of the Earth, 26, S139–S153.
Koulakov, I. (2009a). LOTOS code for local earthquake tomographic inversion: Benchmarks for testing tomographic algorithms. Bulletin of the Seismological Society of America, 99(1), 194–214. https://doi.org/10.1785/0120080013
Koulakov, I. (2009b). Out‐of‐network events can be of great importance for improving results of local earthquake tomography. Bulletin of the Seismological Society of America, 99(4), 2556–2563. https://doi.org/10.1785/0120080365
Koulakov, I. (2012). Code LOTOS‐12 for 3D tomographic inversion based on passive seismic data from local and regional events Table of content:, pp.1–59.
Koulakov, I., & Sobolev, S. V. (2006). A tomographic image of Indian lithosphere break‐off beneath the Pamir‐Hindukush region. Geophysical Journal International, 164(2), 425–440. https://doi.org/10.1111/j.1365‐246X.2005.02841.x
Kuznetsov, P. Y., & Koulakov, I. Y. (2014). The three‐dimensional structure beneath the Popocatépetl volcano (Mexico) based on local earthquake seismic tomography. Journal of Volcanology and Geothermal Research, 276, 10–21. https://doi.org/10.1016/j.
jvolgeores.2014.02.017
Lees, J. M., & Crosson, R. S. (1989). Tomographic inversion for three‐dimensional velocity structure at Mount St. Helens using earthquake data. Journal of Geophysical Research, 94(B5), 5716–5,728. https://doi.org/10.1029/JB094iB05p05716
Lienert, B. R., & Havskov, J. (1995). A computer program for locating earthquakes both locally and globally. Seismological Research Letters, 66(5), 26–36. https://doi.org/10.1785/gssrl.66.5.26
Liu, X., & Zhao, D. (2018). Upper and lower plate controls on the great 2011 Tohoku‐oki earthquake. Science Advances, 4(6), eaat4396. https://doi.org/10.1126/sciadv.aat4396
Lomax, A., Virieux, J., Volant, P., & Berge, C. (2000). Probabilistic earthquake location in 3D and layered models, (pp. 101–134). Netherlands: Springer.
Louat, R., & Pelletier, B. (1989). Seismotectonics and present‐day relative plate motions in the Tonga‐Lau and Kermadec‐Havre region. Tectonophysics, 165(1–4), 237–250.
Maillet, P., Monzier, M., Selo, M., & Storzer, D. (1983). The D'Entrecasteaux Zone (Southwest Pacific). A petrological and geochronological reappraisal. Marine Geology, 53(3), 179–197. https://doi.org/10.1016/0025‐3227(83)90073‐7
Mallick, D. I. J. & Greenbaum, D. (1977). Geology of southern Santo, New Hebrides Geological Survey Regional Report, (p. 84) Mallick, D. I. J. (1975). Development of the New Hebrides archipelago. Philosophical Transactions of the Royal Society, B: Biological Sciences,
272(918), 277–285. https://doi.org/10.1098/rstb.1975.0087
Marthelot, J. M., Chatelain, J. L., Isacks, B. L., Cardwell, R. K., & Coudert, E. (1985). Seismicity and attenuation in the central Vanuatu (New Hebrides) Islands: A new interpretation of the effect of subduction of the D'entrecasteaux Fracture Zone. Journal of Geophysical Research, 90(B10), 8641–8650. https://doi.org/10.1029/JB090iB10p08641
Martí, J., Villaseñor, A., Geyer, A., López, C., & Tryggvason, A. (2017). Stress barriers controlling lateral migration of magma revealed by seismic tomography. Scientific Reports, 7(1), 40757. https://doi.org/10.1038/srep40757
Meffre, S., & Crawford, A. J. (2001). Collision tectonics in the New Hebrides arc (Vanuatu). Island Arc, 10(1), 33–50. https://doi.org/ 10.1046/j.1440‐1738.2001.00292.x
Mishra, O., Zhao, D., Umino, N., & Hasegawa, A. (2003). Tomography of northeast Japan forearc and its implications for interplate seismic coupling. Geophysical Research Letters, 30(16), 1850. https://doi.org/10.1029/2003GL017736
Mitchell, H. G., & Warden, J. (1971). Geological evolution of the New Hebrides island arc. Journal of the Geological Society, 127(5), 501–529. https://doi.org/10.1144/gsjgs.127.5.0501
Monteiller, V. (2005). Tomographie à l'aide de décalages temporels d'ondes sismiques P: développements méthodologiques et applications. archive HAL.
Pascal, G., Isacks, B., Barazangi, M., & Dubois, J. (1978). Precise relocations of earthquakes and seismotectonics of the New Hebrides Island Arc. Journal of Geophysical Research, 83(B10), 4957–4973. https://doi.org/10.1029/JB083iB10p04957
Peacock, S. (1993). The importance of blueschist‐> eclogite dehydration reactions in subducting oceanic crust. Geological Society of America Bulletin, 105(5), 684–694. https://doi.org/10.1130/0016‐7606(1993)105<0684:TIOBED>2.3.CO;2
Pelletier, B., Meschede, M., Chabernaud, T., Roperch, P., & Xixi, Z. (1994). Tectonics of the Central New Hebrides Arc, North Aoba Basin. Proceedings of the Ocean Drilling Program, Scientic Results, 134, 431–444.
Pontoise, B., & Tiffin, D. (1986). Seismic refraction results over the d'Entrecasteaux zone west of the New Hebrides arc. Géodynamique, 1(53), 109–120.
Prevot, R., Roecker, S. W., Isacks, B. L., & Chatelain, J. L. (1991). Mapping of low P wave velocity structures in the subducting plate of the central New Hebrides, southwest Pacific. Journal of Geophysical Research, Solid Earth, 96(B12), 19,825–19,842. https://doi.org/10.1029/ 91JB01837
Quinn, T. M., Taylor, F. W., & Halliday, N. (1994). 6. Strontium‐isotopic dating of neritic carbonates at Bougainville guyot (site 831), New Hebrides island arc. Proceeding of the Ocean Drilling Program, Scientific Results, 134, 89–95.
Ranero, C., Villaseor, A., Morgan, J., & Weinrebe, W. (2005). Relationship between bend‐faulting at trenches and intermediate‐depth seismicity. Geochemistry, Geophysics, Geosystems, 6, Q12002. https://doi.org/10.1029/2005GC000997
Reyners, M., Eberhart‐Phillips, D., & Stuart, G. (1999). A three‐dimensional image of shallow subduction: Crustal structure of the Raukumara Peninsula, New Zealand. Geophysical Journal International, 137(3), 873–890. https://doi.org/10.1046/j.1365‐ 246x.1999.00842.x
Robinson, G. P. (1969). Geology of north Santo, New Hebrides Geological Survey Regional Report (p. 77).
Taylor, F., Isacks, B., Jouannic, C., Bloom, A., & Dubois, J. (1980). Coseismic and Quaternary vertical tectonic movements, Santo and Malekula Islands, New Hebrides Arc. Journal of Geophysical Research, 85(B10), 5367–5381. https://doi.org/10.1029/JB085iB10p05367 Taylor, F., & Quinn, T. (1994). Quaternary plate convergence rates at the New Hebrides island arc from the chronostratigraphy of
Bougainville Guyot (site 831). Proceeding of the Ocean Drilling Program, Scientific Results, 134, 47–57.
Taylor, F. W. (1995). Geodetic measurements of convergence at the New Hebrides island arc indicate arc fragmentation caused by an impinging aseismic ridge. Geology, 23(11), 1011–1014. https://doi.org/10.1130/0091‐7613(1995)023<1011:GMOCAT>2.3.CO;2
Taylor, F. W., Edwards, R. L., Wasserborg, G. J., & Frohlich, C. (1990). Seismic recurrence intervals and timing of aseismic subduction inferred from emerged corals and reefs of the central Vanuatu (New Hebrides) Frontal Arc. Journal of Geophysical Research, 95(B1), 393. https://doi.org/10.1029/JB095iB01p00393
Taylor, F. W., Frolich, C., Lecolle, J., & Strecker, M. (1987). Analysis of partially emerged corals and reef terraces in the central Vanuatu Arc: Comparison of contemporary coseismic and nonseismic with quaternary vertical movements. Journal of Geophysical Research, 92(B6), 4905. https://doi.org/10.1029/JB092iB06p04905
Taylor, F. W., Mann, P., Bevis, M. G., Edwards, R. L., Cheng, H., Cutler, K., & Recy, J. (2005). Rapid forearc uplift and subsidence caused by impinging bathymetric features: Examples from the New Hebrides and Solomon arcs. Tectonics, 24, TC6005. https://doi.org/10.1029/ 2004tc001650
Theunissen, T., Lallemand, S., Font, Y., Gautier, S., Lee, C., Liang, W., & Berthet, T. (2012). Crustal deformation at the southernmost part of the Ryukyu subduction (East Taiwan) as revealed by new marine seismic experiments. Tectonophysics, 578, 10–30. https://doi.org/ 10.1016/j.tecto.2012.04.011
Van der Sluis, A., & Van der Vorst, H. A. (1987). In G. Nolet (Ed.), Numerical solution of large, sparse linear algebraic systems arising from tomographic problems Seismic To. Dordrecht: Springer Netherlands.
White, R. S., McKenzie, D., & O'Nions, R. K. (1992). Oceanic crustal thickness from seismic measurements and rare earth element inver-sions. Journal of Geophysical Research, 97(B13), 19,683–19,715.
Yan, C. Y., & Kroenke, L. W. (1993). A plate tectonic reconstruction of the southwest‐Pacific, 0–100 Ma. Oceanic Drilling Program, Scientific Results, 130, 697–709.
Zelt, C. A., & Barton, P. J. (1998). Three‐dimensional seismic refraction tomography: A comparison of two methods applied to data from the Faeroe Basin. Journal of Geophysical Research, Solid Earth, 103(B4), 7187–7210. https://doi.org/10.1029/97JB03536
Zhao, D., Huang, Z., Umino, N., & Hasegawa, A. (2011). Structural heterogeneity in the megathrust zone and mechanism of the 2011 Tohoku‐oki earthquake (Mw9.0). Geophysical Research Letters, 38, L17308. https://doi.org/10.1029/2011gl048408
Zhou, H. (1990). Mapping of P‐wave slab anomalies beneath the Tonga, Kermadec and New Hebrides arcs. Physics of the Earth and Planetary Interiors, 61(3–4), 199–229. https://doi.org/10.1016/0031‐9201(90)90106‐8