HAL Id: hal-02360341
https://hal.archives-ouvertes.fr/hal-02360341
Submitted on 14 Feb 2020HAL is a multi-disciplinary open access archive for the deposit and dissemination of sci-entific research documents, whether they are pub-lished or not. The documents may come from teaching and research institutions in France or abroad, or from public or private research centers.
L’archive ouverte pluridisciplinaire HAL, est destinée au dépôt et à la diffusion de documents scientifiques de niveau recherche, publiés ou non, émanant des établissements d’enseignement et de recherche français ou étrangers, des laboratoires publics ou privés.
Single crystal growth, crystal structure and surface
characterisation of the binary phase Al45Cr7.
Pascal Boulet, Marie-Cécile de Weerd, Emilie Gaudry, Julian Ledieu, Vincent
Fournée
To cite this version:
Pascal Boulet, Marie-Cécile de Weerd, Emilie Gaudry, Julian Ledieu, Vincent Fournée. Single crystal growth, crystal structure and surface characterisation of the binary phase Al45Cr7.. IOP Conference Series: Materials Science and Engineering, IOP Publishing, 2020, Journal of Physics: Conference Series, 1458, pp.012016. �10.1088/1742-6596/1458/1/012016�. �hal-02360341�
14th International Conference on Quasicrystals
Journal of Physics: Conference Series 1458 (2020) 012016
IOP Publishing doi:10.1088/1742-6596/1458/1/012016
Single crystal growth, crystal structure and surface
characterisation of the binary phase Al
45Cr
7P Boulet1, M C de Weerd1, E Gaudry1, J Ledieu1, V Fournée1
1 Institut Jean Lamour, UMR 7198 Université de Lorraine- CNRS, Nancy, France
Email : [email protected]
Abstract. A single crystal of the Al45Cr7 crystalline approximant has been grown using the
Czochralski method. The structure of this phase has been resolved in the C2/m space group. Chromium atoms are systematically surrounded by Al atoms forming a distorted icosahedron. The icosahedra are linked either by a vertex or a triangular face or overlap along a five-fold axis. The (010) surface of this single crystal has been investigated under ultrahigh vacuum and shows a (1x1) termination at specific bulk planes. The terraces have a nanostructured appearance which is ascribed to the preservation of the CrAl12 clusters at the surface. Ab initio calculations shows
the presence of a deep pseudogap at the Fermi level, due to both a Hume-Rothery effect combined with strong spd hybridization. The isoelectronic charge densities highlight the fact that the charges are mainly confined within the CrAl12 icosahedron providing support to a certain
stability of the clusters which could explain the nanostructured surface morphology encountered. First results on Al thin film deposition on the (010) surface are also reported.
1. Introduction
The Al-Cr binary phase diagram has been investigated by many authors, especially the Al-rich part [1-2]. At least three different phases (Al45Cr7, Al11Cr2 and Al4Cr) which form peritectically have similar
and complex structures, in which atoms are icosahedrally coordinated. They are frequently referred to as “approximant” crystals, in relation with the existence of a metastable icosahedral phase i-Al4Cr [3].
This region of the phase diagram is also of interest for the aluminium industry. It is known that small amounts of Cr added to commercial Al alloys prevent recrystallization and grain growth. Recently [4], the addition of a minute amount of Cr to the Al-20wt% Zn melt has been shown to drastically affect the microstructure through grain refinement. It is suspected that the nucleation of the primary Al phase is assisted through the formation of a transient icosahedral quasicrystals or Al45Cr7 approximant phases in
the undercooled liquid at the nanoscale. This assisted nucleation mechanism could explain the high density of grain boundaries observed in twin relationship associated by groups of 5 grains. It could thus be interesting to investigate the interface between such quasicrystal or approximant phase and fcc Al. Here we report the successful growth of an Al45Cr7 single crystal, its structure determination, the first
results on the (010) surface structure and on Al thin film grown on that surface. The electronic structure of this compound is further studied by density functional theory (DFT) calculations.
2. Experimental and calculation details 2.1. Sample preparation
According to the most recent phase diagram, the Al45Cr7 phase can be obtained through peritectic
14th International Conference on Quasicrystals
Journal of Physics: Conference Series 1458 (2020) 012016
IOP Publishing doi:10.1088/1742-6596/1458/1/012016
2
comprised between 660 and 799 °C [1-2]. An ingot of the desired composition was first prepared by induction melting under an Ar atmosphere. The ingot was then placed in an alumina crucible in a Czochralski furnace, initially evacuated to a pressure of 10−6 mbar and back-filled with 1 bar Ar (5.0
grade). An alumina tip was brought into contact with the liquid solution and then pulled at a rate of 0.5 mm/h. Such a slow pulling rate was selected due to the large difference between the composition of the liquid and that of the Al45Cr7 phase. The obtained sample had a distorted rod shape with a diameter of
about 8 mm and was about 7 cm long. It consisted in a single crystal in almost the entire volume, but with many Al inclusions. The crystal was oriented by X-ray Laue diffraction and a sample extracted to expose a (010) surface (Fig. 1(a)). Two other small grains with a different orientation were detected at the periphery of the sample, as well as several Al inclusions appearing as black lines and dots on Fig. 1(a). The surface was polished to obtain a mirror appearance. The sample was then mounted on a Ta plate for surface investigations.
2.2. Experimental methods
The single crystal XRD data were collected on a Bruker Kappa Apex II diffractometer equipped with a mirror monochromator and a Mo K IµS ( = 0.71073 Å). The Apex2 program package was used for the cell refinements and data reductions. The structure was solved using direct methods and refined with the SHELXL-2014 programs. Semi-empirical absorption correction (SADABS) was applied to the data. The surface of the single crystal was investigated using a multi-technique ultra-high vacuum (UHV) system equipped with low-energy electron diffraction (LEED) and scanning tunnelling microscopy (STM). Once inserted in the UHV chamber, a clean surface was prepared by cycles of sputtering (Ar+, 1.5 kV, 30 min) and annealing up to 600 °C for 1-2 hours. An optical pyrometer with an emissivity set to 0.35 was used to measure the temperature. Aluminium thin films were deposited using a cold lip source (purity 5N). The deposition rate was set to 0.05 ML.s-1.
2.3. Computational details
DFT calculations were performed using the Vienna ab initio simulation package (VASP) [5]. The interaction between the valence electrons and the ionic core was described using the projector-augmented wave (PAW) method [6] within the generalized gradient approximation (GGA-PBE) [7], considering the valences for the atoms to be 3s2 3p1 (Al), 3p6 3d5 4s1(Cr), and using E
cut = 450 eV
cut-off energy and 224 irreducible k-points. Total energies were minimized until the energy differences become less than 10-5 eV between two electronic cycles during the structural optimization. Atomic
structure was relaxed till the Hellmann-Feynman forces were as low as 0.02 eV. 3. Results and discussion
3.1. Structure determination
A small crystal was isolated for XRD experiments. The crystallographic data obtained are summarized in Table 1. This compound crystallizes with a centered monoclinic unit cell [8]. The lattice parameters are a = 2.0650(2) nm, b = 0.75978(8) nm, c = 1.0967(1) nm and = 107.308(2)°, close to those reported He et al. [9], the small differences probably being due to small compositional changes. The crystal structure has been successfully refined in the space group C2/m. The positions of all independent atomic position have been found using direct methods, with three independent Cr positions in 2d, 4i and 8j and 16 Al positions (one in 2a, eight in 4i and seven in general position 8j). A series of refinements with the positional and anisotropic thermal parameters converged to the agreement factors R1 = 3.04% and wR2 = 7.28%. All sites have full occupancies as shown in Table 1, and further difference Fourier calculations did not reveal any significant residual electron density peaks. The largest peak in the final difference electron density synthesis was 0.852 e/Å3 and the largest hole was -0.992 e/Å3 with a root mean square
(RMS) deviation of 0.192 e/Å3. The positional parameters are listed in Table 2. As shown in Fig. 1(b),
all Cr atoms are surrounded by distorted Al icosahedra. The three Cr atomic sites correspond to 3 different polyhedra: red icosahedron (Cr in 2d) are isolated and share only Al atoms with orange
14th International Conference on Quasicrystals
Journal of Physics: Conference Series 1458 (2020) 012016
IOP Publishing doi:10.1088/1742-6596/1458/1/012016
polyhedron, green polyhedron (Cr in 4i) share triangular faces with orange icosahedra and the latest (Cr in 8j) are interpenetrating each other sharing pentagon or triangle faces with other Cr (8j) polyhedron.
Figure 1: (a) Picture of the (010) oriented sample (~8x5 mm2). (b) Structure model of the Al
45Cr7 phase viewed
perpendicularly to the [010] direction and showing the various CrAl12 icosahedral polyhedra. Al atoms are in blue,
Cr atoms are in red at the centres of the clusters.
Table 1: Crystallographic data, data collection and structure refinement parameters.
Chemical Formulae Al
45Cr7
Molecular Weight ; Crystal dimensions 1578.10g ; 0.01x0.07x0.07 mm3
Wavelength 0.71073 Å
Space Group C2/m(12)
Unit Cell dimensions
(The second column indicates the lattices parameters obtained by VASP)
a=20.650(2) Å b=7.5978(8) Å c=10.9674(11) Å b=107.308(2)° V = 1642.8(3)Å3 a=20.59 Å b=7.56 Å c=10.92 Å b=107.35° V = 1622.4 Å3 Z 2
Density / Absorption Coefficient 3.190g/cm3 / 3.453 mm-1
Angular Domain 1.95 à 36.93°(0.59 Å resolution)
-29<h<29, -12<k<12, -17<l<17 Reflections observed/Independantes/I>2s 4255/4255/3598
Rint 0.0808
Absorption Correction SADABSV2012/1 multiscan
Structure solution program Direct method SHELXL-2014/7(Sheldrick, 2014)
Goodness of fit on F2 1.023
Number of parameters 136
R1/wR2(observed- I>2s) 0.0304/0.0672
R1/wR2(all) 0.0407/0.0728
max, max(eÅ
14th International Conference on Quasicrystals
Journal of Physics: Conference Series 1458 (2020) 012016
IOP Publishing doi:10.1088/1742-6596/1458/1/012016
4
Table 2: Experimental (calculated in italic) atomic coordinates and isotropic displacement parameters.
Atom Wyckoff position
Occupation factors
x/a y/b z/c Ueq(Å2
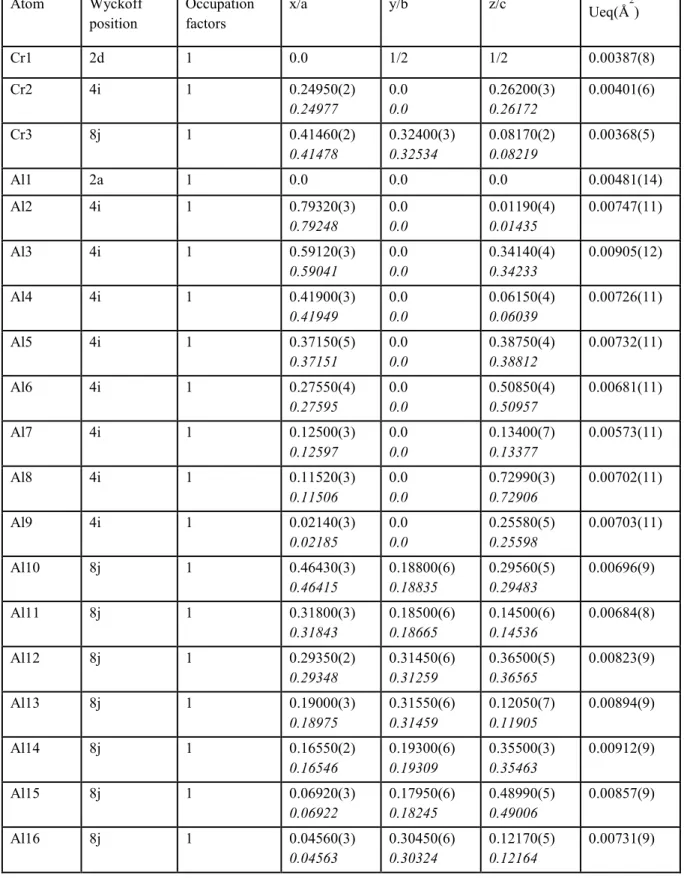
) Cr1 2d 1 0.0 1/2 1/2 0.00387(8) Cr2 4i 1 0.24950(2) 0.24977 0.0 0.0 0.26200(3) 0.26172 0.00401(6) Cr3 8j 1 0.41460(2) 0.41478 0.32400(3) 0.32534 0.08170(2) 0.08219 0.00368(5) Al1 2a 1 0.0 0.0 0.0 0.00481(14) Al2 4i 1 0.79320(3) 0.79248 0.0 0.0 0.01190(4) 0.01435 0.00747(11) Al3 4i 1 0.59120(3) 0.59041 0.0 0.0 0.34140(4) 0.34233 0.00905(12) Al4 4i 1 0.41900(3) 0.41949 0.0 0.0 0.06150(4) 0.06039 0.00726(11) Al5 4i 1 0.37150(5) 0.37151 0.0 0.0 0.38750(4) 0.38812 0.00732(11) Al6 4i 1 0.27550(4) 0.27595 0.0 0.0 0.50850(4) 0.50957 0.00681(11) Al7 4i 1 0.12500(3) 0.12597 0.0 0.0 0.13400(7) 0.13377 0.00573(11) Al8 4i 1 0.11520(3) 0.11506 0.0 0.0 0.72990(3) 0.72906 0.00702(11) Al9 4i 1 0.02140(3) 0.02185 0.0 0.0 0.25580(5) 0.25598 0.00703(11) Al10 8j 1 0.46430(3) 0.46415 0.18800(6) 0.18835 0.29560(5) 0.29483 0.00696(9) Al11 8j 1 0.31800(3) 0.31843 0.18500(6) 0.18665 0.14500(6) 0.14536 0.00684(8) Al12 8j 1 0.29350(2) 0.29348 0.31450(6) 0.31259 0.36500(5) 0.36565 0.00823(9) Al13 8j 1 0.19000(3) 0.18975 0.31550(6) 0.31459 0.12050(7) 0.11905 0.00894(9) Al14 8j 1 0.16550(2) 0.16546 0.19300(6) 0.19309 0.35500(3) 0.35463 0.00912(9) Al15 8j 1 0.06920(3) 0.06922 0.17950(6) 0.18245 0.48990(5) 0.49006 0.00857(9) Al16 8j 1 0.04560(3) 0.04563 0.30450(6) 0.30324 0.12170(5) 0.12164 0.00731(9)
14th International Conference on Quasicrystals
Journal of Physics: Conference Series 1458 (2020) 012016
IOP Publishing doi:10.1088/1742-6596/1458/1/012016
3.2. Surface characterization
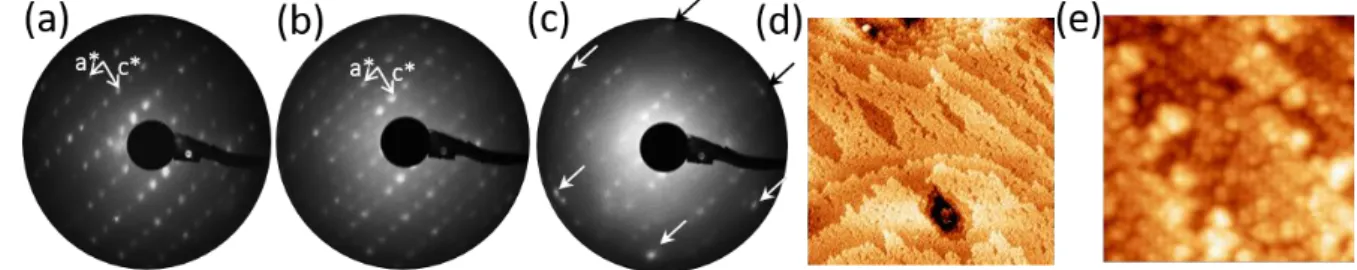
The LEED patterns of the (010) surface show sharp spots corresponding to a (1x1) termination (Fig. 2(a)), with a surface unit cell corresponding to a bulk truncation. No significant changes are observed when the annealing temperature is increased from 500 to 600 °C. STM images of the surface show a terrace and step morphology, with a unique step height of 0.38 nm ~ b/2. The terraces are relatively small and exhibit frequent holes whose depth is equal to the step height (Fig. 2(d)). Images of individual terraces reveal a nano-clustered surface structure, with a roughness on the order of 0.1 to 0.2 nm. This intrinsic roughness may be due to the existence of CrAl12 icosahedra present in the bulk, which may be
preserved at the surface. Nevertheless, the fast-Fourier transform of these images still show sharp spots consistent with a surface unit cell parameters a = 2.1±0.1 nm, b = 1.0±0.1 nm and = 107°±2°.
Figure 2: (a) (1x1) LEED pattern of the clean surface (36 eV); (b) c(2x2) pattern obtained after dosing 0.5 ML of Al (36 eV); (c) after dosing 5 ML of Al. Red arrows indicate the Al(111) spots which are nearly in coincidence with some substrates spots. (d) STM image of the clean surface (300x300 nm2). (e) (25x25 nm2) is a closer view
on the nanostructured surface.
When Al is deposited on this surface at room temperature, it first leads to a c(2x2) surface reconstruction at low coverages (from 0.5 to 1 ML) as observed by LEED (Fig. 2(b)). The surface becomes flatter with atomic rows now becoming clearly visible. With increasing Al coverages (5 to 10 ML), the Al thin film grows with the (111) orientation parallel to the surface plane as evidenced by LEED ([010]Al45Cr7//[111]Al-fcc) (Fig. 2(c)). A single rotational domain is deduced from the LEED,
corresponding to near-coincidence of the primary Al spots with (4,3), (-3,4), (-8,1), (-4,-3), (8,-1), (3,-4) spots of the Al45Cr7(010) surface.
3.3. Electronic structure
The structural relaxation has been performed based on the experimentally derived structure model. The calculated lattice parameters (a = 2.059 nm, b = 0.756 nm, c = 1.092 nm and = 107.35°) and the atomic positions are in good agreement with the experimental ones, with a relative error smaller than 0.5% (Table S2). The partial and total density of states (DOS) are shown in Fig. 3(a). It shows a marked sp character in the [-11,-4] eV region, which arises essentially from Al atoms. Cr d states lie mostly in the [-3,3] eV region. The partial DOS shows spd hybridization in agreement with the shape of the electron density isosurface (Fig. 3b) showing a non uniform charge density distribution between Al and Cr atoms. A marked pseudo-gap is found at the Fermi energy, a feature frequently observed in Al-based quasicrystal and related approximants. The Fermi wave vector can be estimated in a free electron approximation using the values of the valence electron per atom proposed by Mizutani [10]. It leads to 2kF=33.46 nm-1, slightly larger than the magnitude of Khkl reciprocal vectors corresponding to the
strongest diffraction peaks, taking values between 28 and 30 nm-1. However, there are diffraction peaks
with weaker intensities satisfying the Hume-Rothery criterion 2kF~ Khkl. Al and Cr atoms also have
small differences in atomic radii and electronegativity (less than 10%), hence the Al45Cr7 system can be
assumed to fulfill the Hume-Rothery electronic stabilization criteria. Therefore the origin of the pseudogap is probably due to both a Hume-Rothery mechanism coupled with a strong spd hybridization. The strong spd hybridization between Al and Cr support the idea of a certain stability associated to the
14th International Conference on Quasicrystals
Journal of Physics: Conference Series 1458 (2020) 012016
IOP Publishing doi:10.1088/1742-6596/1458/1/012016
6
CrAl12 icosahedra surrounding each Cr atoms, which could explain the nanostructured surface
morphology encountered.
Figure 3: (a) Calculated DOS for the Al45Cr7 compound. (b) Electronic isodensity plotted at 0.037 e/Å3. The c axis
is perpendicular to the image plane. 4. Conclusions
We have reported the growth of an Al45Cr7 approximant single grain. The structure has been solved by
single crystal XRD. Its (010) surface has been investigated and shows a (1x1) terminated surface at specific bulk planes. The terraces have a nanostructured appearance, ascribed to the preservation of the CrAl12 clusters at the surface. DFT calculations show the presence of a deep pseudogap at the Fermi
level, due to a Hume-Rothery effect and strong spd hybridization. Charge density map indicates a non uniform charge density distribution around Cr atoms. Combined with the spd hybridization, it suggests a certain stability of the CrAl12 clusters which could explain the nanostructured surface morphology. An
Al thin film deposited on the (010) surface leads to the formation of an fcc Al film with (111) orientation. Future objectives would be to precisely determine the orientation relationships between the bulk icosahedral clusters and the fcc Al grains.
Acknowledgement
We would like to dedicate this article to the memory of our friends Dr. Esther Belin-Ferré and Prof. An-Pang Tsai who recently passed away.
References
[1] Mahdouk K and Gachon J-C 2000 Journal of Phase Equilibria 21 157
[2] Grushko B, Przepiorzynski B and Pavlyuchkov D 2008 J. Alloys and Comp. 454 214 [3] Audier M, Durand-Charre D, Laclau E and Klein H 1995 J. Alloys and Comp. 220 225 [4] Kurtuldu G, Jarry P and Rappaz M 2013 Acta Materialia 61 7098
[5] Kresse G and Hafner J 1993 Phys. Rev. B 47 558 [6] Kresse G and Joubert D 1999 Phys. Rev. B 59 1758
[7] Perdew J-P, Burke K and Ernzerhof M 1997 Phys. Rev. Lett. 78 1396 [8] Cooper M J 1960 Acta Cryst. 13 257
[9] He ZB, Zou BS and Kuo KH 2006 Journal of alloys and compounds 417 L4-L8 [10] Mizutani U and Sato H 2017 Crystal 7 9