HAL Id: hal-00984777
https://hal-paris1.archives-ouvertes.fr/hal-00984777
Preprint submitted on 28 Apr 2014
HAL is a multi-disciplinary open access archive for the deposit and dissemination of sci-entific research documents, whether they are pub-lished or not. The documents may come from
L’archive ouverte pluridisciplinaire HAL, est destinée au dépôt et à la diffusion de documents scientifiques de niveau recherche, publiés ou non, émanant des établissements d’enseignement et de
Detecting Performance Persistence of Hedge Funds : A
Runs-Based Analysis
Rania Hentati-Kaffel, Philippe de Peretti
To cite this version:
Rania Hentati-Kaffel, Philippe de Peretti. Detecting Performance Persistence of Hedge Funds : A Runs-Based Analysis. 2014. �hal-00984777�
Detecting Performance Persistence of Hedge
Funds : A Runs-Based Analysis
Rania Hentati-Ka¤el
Centre d’Economie de la Sorbonne, Université Paris1 Panthéon-Sorbonne
Philippe de Peretti
yCentre d’Economie de la Sorbonne, Université Paris1 Panthéon-Sorbonne
April 28, 2014
Abstract
In this paper, we use nonparametric runs-based tests to analyze the randomness of returns and the persistence of relative returns of hedge funds. Runs tests are implemented on a universe of hedge ex-tracted from HFR database over the period spanning January 2000 to December 2012. Our …ndings suggest that i) For about 80% of the
Contact author. Centre d’Economie de la Sorbonne, Université Paris1 Panthéon-Sorbonne, Maison des Sciences Economiques, 106-112 Boulevard de l’Hôpital 75013 Paris, France. Phone: 00 33 1 44 07 87 45, Email: rania.ka¤[email protected]
yCentre d’Economie de la Sorbonne, Université Paris1 Panthéon-Sorbonne, Maison des
Sciences Economiques, 106-112 Boulevard de l’Hôpital 75013 Paris, France. Phone: 00 33 1 44 07 87 46, Email: [email protected]
funds, we fail to reject the null of randomness of returns, ii) A similar …gure is found out when focusing on relative returns, iii) Hedge funds that do present clustering in their relative returns are mainly found within Event Driven and Relative Value strategies, iv) For relative re-turns, results vary with the benchmark nature (hedge or traditional). The paper also emphasizes that runs tests may be a useful tool for investors in their fund’s selection process.
Keywords: Hedge Funds ; Runs Tests ; Persistence ; Clustering JEL classi…cation: G1 ; G110 ; C1
1
Introduction
The hedge funds industry has long been, naively, seen as being able to gen-erate “all weather” positive returns, no matter what the market conditions were. Nevertheless, the recent …nancial crisis has cast some doubts on this opinion, leading investors to question whether this industry was signi…cantly able to over-perform the traditional management (Gupta et al., 2003). The question of over-performances, or equivalently of the persistence of relative returns, is of key importance for investors. Indeed, assessing persistence is a milestone in the decision making process. For instance, one of the main strategies used by investors, e.g. funds of hedge funds strategy, to pick-up top hedge funds, relies on realized relative returns (versus HFR represen-tative strategy index or traditional indices) momentum. Thus, selecting a hedge fund for its ability to signi…cantly over-perform the market during large periods may be a very useful tool.
method-ologies1 as the Cross-Product Ratio (CPR) (DeSouza and Gokcan, 2004),
Chi-square tests (Carpenter and Lynch, 1999), regression models (Fama-MacBeth, 1973; Agarwal and Naik, 2000a), or the test of Hurst (Amenc et al., 2003; De Souza and Gokcan, 2004; Edwards et al., 2001; Eling, 2008). Clearly, three conclusions are to be drawn: i) Results vary with both the database (TASS, HFR, Tremont, ...) and the methods ii) Most studies agree to …nd a persistence for a one to a six-month horizon (short-term) (Barès et al., 2003; Boyson and Cooper, 2004; Brorsen and Harri, 2004; Herzberg and Mozes, 2003), but results are contradictory for longer periods, iii) There is no agreement whether the persistence is related to the nature of the strategy of the hedge fund.
The goal of this paper is to re-examine the questions of persistence ,and randomness of returns for a given hedge fund …rstly in absolute term and then relatively to a set of indices. For both analyses, we use the HFR data base, with a universe spanning more than 4000 hedge over the period spanning January 2000 to December 2012. Relative returns are computed using a blend of traditional and alternative indices: i) The median of the returns of funds having a common primary strategy, ii) An HFRI index computed for each primary strategy, iii) An overall index for the hedge fund market, and iv) The S&P500 index. Performances of hedge funds are thus analyzed with regard to peer groups, the whole hedge fund universe, and an external market.
To extract information about randomness and persistence, we use tests
1See also Edwards and Caglayan (2001), Harri and Brorsen (2004), Brown, Goetzmann
and Ibbotson (1999), Kat and Menexe (2003), Koh, Koh and Teo (2003), Baquero, the Hurst and Verbeek (2005), Kouwenberg (2003), Jagannathan et al.(2006).
based on runs (Wald and Wolfowitz, 1940; Mendenhall, Schea¤er, and Wack-erly, 1986; Gibbons and Chakraborti, 1992). Runs tests are very versatile and powerful tools. Used as two-sided tests, they allow to check for random-ness. Used as a one-sided test, they allow to test for randomness against a pre-speci…ed alternative: Either clustering, i.e. persistence, implying the ability for a fund to signi…cantly over (under)-perform a given market, or mixing, i.e. systematically alternating over and under performances.
Our main …ndings suggest that i) Using two-sided tests, about 80% of the studied universe has returns at random, ii) A similar outcome is obtained when relative returns are used, iii) Hedge fund strategies displaying the highest percentage of funds generating clusters are Event-Driven and Relative Value, emphasizing the link between the strategy and the persistence, iv) For the relative returns, results deeply vary with the benchmark.
This paper is organized as follows. In Section 2, we details how our series are computed, and introduce runs-based tests. An empirical application is also presented. In Section 3, we implement the tests on the HFR database, and present results in contingency tables crossing the results on runs tests with strategies. On Section 4, we split our sample into two sub-samples, before and after the 2007 crisis, and re-run the tests. Finally Section 5 discusses our main results and concludes.
2
Runs-based tests
Let fritjgT
t=1, be an observed track record of T observations of returns for fund
Hedge, j = 2 to Event-Driven, j = 3 to Macro, and j = 4 to Relative Value. Now, de…ne fdjitgTt=1 j 2 (1; 4) as follows:
djit = 8 < : 1 if ritj bjit; 0 otherwise. (1)
where bjit is either de…ned as:
bjit= bji = median (rji1; ri2j ; :::; rjiT)0; j 2 (1; 4): (2) or: bjit = b j t = median (r j it; r j kt; :::; r j lt)0; j 2 (1; 4); t = 1; :::; T: (3) bjit = b j t = HF RI j t; j 2 (1; 4); t = 1; :::; T: (4) bjit = bt= HF RGIt; t = 1; :::; T: (5) bjit = bt= SP 500t; t = 1; :::; T: (6) where: ritj; r j jt; :::; r j
lt are the returns of funds having a common main strategy j;
HF RItj is a performance index corresponding to the primary strategy j,
HF RGIt is the HFRI global performance index at time t, t = 1; :::; T:
SP 500t is the S&P500 index at time t; t = 1; :::; T:;
Remark 1 De…nition (2) allows us to analyze the randomness of the series, whereas de…nitions of bitj given by (3) to (6) return an information about the relative performance of the fund, i.e. the possible persistence of the returns with regard to a benchmark, indicated by large clusters of 1’s or 0’s. Using (3)
to compute bitj returns a straightforward information about the location of the return of the fund i in the distribution of the returns of a main strategy,.i.e. if the returns are located in the right (left) tail of the distribution during large periods of times, or is randomly distributed on the right or left tail.
Remark 2 In our opinion, the de…nition of a skilled manager should em-phasize its ability to outperform its peers (representative HFRI hedge index), as well as the overall sample (HFRI Global Hedge index). Comparing perfor-mance to the overall sample attenuates the selection bias e¤ects (Databases have their own classi…cation criteria which could di¤er from one provider to another).Thus, the second and third benchmarks, (3) and (4) are used to study how a fund performs compared to its peers (funds classi…ed in the same class), whereas the fourth, (5), is used to study the relative performance of the fund with regard to whole hedge fund sample. The last benchmark, (6), is used as an external reference, to see if funds are able to outperform traditional market (equity in our case).
We next use runs-based tests to analyze the information returned by the djits. De…ne a run of one kind of element, say of 10s; as a successions of 10
s immediately preceded or followed by at least one 0, or nothing. Let T1 be the
number of 10s and T
0 be the 00s with T1+ T0 = T , and let r1j be the number
of runs of 10s of length j and r
0j be the number of runs of 00s of length j:
Let r1 = P
j
r1j be the total number of runs of 10s, and r0 =P j
r0j the total
number of runs of 00s. At last let r = r
1+ r0 be the total number of runs of
both kinds. For instance assuming that fditg14t=1 takes the following values:
we have r11 = 4; r01 = 2; r12 = 0; r02 = 1; r13 = 1; r03 = 1; r1 = 5; r0 = 4 and
r = 9.
Testing for randomness amounts to testing if we have either too few runs or two many runs by using a two-sided test, whereas testing for the null of randomness against the alternative of clustering i.e. persistence, amounts to using a one-sided test (focusing on the left tail of the distribution), testing for too low values of r1 (or r).
Following Gibbons and Chakraborti (1992), exact and approx-imate distributions can be used to test for the null. Concerning the former, using combinatorial, the marginal (exact) distribution function of r1 is given by:
P (r1) = T1 1 r1 1 T0+1 r0 T T1 (7) where T1 1 r1 1 is a binomial coe¢cient.
Similarly, the (exact) distribution function of r is given by:
P (r) = 8 > > < > > : 2( T1 1 1 2r 1)( T 0 1 1 2r 1) (T T1) if r is even, (T1 1 1 2r 12)( T0 1 1 2r 32) (T T1) +( T1 1 1 2r 32)( T0 1 1 2r 12) (T T1) if r is odd. (8)
Among many other, Gibbons and Chakraborti (1992) provide
tab-ulations for small values of T0 and T1, i.e. for T0 T1 12, such
that (7) and (8) can be used to build one or two-sided tests. For ‘large’ values of T1 and T0, i.e. for T0 > 12 and T1 > 12 a
and r as: E[r1] = T1(T0+ 1) T (9) V [r1] = (T0+ 1)[2](T1)[2] T (T )[2] (10) where x[a] = x(x 1)(x 2):::(x a + 1);
E[r] = E[r1] + E[r0] =
2T1T0
T + 1 (11)
V [r] = V [r1] + V [r0] + 2cov[r1; r0] =
2T1T0(2T1T0 T )
T2(T 1) (12)
Then, using a continuity correction, the corresponding Z-stats are de…ned as: Zr1 = r1+ 0:5 T1(T0+ 1)T 1 q (T0+1)[2](T1)[2] T(T )[2] (13) and: Zr= r + 0:5 2T1T0T 1 1 q 2T1T2(2T1T0 T) T2(T 1) (14)
Thus, for a one-sided test of clustering (r E(r) and/or r1 E(r1)) one
is thus to compare (13) and (14) to a standard normal deviate at .
Sim-ilarly, if one suspects the series to have a tendency to mix, i.e. having too many runs, the right-tail of the standard normal must be considered and the corresponding statistics are given by:
Zr1 = r1 0:5 T1(T0+ 1)T 1 q (T0+1)[2](T1)[2] T(T )[2] (15)
and: Zr = r 0:5 2T1T0T 1 1 q 2T1T2(2T1T0 T) T2(T 1) (16)
Two-tailed tests are a combination of the above statistics with =2 as thresh-old.
In this paper, for T 100, we re-tabulate (7) and (8), and build
signi…cance tests on exact probabilities. For T > 100, we base our tests on the normal approximation. Note, that on simulations we performed, the normal approximation appeared to be quite
accu-rate for T 25 (see also the three …lters we apply, in the next
section).
To pick up an exemple, consider three funds (fund #1, fund #2 and fund #3), all having an Equity Hedge strategy, with relative monthly performance d1; d2 and d3 computed using (4). Figure (??) plots the returns of the three funds together with the corresponding HFRI Equity Hedge index. A visual inspection reveals that fund #1 has too many runs, and alternates, too often, successes and failures. This is indicative of a tendency to mix. Conversely, fund #2 has a tendency to produce clusters of both successes and failures, especially after the end of 2007. Turning to statistical analysis, for fund #1, we have r11 = 17, r12 = 7, r13 = 1 and r15 = 1, r01 = 15, r02 = 7,
r03 = 3, r04 = 1 and therefore r1 = 26 and r0 = 26 and r = 52. Since
E[r1] = 20:74 and E[r] = 41:44, we have too many runs of lengths 1 and 2 of
10s. This suggests that the arrangements of the 10s and of the 00s are not at
random. The (exact) one-sided statistics (right-tail) are P (r 52) = 0:0119
respectively 0:0121 and 0:0177 . This leads to reject the null, concluding
to a tendency to mix for fund #1. Concerning fund #2, we have r11 = 5,
r12 = 4, r13 = 2; r14 = 2 and r15 = 2. For the runs of 00s we have r01 = 6,
r02 = 3, r03 = 2, r04 = 1 and r08 = 3, with r = 30 and r1 = r0 = 15. The
expected values are E[r] = 42:01 and E[r1] = 20:95 suggesting clustering,
and the associated exact (one-sided) probabilities are P (r 30) = 0:0048 and P (r1 15) = 0:0074 (corresponding asymptotic p-values are 0:005 and
0:0078). The null is therefore rejected in favor of clustering.
Turning next to the analysis of fund #3, no clear pattern appears in the graph. Turning to the runs analysis, we have r01 = 15, r02 = 6, r03 = 2,
r04 = 2 and r11 = 13, r12 = 3, r13 = 5, r14 = 1, r15 = 2, and r19 = 1 with
r0 = r1 = 25 and r = 50. With E[r] = 48:69 and E[r1] = 24:52, the exact
probabilities are P (r 50) = 0:43 and P (r1 25) = 0:48. The
correspond-ing two-sided asymptotic tests return a p-value of 0:8663 and 0:9765. Clearly the arrangements are at random. Thus the performance of this fund is not signi…cantly di¤erent from the Equity Hedge index.
3
Implementing runs-based tests
3.1
Data description: The HFR database
With the growth of the hedge fund industry, the number of publicly available hedge fund databases has increased. The main data providers are Hedge Fund Research (HFR), Managed Account Reports (MAR) and Tremont Advisory
Shareholders Services (TASS). Each one has its own biases 2, and therefore
the choice of a database is likely to have some impacts on the results. In this
study, we use monthly3 data from HFR database, over a period spanning
January 2000 to December 2012. HFR may be considered to su¤er the least from the biases mentioned below
It’s well known that database start date a¤ects its indices performance. Indeed returns calculation takes into account of only still alive (resulting in a survivorship bias). Thus anteriority of databases is key for statistics relevancy. This is the case of HFR and CISDM database (start in 1994) compared to CSFB (start in 2000). Brown, Goetzmann, and Ibbotson (1999) valued the average impact of the survivorship bias at 2.6%, compared to 3% for Fung and Hsieh (2000) and 2.43% for Liang (2001).
Obviously, the bias amplitude varies from one database to another. For example, data providers on hedge funds have their own criteria to include and exclude one fund from their databases. The more criteria come into play the higher is the bias amplitude. For illustration TASS database has a higher survivorship bias than the HFR database and a higher attrition rate, which in turn is due to di¤erent criteria for adding and removing funds. Also, the funds have selection criteria that can be very diverse, and the data provided will not be representative of the same management universe. This is referred to as “selection
bias”. For instance, HFR doesn’t cover managed futures unlike TASS
2Some authors use the databases in combination, e.g. Ackermann et al. (1999) and
Capocci et al. (2005).
3For studies estimating the impact of the di¤erent frequencies on the results, see Harri
and CISDM.
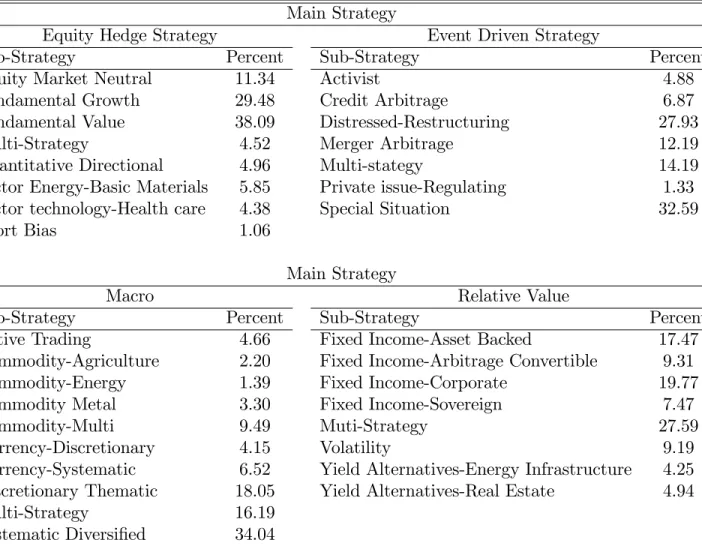
HFR may be considered to su¤er the least from the biases mentioned be-low. HFR is a leading data provider on hedge funds. It covers a higher per-centage of existing hedged funds in the industry. Information contained in the HFR database is quantitative (monthly returns, assets under management, net asset value,. . . ) or qualitative (name of the fund, primary strategy, sec-ondary strategy,. . . ). The starting fund universe is constituted of 4759 funds classi…ed within 4 primary strategies: 47.44 % in Equity Hedge, 24.79% in Global Macro, 18.28% in Relative Value and 9.47% in Event-Driven. Readers would …nd, for each primary strategy, a split by secondary strategy in Table 1.
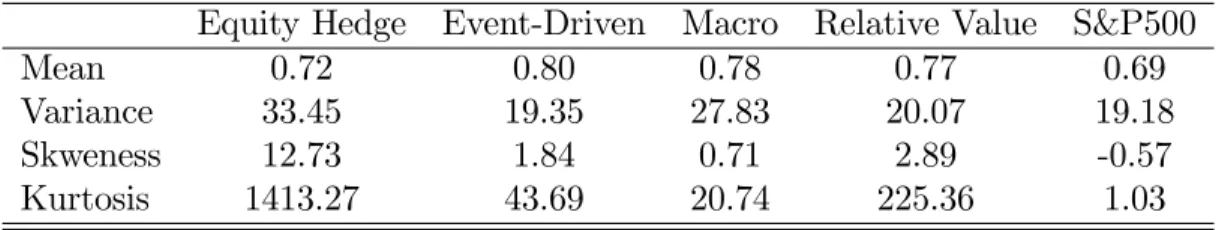
Table 2 returns summary statistics for funds having a common primary strategy. At …rst glance, it appears that mean returns are quite insensitive to the HFR classi…cation. Indeed, the four strategies delivered close average re-turn over the period. Di¤erentiation is notable only through moment greater than 1. All distributions are positively skewed with an unexpectedly high kurtosis for Equity Hedge. For a comparison purpose, summary statistics for the S&P500 index is also provided4.
Before implementing the tests, the database is …rst …ltered. In particular, three …lters are applied:
i) Track record size: We focus on hedge funds having more than 24 months
4It is well known that biases may cause the underlying indexes to be over-estimated.
Some study (e.g. Malkiel and Saha, 2005; Posthuma van der Slui, 2004), report a biais of about 4%. To analyze the robustness of the results we re-run the tests exluding the hedge with returns no di¤erent than a margin of plus/minus 4% of the indices. Conclusions are not altered. Results not reported, avalaible under request.
of track record on December 2012, i.e.T 24,
ii) Minimal number of occurrence of failures and successes: We select hedge funds with T1 > 10 and T0 > 10,
iii) Relative size : The last …lter concerns the proportion of 10s and 00s, and we apply the condition max(T1; T0)=min(T1; T0) 1:5.
The three …lters ensure a minimal number of observations, as a well a balanced number of both events, since what we search is to test for random arrangements.
Although database biases are not directly addressed in this paper, these “rules of thumb” are taken into account to limit their impacts. Also, the use of HFRI sub-strategy indices, which take account of all funds existing at one date, attenuates some biases, principally the survivorship bias.
3.2
Testing for randomness of returns
We begin by testing the randomness of the series using two-sided runs tests based on P (r) and P (r1). These runs tests return a crucial information about
the predictability of returns, and maybe about the (temporary) e¢ciency of the market. The benchmark is computed as the median of each series. For small samples (T 100) we use exact statistics based on (8) and (7), and for T > 100 asymptotic ones. Table 3 returns the results of runs tests. Results are twofold:
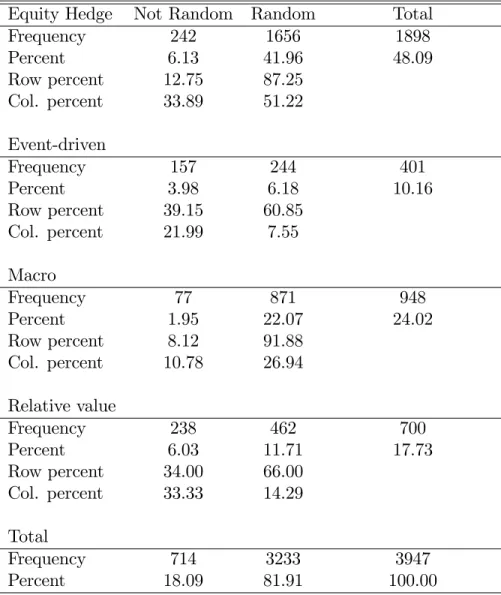
i) For about 82% of the funds, we fail to reject the null of randomness. Thus, the vast majority of funds have returns distributed at random.
ii) The row percents, returning the proportions of funds at random or not, within each primary strategy, show that the proportions of funds having non-random returns are highest for Event-Driven (39.15%) and Relative Value (34.00%).
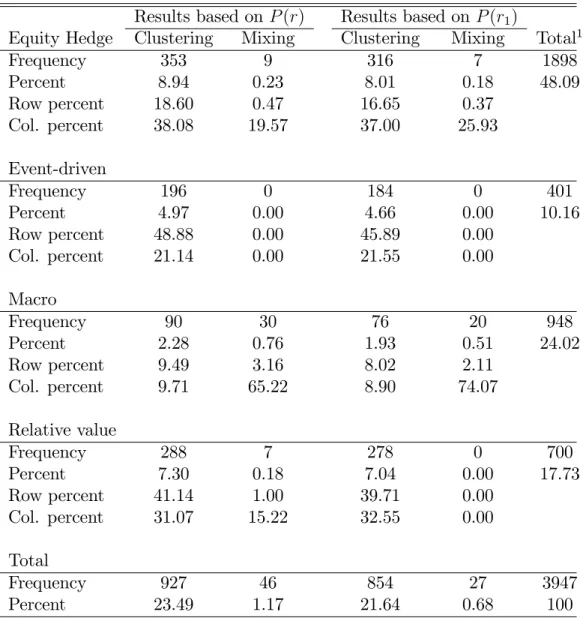
Re…ning the analysis, we also implement one-sided tests, i.e. randomness against clustering or mixing (one sided tests). Table 4 returns the results. Clearly, 48.88 % of the Event-Driven funds and 41.14% of the Relative Value have a tendency to cluster, i.e. have positive autocorrelations in their re-turns. Conversely, very few Macro funds do cluster. Finally, the percent of funds having a tendency to mix is very low. Results are in sharp con-trast with Brooks and Kat (2002) who, working only on indices found out an autocorrelation in returns (Lo and MacKinlay, 1988).
We next focus on one-sided tests of randomness, when the alternative is either clustering or mixing.
3.3
Analysing relative returns
3.3.1 Relative returns with respect to peers group
We now perform the tests on relative returns calculated either with regard to peers group, using either (3) or (4), i.e. the median of returns at time t for a primary strategy, or the corresponding HFRI index, or globally using (5), i.e. the HFRI Global index.
Table 5 contains the results of runs tests when the benchmark is com-puted, each period, as the median of the returns of the funds having the same primary strategy. 2878 funds matched the …lters described previously.
Focusing on the number of runs of success based on P (r1), (7), (13) or
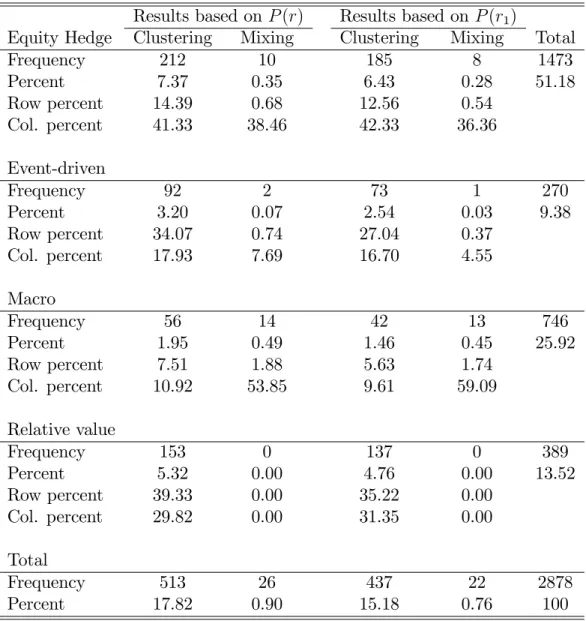
(15), on 2878 funds, only 15.18 % (437 funds) have a tendency to cluster, i.e. to be during large periods of time in the right tail of the distribution of the returns. Only 0.76% (22 funds) have a tendency to mix. Among these 437 funds, 42.33% are Equity Hedge, 31.35% Relative Value, 16.70% Event-Driven and 9.61% Macro. Nevertheless, the proportions of funds showing clusters within each primary strategy are: 35.22% for Relative Value, and by decreasing order, 27.04% for Event Driven, 12.56% for Equity Hedge and 5.63% for Macro. Hence, funds following Relative Value or Event-Driven strategy have the highest probability to generate clusters in their relative returns.
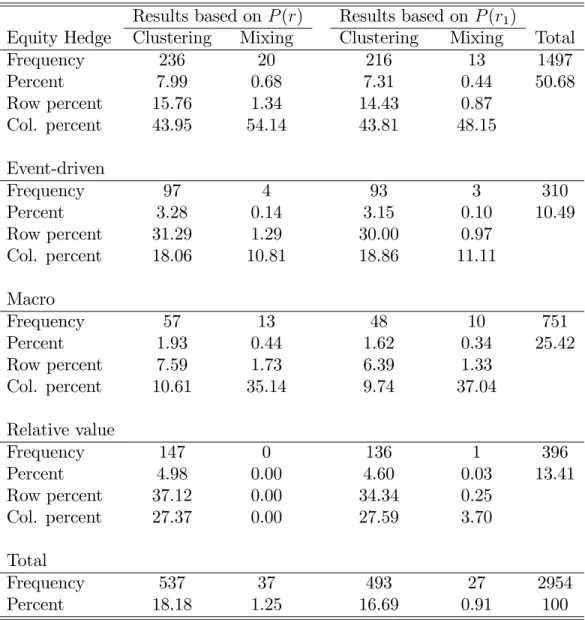
Next, benchmarks are calculated as average of peer’s group (same primary strategy) returns per period, using primary indices. Results are summarized in Table 6. It turns out that only 16.69% present clustering in their relative returns. In proportions, returned by the row percents, again, the Relative Value and the Event Driven strategies have the highest probability to cluster (34.34% and 30.00%). Fewer funds within Equity Hedge and Macro strategies do cluster.
As a reminder, Relative Value strategy covers a very diverse set of strate-gies which have all as common goal to take advantage upon ine¢ciencies and opportunities of the market. Arbitrage may be conditioned in some cases by the directional evolution of the market or the realization of a particular event so that the expected convergence is achieved.
A second explanation for this persistence arises from the fact that for certain trading strategies such as convexity trading (gamma trading),
arbi-trageurs choose not to systematically adjust their portfolios when the stock price changes and prefer to do rather according to their expectations based on the existence of cycles trends (upward or downward) of the prices. Thus, in this type of strategy, model the convertible bond as a portfolio of options implies less liquidity and therefore it forced the managers in some cases stick with their positions for a certain number of months (that is to say, to redeem the bond).
Moreover, Fixed Income-Sovereign strategy (as de…ned by HFR) includes strategies in which the investment thesis is predicated on realization of a spread between related instruments in which one or multiple components of the spread is a sovereign …xed income instrument. The presence of clusters can be explained by the fact that interest rate risk is linked to yield curve movement. This is very important in the case of in and out of the money convertible bonds. In this context, the interest rate risk is often related to the yield curve swaps or bonds. The latter could explain why in this class clustering percentage is lowered to 8.02%. (The S&P500 index does not a¤ect the Relative Value class generally).
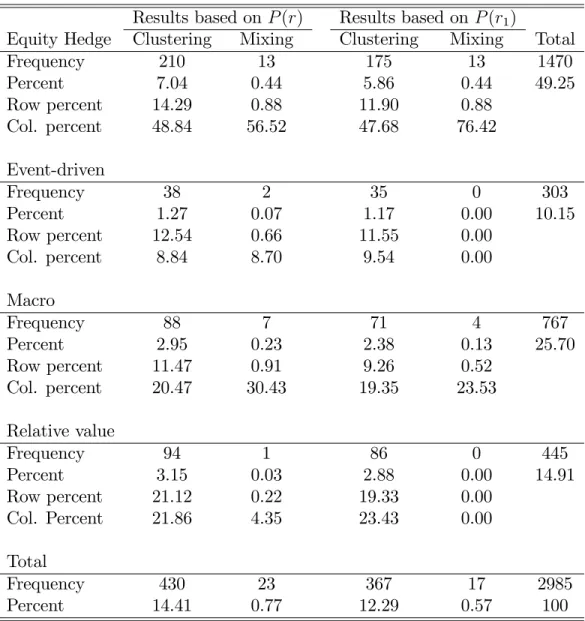
When relative returns are calculated relative to the HFRI Global index, results are quite di¤erent. As shown by Table 7, only 12.29% attempt to cluster. 47.68% of which are in the Equity Hedge peer group, 23.43% in the Relative Value, 19.35% in Macro and only 9.54% in Event-Driven. Here again, the highest probability to cluster is within the Relative Value (19.35%), followed by the Equity-Hedge (11.90%), the Event-Driven (11.55%) and The Macro (9.26%).
(2003) and Harri and Brorsen (2004), who concluded that persistence was related to the kind of hedge fund strategy, and therefore in sharp contrast with Agarwal and Naik (2000b), …nding out that persistence was not related to a primary strategy.
Remark 3 At some degree, HFR classi…cation of hedge funds by primary strategy is relevant and it gives hedge fund allocator with some guidelines on needed e¤ort to pick-up good candidate capable to replicate past returns. Indeed, hedge fund selection is more challenging for Macro and Equity hedge strategies than Relative value and Event driven. In other words, “top in class” funds tend to maintain their 1st half ranking when the main strategy
is Event driven or Relative value. For an investor, for instance a fund of hedge funds manager targeting to outperform an index representing a certain hedge strategy, or the industry as a whole had better to consider di¤erently the four HFR strategies. Tools needed to select top performing hedge funds should be adapted to the strategy (Event driven/Relative value versus Equity Hedge/Macro).
3.3.2 Relative performance with regard to the S&P500 index
Here, randomness is assessed relative to a traditional equity index, the S&P 500 index. The tested universe is composed of 3378 funds.
Results are given by Table 8. Only 11.16% (377 funds) of the funds of the universe have a tendency to cluster and 0.56% to mix. 54.91% of these funds are Equity Hedge, 27.59% Macro, 10.88% Relative Value and …nally 6.63% Event-Driven. Focusing on row percents, 13.32% of the Macro funds present a tendency to cluster, against 12.53%, 6.83% and 7.08% for
respectively the Equity Hedge, Event-Driven and Relative Value. Clearly, this is in sharp contrast with preceding results, and emphasize that the choice of a benchmark to analyze the relative performance is crucial.
Remark 4 As classi…ed by the HFR database, Macro strategy classi…cation includes the following sub-strategies: Active Trading, Macro: Commodity - Agriculture, Macro: Commodity - Energy, Macro: Commodity - Metals Sector: Technology / Healthcare, Systematic Diversi…ed Discretionary The-matic). These strategies are directional, with a high leverage. Trading ideas of these strategies are generated from the economic environment in general (top-down approach) and the alpha of the manager hold on his real ability to choose the right moment to implement his views (market timing). Thus, the corrections related to imbalances in markets can last several months and thereby explains the presence of trend and persistence in returns.
Remark 5 When a representative index of the most liquid stock in the US is used, then the global picture changes completely. Here, the more liquid strategy (in terms of traded assets) become leading (the reverse of the pre-vious section). This raised the question of “prices manipulation” by hedge fund managers deploying Event driven or Relative value strategies in their portfolio. In their e¤ort to smooth returns, those hedge fund managers use price to re‡ect their valuation rather than market prices.
Fund of hedge fund manager targeting to beat traditional markets should therefore consider a di¤erent framework in his portfolio construction process. Macro and Equity hedge strategies require less e¤ort to select good candidate than Event driven and Relative value ones.
4
Before and after the 2007 crisis
Financial crisis started in 2007 has revealed the vulnerability of the hedge fund industry; at epicenter, Relative Value funds group had the highest blow-up rate. Has the crisis changed the hedge fund relative returns pro…le? To answer this question, we split into two sub-periods by choosing August 2007 as a breaking point. The results of tests carried out over the 2 periods are displayed in Tables 9 and 10.
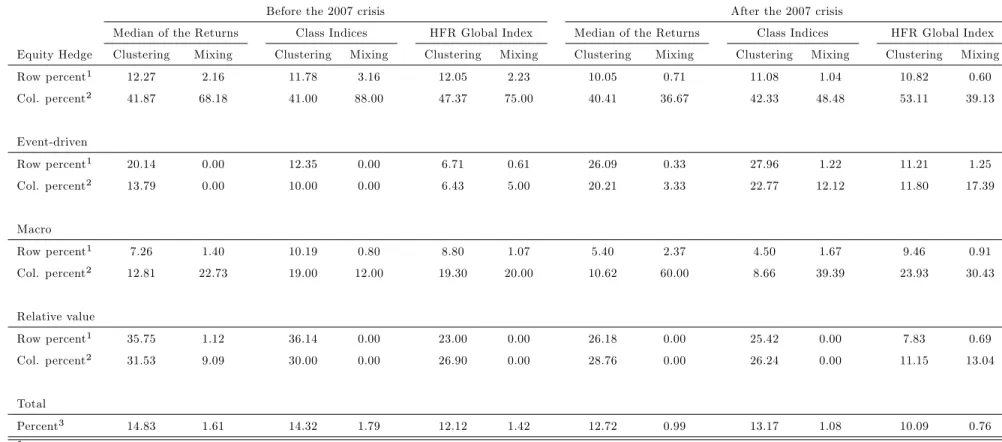
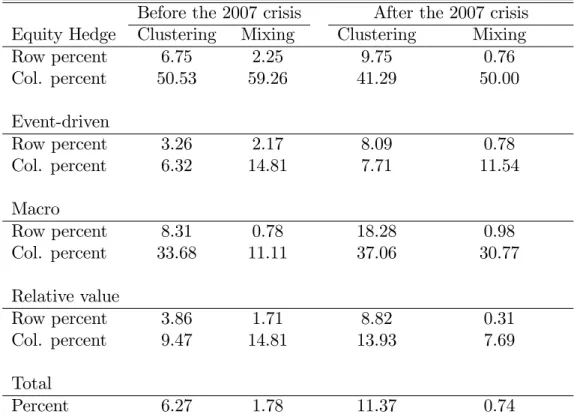
At …rst glance, almost all proportions of funds (row percent) clustering on each sub-period are lower compared to the whole period. Also, the impact of the crisis on persistence deeply depends on the type of benchmark considered: i) It is positive (increased clustering), in the case of a traditional external
index (S&P 500), and independently of the strategy
ii) It is negative (decreased clustering), when HFR indices are used, except for Event Driven peer group
The positive e¤ect in i) could be mainly explained by a behavioral change in the industry priority to generate returns. After the …nancial crisis of 2007, hedge funds return objective was indexed in absolute term rather than relative to a traditional benchmark.
In ii), the discrepancy between Event Driven and the rest of strategies may be due to the heterogeneity of the former. The returns spread, between sub-strategies within Event Driven, have been ampli…ed through the crisis. Apart from Event Driven, the negative impact of the crisis resulted from the returns pro…le similarity of the underlying hedge fund after the crisis.
5
Conclusion and discussion
In this paper, we have used runs based tests to test for randomness in both returns, and relative performances. Clearly, concerning the former test, more than 80% of the funds have returns distributed at random. For relative performances, few funds have a tendency to cluster. But the key information is that, focusing on row percent, about one third of the …rms having a Relative Value strategy present clustering, and 30% for the Event-Driven strategy, when one uses the median or indices by classes as benchmarks. Using the HFRI global index as a benchmark, only 12.29 % of the …rms have a tendency to cluster in the their relative performances. Still, at the sub-class index level, hedge funds having a Relative Value strategy have the highest probability to cluster (19.33 %). At last, concerning an external market, given by the S&P500 index, only 11% do cluster, but here, the highest proportion is found within the Macro strategy. At last, the 2007 …nancial crisis has increased the proportion of fund with the Event Driven strategy that do cluster. Our results show that few funds are able to signi…cantly over-perform the market during given periods.
In addidion to that, “Smart money” e¤ect consists in investing in funds that will outperform in the future. We believe that our work could provide smart investors with robust tools to assess its challenging mandate.
There is an avenue for future researches in this area. Once selected the hedge clustering, a natural development would be …nding external factors explaining persistence, thus leading to a possible forecasting of relative re-turns. Also, of primary importance as the manageurial skills (Caglayan and Edwards, 2001).
References
[1] Ackermann, C., McEnally, R., Ravenscraft, D., 1999. The Performance of hedge funds: Risk, return, and incentives. Journal of Finance 54, 833-874.
[2] Agarwal, V., Naik., N.Y., 2000a. Generalized style analysis of hedge funds. Journal of Asset Management 1, 93-109.
[3] Agarwal, V., Naik., N.Y., 2000b. Multi-period performance persistence analysis of hedge funds. Journal of Financial and Quantitative Analysis 35, 327-342.
[4] Amenc, N., El Bied, S., Martellini, L., 2003. Predictability in hedge fund returns. Financial Analysts Journal 59, 32-46.
[5] Baquero, G., Horst, J., Verbeek., M., 2004. Survival, look-ahead bias and the persistence in hedge funds performance. Journal of Financial and Quantitative Analysis 40, 493-517.
[6] Barès, P.-A., Gibson, R., Gyger., S., 2003. Performance in the hedge funds industry: An analysis of short and long-term persistence. Journal of Alternative Investments 6, 25–41.
[7] Boyson, N. M., Cooper., M. J., 2004. Do hedge funds exhibit perfor-mance persistence? A new approach, Working Paper.
[8] Brooks, C., Kat., H., 2002. The statistical properties of hedge fund returns and their implications for investors. Journal of Alternative In-vestments 5, 26-44.
[9] Brorsen, B. W., Harri. A. 2004. Performance persistence and the source of returns for hedge funds. Applied Financial Economics 14, 131-141. [10] Brown, S., Goetzmann, W., Ibbotson., R., 1999. O¤shore hedge funds:
Survival and performance: 1989-95. The Journal of Business 72, 91-117. [11] Caglayan, M., Edwards., F., 2001. Hedge fund performance and manager
skill. Journal of Futures Markets 21, 1003-102.
[12] Capocci, D., Corhay, A., Hübner., G., 2005. Hedge fund performance and persistence in bull and bear markets. European Journal of Finance 11, 361-392.
[13] Carpenter, J.N, Lynch, A.W., 1999. Survivorship bias and attrition ef-fects in measures of performance persistence. Journal of Financial Eco-nomics 54, 337-374.
[14] De Souza, C., Gokcan, S., 2004. Hedge fund investing: A quantitative approach to hedge fund manager selection and de-selection. The Journal of Wealth Management 6, 52-73.
[15] Edwards, F.R., Caglayan., M.O., 2001. Hedge fund performance and manager skill. Journal of Futures Markets 21,1003-1028.
[16] Eling, M.,2008. Does hedge fund performance persist? Overview and new empirical evidence. Working papers on risk management and insur-ance 37, Univeristy of St Gallen.
[17] Fama, E.F., MacBeth, J.-D., 1973. Risk, return and equilibrium: Em-pirical tests. Journal of Political Economy 81.
[18] Fung, W., Hsieh, D. A., 2000. Performance characteristics of hedge funds and CTA funds: natural versus spurious biases. Journal of Financial and Quantitative Analysis 35, 291-307
[19] Gibbons, J. D., Chakraborti, S., 1992. Nonparametric statistical infer-ence. New York: Marcel Dekker.
[20] Gupta, B., Cerrahoglu, B., Daglioglu., A., 2003. Evaluating hedge fund performance: Traditional versus conditional approaches. The Journal of Alternative Investments 6, 7-24.
[21] Harri, A., Brorsen., B. W., 2004. Performance persistence and the source of returns for hedge funds. Applied Financial Economics 14, 131-141. [22] Henn, J., Meier., I., 2004. Performance Analysis of Hedge Funds, in:
Dichtl, H., Kleeberg, J. M., Schlenger, C. (eds.): Handbuch Hedge Funds, Uhlenbruch, Bad Soden/Ts.
[23] Herzberg, M. M., Mozes, H. A., 2003. The Persistence of Hedge Fund Risk: Evidence and Implications for Investors. The Journal of Alterna-tive Investments 6, 22-42.
[24] Jagannathan, R., Malakhov, A., Novikov, D., 2006. Do hot hands persist among hedge fund managers? An empirical evaluation. Working Paper, Northwestern University.
[25] Kat, H. M., Menexe, F., 2003. Performance evaluation and condition-ing information: The case of hedge funds. The Journal of Alternative Investments.
[26] Koh, F., Koh, W. T. H., Teo, M., 2003. Asian hedge funds: Return persistence, style, and fund characteristics. Working paper.
[27] Kouwenberg, R., 2003. Do hedge funds add value to a passive portfolio? Journal of Asset Management 3, 361–382.
[28] Liang, B., 2001. Hedge fund performance: 1990-1999. Financial Analysts Journal, 11-18.
[29] Lo, A.W., MacKinlay, A.C., 1988. Stock market prices do not follow random walks: Evidence from a simple speci…cation test. Review of Financial Studies 1, 41-66.
[30] Malkiel, B. G., Saha, A., 2005. Hedge funds: Risk and return. Financial Analysts Journal 61, 80-88.
[31] Mendenhall, Schea¤er, Wackerly, 1986. Mathematical Statistics with Applications, 3rd Ed., Duxbury Press, CA.
[32] Posthuma, N., van der Sluis, P. J., 2004. A reality check on hedge fund returns. In hedge fund intelligent investing, ed. Barry Schachter. Risk-Books.
[33] Wald, A., Wolfowitz, J., 1940. On a test whether two samples are from the same population. Ann. Math Statist., 147-162.
Table 1: Repartition by secondary strategies for Equity Hedge, Event-Driven, Macro and the Relative Value primary strategies
Main Strategy
Equity Hedge Strategy Event Driven Strategy
Sub-Strategy Percent Sub-Strategy Percent
Equity Market Neutral 11.34 Activist 4.88
Fundamental Growth 29.48 Credit Arbitrage 6.87
Fundamental Value 38.09 Distressed-Restructuring 27.93
Multi-Strategy 4.52 Merger Arbitrage 12.19
Quantitative Directional 4.96 Multi-stategy 14.19
Sector Energy-Basic Materials 5.85 Private issue-Regulating 1.33
Sector technology-Health care 4.38 Special Situation 32.59
Short Bias 1.06
Main Strategy
Macro Relative Value
Sub-Strategy Percent Sub-Strategy Percent
Active Trading 4.66 Fixed Income-Asset Backed 17.47
Commodity-Agriculture 2.20 Fixed Income-Arbitrage Convertible 9.31
Commodity-Energy 1.39 Fixed Income-Corporate 19.77
Commodity Metal 3.30 Fixed Income-Sovereign 7.47
Commodity-Multi 9.49 Muti-Strategy 27.59
Currency-Discretionary 4.15 Volatility 9.19
Currency-Systematic 6.52 Yield Alternatives-Energy Infrastructure 4.25
Discretionary Thematic 18.05 Yield Alternatives-Real Estate 4.94
Multi-Strategy 16.19
Table 2: Distribution of returns by kind of primary strategies. The distrib-ution of the S&P500 index is also given.
Equity Hedge Event-Driven Macro Relative Value S&P500
Mean 0.72 0.80 0.78 0.77 0.69
Variance 33.45 19.35 27.83 20.07 19.18
Skweness 12.73 1.84 0.71 2.89 -0.57
Table 3: Two-sided tests for randomness of returns. Results based on P (r), given at the 5% threshold (Number of hedge funds: 3947)
Equity Hedge Not Random Random Total
Frequency 242 1656 1898 Percent 6.13 41.96 48.09 Row percent 12.75 87.25 Col. percent 33.89 51.22 Event-driven Frequency 157 244 401 Percent 3.98 6.18 10.16 Row percent 39.15 60.85 Col. percent 21.99 7.55 Macro Frequency 77 871 948 Percent 1.95 22.07 24.02 Row percent 8.12 91.88 Col. percent 10.78 26.94 Relative value Frequency 238 462 700 Percent 6.03 11.71 17.73 Row percent 34.00 66.00 Col. percent 33.33 14.29 Total Frequency 714 3233 3947 Percent 18.09 81.91 100.00
The table is to be interpreted as follows: The Frequency returns the number of funds having returns at random or not within each main strategy. The Percent returns the number of funds having returns at random or not, divided by the total number of funds. The Row Per-cent returns the number of funds having returns at random or not, within a main strategy divided by the total number of funds in this strategy. The Column Percent returns the number of funds having returns at
Table 4: One-sided tests for randomness of returns against clustering or mixing. Results based on P (r) and P (r1) given at the 5% threshold (Number
of hedge funds: 3947)
Results based on P (r) Results based on P (r1)
Equity Hedge Clustering Mixing Clustering Mixing Total1
Frequency 353 9 316 7 1898 Percent 8.94 0.23 8.01 0.18 48.09 Row percent 18.60 0.47 16.65 0.37 Col. percent 38.08 19.57 37.00 25.93 Event-driven Frequency 196 0 184 0 401 Percent 4.97 0.00 4.66 0.00 10.16 Row percent 48.88 0.00 45.89 0.00 Col. percent 21.14 0.00 21.55 0.00 Macro Frequency 90 30 76 20 948 Percent 2.28 0.76 1.93 0.51 24.02 Row percent 9.49 3.16 8.02 2.11 Col. percent 9.71 65.22 8.90 74.07 Relative value Frequency 288 7 278 0 700 Percent 7.30 0.18 7.04 0.00 17.73 Row percent 41.14 1.00 39.71 0.00 Col. percent 31.07 15.22 32.55 0.00 Total Frequency 927 46 854 27 3947 Percent 23.49 1.17 21.64 0.68 100
The table is to be interpreted as follows: The Frequency returns the number of funds clustering or mixing within each main strategy. The Percent is the number of funds clustering or mixing divided by the total number of funds. The Row Percent returns the number of funds clustering or mixing within a main strategy, divided by the total number of funds in this strategy. The Column percent returns the number
Table 5: One-sided tests for randomness of relative performances against clustering or mixing. Relative performances computed using the median of returns. Results given at the 5% threshold by primary strategies (Number of hedge funds: 2878)
Results based on P (r) Results based on P (r1)
Equity Hedge Clustering Mixing Clustering Mixing Total
Frequency 212 10 185 8 1473 Percent 7.37 0.35 6.43 0.28 51.18 Row percent 14.39 0.68 12.56 0.54 Col. percent 41.33 38.46 42.33 36.36 Event-driven Frequency 92 2 73 1 270 Percent 3.20 0.07 2.54 0.03 9.38 Row percent 34.07 0.74 27.04 0.37 Col. percent 17.93 7.69 16.70 4.55 Macro Frequency 56 14 42 13 746 Percent 1.95 0.49 1.46 0.45 25.92 Row percent 7.51 1.88 5.63 1.74 Col. percent 10.92 53.85 9.61 59.09 Relative value Frequency 153 0 137 0 389 Percent 5.32 0.00 4.76 0.00 13.52 Row percent 39.33 0.00 35.22 0.00 Col. percent 29.82 0.00 31.35 0.00 Total Frequency 513 26 437 22 2878 Percent 17.82 0.90 15.18 0.76 100
Table 6: One-sided tests for randomness of relative performances against clustering or mixing. Relative performances computed using HFRI indices for each primary strategies. Results given at the 5% threshold by primary strategies (Number of hedge funds: 2954)
Results based on P (r) Results based on P (r1)
Equity Hedge Clustering Mixing Clustering Mixing Total
Frequency 236 20 216 13 1497 Percent 7.99 0.68 7.31 0.44 50.68 Row percent 15.76 1.34 14.43 0.87 Col. percent 43.95 54.14 43.81 48.15 Event-driven Frequency 97 4 93 3 310 Percent 3.28 0.14 3.15 0.10 10.49 Row percent 31.29 1.29 30.00 0.97 Col. percent 18.06 10.81 18.86 11.11 Macro Frequency 57 13 48 10 751 Percent 1.93 0.44 1.62 0.34 25.42 Row percent 7.59 1.73 6.39 1.33 Col. percent 10.61 35.14 9.74 37.04 Relative value Frequency 147 0 136 1 396 Percent 4.98 0.00 4.60 0.03 13.41 Row percent 37.12 0.00 34.34 0.25 Col. percent 27.37 0.00 27.59 3.70 Total Frequency 537 37 493 27 2954 Percent 18.18 1.25 16.69 0.91 100
Table 7: One-sided tests for randomness of relative performances against clustering or mixing. Relative performances computed using the HFRI global index. Results given at the 5% threshold by primary strategies (Number of hedge funds: 2985)
Results based on P (r) Results based on P (r1)
Equity Hedge Clustering Mixing Clustering Mixing Total
Frequency 210 13 175 13 1470 Percent 7.04 0.44 5.86 0.44 49.25 Row percent 14.29 0.88 11.90 0.88 Col. percent 48.84 56.52 47.68 76.42 Event-driven Frequency 38 2 35 0 303 Percent 1.27 0.07 1.17 0.00 10.15 Row percent 12.54 0.66 11.55 0.00 Col. percent 8.84 8.70 9.54 0.00 Macro Frequency 88 7 71 4 767 Percent 2.95 0.23 2.38 0.13 25.70 Row percent 11.47 0.91 9.26 0.52 Col. percent 20.47 30.43 19.35 23.53 Relative value Frequency 94 1 86 0 445 Percent 3.15 0.03 2.88 0.00 14.91 Row percent 21.12 0.22 19.33 0.00 Col. Percent 21.86 4.35 23.43 0.00 Total Frequency 430 23 367 17 2985 Percent 14.41 0.77 12.29 0.57 100
Table 8: One-sided tests for randomness of relative performances against clustering or mixing. Relative performances computed using the S&P500 index. Results given at the 5% threeshold by primary strategies (Number of hedge funds: 2985)
Results based on P (r) Results based on P (r1)
Equity Hedge Clustering Mixing Clustering Mixing Total
Frequency 233 12 207 13 1652 Percent 6.90 0.36 6.13 0.38 48.90 Row percent 14.10 0.73 12.53 0.79 Col. percent 54.82 52.17 54.91 68.42 Event-driven Frequency 30 4 25 2 366 Percent 0.89 0.12 0.74 0.06 10.83 Row percent 8.20 1.09 6.83 0.55 Col. percent 7.06 17.39 6.63 10.53 Macro Frequency 115 6 104 3 781 Percent 3.40 0.18 3.08 0.09 23.12 Row percent 14.72 0.77 13.32 0.38 Col. percent 27.06 26.09 27.59 15.79 Relative value Frequency 47 1 41 1 579 Percent 1.39 0.03 1.21 0.03 17.14 Row percent 8.12 0.17 7.08 0.17 Col. Percent 11.06 4.35 10.88 5.26 Total Frequency 425 23 377 19 3378 Percent 12.58 0.68 11.16 0.56 100
Table 9: One-sided tests for randomness of relative performances, against clustering or mixing. Tests are performed before and after the 2007 …nancial crisis. Relative performances are computed using i) the median of the returns, ii) a primary HFRI index, iii) the HFRI global index. The results are given at the 5 % threshold
Before the 2007 crisis After the 2007 crisis
Median of the Returns Class Indices HFR Global Index Median of the Returns Class Indices HFR Global Index
Equity Hedge Clustering Mixing Clustering Mixing Clustering Mixing Clustering Mixing Clustering Mixing Clustering Mixing
Row percent1 12.27 2.16 11.78 3.16 12.05 2.23 10.05 0.71 11.08 1.04 10.82 0.60 Col. percent2 41.87 68.18 41.00 88.00 47.37 75.00 40.41 36.67 42.33 48.48 53.11 39.13 Event-driven Row percent1 20.14 0.00 12.35 0.00 6.71 0.61 26.09 0.33 27.96 1.22 11.21 1.25 Col. percent2 13.79 0.00 10.00 0.00 6.43 5.00 20.21 3.33 22.77 12.12 11.80 17.39 Macro Row percent1 7.26 1.40 10.19 0.80 8.80 1.07 5.40 2.37 4.50 1.67 9.46 0.91 Col. percent2 12.81 22.73 19.00 12.00 19.30 20.00 10.62 60.00 8.66 39.39 23.93 30.43 Relative value Row percent1 35.75 1.12 36.14 0.00 23.00 0.00 26.18 0.00 25.42 0.00 7.83 0.69 Col. percent2 31.53 9.09 30.00 0.00 26.90 0.00 28.76 0.00 26.24 0.00 11.15 13.04 Total Percent3 14.83 1.61 14.32 1.79 12.12 1.42 12.72 0.99 13.17 1.08 10.09 0.76 1:
Proportion of funds having a tendency to cluster or to mix within a given main strategy. 2:
Table 10: One-sided tests for randomness of relative performances, against clustering and mixing. Tests are performed before and after the 2007 …nancial crisis. Relative returns computed using the S&P500 index. The Results are given at the 5% threshold by primary strategies (Number of hedge funds: 2985)
Before the 2007 crisis After the 2007 crisis
Equity Hedge Clustering Mixing Clustering Mixing
Row percent 6.75 2.25 9.75 0.76 Col. percent 50.53 59.26 41.29 50.00 Event-driven Row percent 3.26 2.17 8.09 0.78 Col. percent 6.32 14.81 7.71 11.54 Macro Row percent 8.31 0.78 18.28 0.98 Col. percent 33.68 11.11 37.06 30.77 Relative value Row percent 3.86 1.71 8.82 0.31 Col. percent 9.47 14.81 13.93 7.69 Total Percent 6.27 1.78 11.37 0.74
The table is to be interpreted as follows: The Row Percent returns the number of funds having clustering or mixing within a main strategy divided by the total number of funds in this strategy. The Column Percent returns the number of funds clustering or mixing divided by the total number of funds clustering or mixing