HAL Id: hal-00399533
https://hal.archives-ouvertes.fr/hal-00399533
Submitted on 6 Jul 2009HAL is a multi-disciplinary open access
archive for the deposit and dissemination of sci-entific research documents, whether they are pub-lished or not. The documents may come from teaching and research institutions in France or abroad, or from public or private research centers.
L’archive ouverte pluridisciplinaire HAL, est destinée au dépôt et à la diffusion de documents scientifiques de niveau recherche, publiés ou non, émanant des établissements d’enseignement et de recherche français ou étrangers, des laboratoires publics ou privés.
Fibre-scale Modeling of C/C Processing by Chemical
Vapour Infiltration Using Xray CMT Images and
Random Walkers
Gérard Vignoles, Christian Germain, Olivia Coindreau, Christianne Mulat,
William Ros
To cite this version:
Gérard Vignoles, Christian Germain, Olivia Coindreau, Christianne Mulat, William Ros. Fibre-scale Modeling of C/C Processing by Chemical Vapour Infiltration Using Xray CMT Images and Random Walkers. uroCVD17 / ICVD XVII, Oct 2009, Vienna, Austria. 12 p. �hal-00399533�
Fibre-scale Modeling of C/C Processing by Chemical Vapour Infiltration Using X-ray CMT Images and Random Walkers
G. L. Vignoles a, C. Germainb, O. Coindreaua, C. Mulat a,b, and W.Rosa
a
University Bordeaux, Lab. des Composites ThermoStructuraux (LCTS) , F33600 Pessac, France
b
ENITAB, Lab. de l’Intégration du Matériau au Système (IMS), F33405 Talence Cedex, France
We present a computational tool for the modeling of Chemical Vapor Infiltration of carbon/carbon composites, which is based on 3D images acquired by X-ray Computerized Micro-Tomography with a very fine resolution, such that the fibers are clearly distinguishable from each other. Preliminary image processing is necessary in order to perform segmentation between solid and void phases. Then, morphological and transport properties are computed in the images. Random walkers are used for the simulation of gas transport in continuum and rarefied regimes. The image modification under chemical deposition is handled by a specific surface discretization technique and a pseudo-VOF method. Results are presented and discussed: the notion of infiltrability is introduced as a design tool for the CVI engineer.
Introduction
Fibre-reinforced carbon-matrix (C/C) composites are dedicated to very high-performance and high-cost applications, mainly in the domain of aerospace technology (1), as thermal protection systems, rocket engine hot parts, or aircraft brakes, as well as plasma-facing components in Tokamak reactors (2).
Carbon-carbon composites are produced, among other processes, by Chemical Vapor Infiltration (CVI): a heated fibrous preform is infiltrated by the chemical cracking of a vapor precursor of the matrix material inside the pore space of the preform (3). The quality of materials prepared by CVI relies on processing conditions (such as gas precursor concentration, temperature and pressure), as well as on intrinsic properties of the preform. Experimental determination of the conditions which lead to an optimal infiltration is time-consuming and expensive. That is the reason why a global modeling of CVI is of great interest to optimize the final density and homogeneity of the composites (4-9). This modeling requires a good knowledge of geometrical characteristics and transport properties of the preform at various stages of infiltration (10), namely: the effective gas diffusivity, either in continuum or in rarefied regime, the gas permeability to viscous flow, and the heat conductivity, in the case of thermal-gradient modifications of CVI (11). All those properties depend on the composite morphology, which may be rather complex in some cases.
The study of geometry and transport in families of ideal media has always rested on the idea that there was only one way for the properties to vary with porosity; usually some kind of “dilation” of the solid-phase is the underlying assumption. Indeed, this is achieved in the limit of infinitely rapid diffusion (i.e. constant precursor concentration). However, actual CVI conditions usually imply some pore-scale diffusional limitations:
this motivates further efforts at predicting the detailed geometrical evolution of complex porous media.
This is where the use of X-ray Computed Micro-Tomography brings help, because of its exceptional capacity for the acquisition of large, accurate 3D images of the material structure, and the possibility to carry on physico-chemical modeling on the obtained 3D datasets. However, application to the case of C/C preparation by CVI contains some specific aspects which have to be taken into account.
First of all, fine-scale tomographic characterization of C/C composites has not yet been frequently reported, principally because the low absorption coefficient of carbon makes it nearly transparent when imaged at high resolution. We will present here suitable techniques of image acquisition and processing which overcome this difficulty.
Second, when very large datasets are at hand for physico-chemical modeling, there is a need for adapted numerical techniques which can handle those datasets. Jin & Wang (12) have developed a level-set method suited to such a simulation, assorted to a closed-pore detector, and present results in the kinetic limit in a small arrangement of balls. In this paper, we present a Random-Walk technique which addresses various regimes, from high to low surface reactivity, and from high to low degree of gas rarefaction, and needs considerably less memory amounts to work in reasonable CPU times.
This paper will be structured in three parts: the first one will summarize the image acquisition and processing steps; then, in a second part, the Random-Walk CVI modeling technique will be presented. The third part will present and discuss some results, before the concluding remarks.
Image acquisition and processing
In order to have a good representation of the C/C composite architecture, CMT scans should be performed at various scales: indeed, the diameter of a single fiber is roughly 8 µm, while the space period of the textile arrangement may span several millimeters. Fortunately, all these scales are accessible to X-ray CMT, using classical X-ray sources for the largest ones and Synchrotron Radiation X-ray CMT (XRCT) for the smallest. However, in this last case, one has not a direct access to the density distribution in the material. Indeed, the difference between the absorption coefficients of the carbon fibers, the carbon matrix, the embedding matrix that has sometimes to be used in sample preparation, and air is small and the contrast is faint. Nonetheless, the highly coherent character of the quasi-parallel, monochromatic X-ray beam from synchrotron sources allows for characterizations based on the refractive index contrasts, which are approximately 1000 times larger than the absorption contrasts (13). Two approaches are then possible: first, the complete refraction index reconstruction, called holotomography (14), and second, the phase-contrast edge-detection mode, associated to image processing for the segmentation of the constitutive phases. These extra difficulties partly explain why there has been a large time gap between the first successful characterizations of the structure of SiC fiber cloth lay-up preforms at bundle scale (pixel size of 15.6 mm) (15,16) and the same kind of work on C/C composites.
Details on the experimental procedure have been given in (17,18). The samples were raw and partly infiltrated C fiber preforms made of stacked satin weaves held together by stitching; they have been scanned with a 0.7 µm voxel edge size resolution, using the setup of the ESRF ID 19 beamline. Lower resolution scans (6.7 µm/voxel) were also made on the same samples, in order to connect with a maximal confidence the fiber-scale and larger scales, like the Representative Elementary Volume (REV) scale. Figure 1a)
displays a lower resolution image of the whole sample, the upper part of which has been scanned with higher resolution.
Even if holotomography has been capable of yielding promising results on C/C composites (17), we present here the alternative approach, which consists in applying specific image processing steps to the tomographic reconstruction obtained with only one set of projections, with a sample-to-detector distance chosen such as Fresnel fringes are clearly visible (19,20). This provides a strong edge-enhancement effect at any material discontinuity, which has principally been used in a qualitative way for the detection of interfaces. However, there are possibilities of extracting a full representation of the material phases through image processing techniques. In the case of C/C composites, a first algorithm has been developed for the separation of void (or resin) and solid phases, which display the strongest edge-enhancement effect (21). It consists in a region-growing algorithm, preceded by a hysteresis step which ensures the continuity of the edge-enhancement pattern. The result of this procedure, applied to a raw fiber preform, is illustrated in Figure 1b).
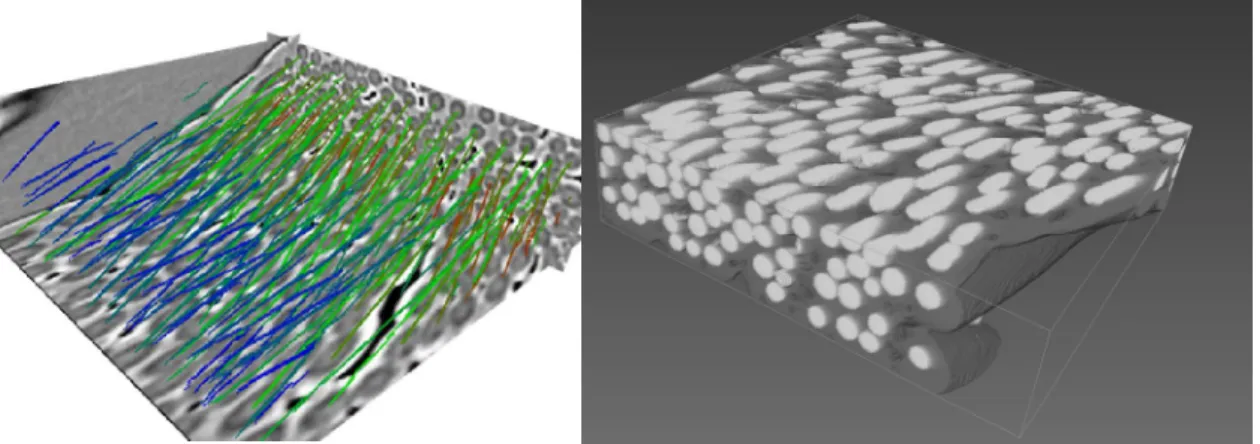
Later on, more elaborate techniques have been applied, in the aim of providing a full segmentation of fibers, matrix and void phases. For instance, Martín-Herrero and Germain (22) have designed and successfully tested an algorithm based on a differential profiling method to detect areas between intensity edges on every 2D cross section parallel to the reference system, which are then refined by correlating the outputs in 3D, followed by a “heavy-ball” fiber individuation procedure. Another method (23) uses directly the image gradient (and principally the edge-enhancement patterns) for the estimation of the localization of fiber axes; once the axes have been isolated, a gradient-sensitive region-growing procedure may be applied for the segmentation of the fibers first and then of the matrix. The result of this algorithm is presented in figure 3.
a)
b)
a)
b)
Figure 1. a) . Low-resolution scan of a C/C sample for CT acquisition at 2 distinct resolutions. Sample outer diameter is 6 mm. b) 3D rendering of C fibers in a raw preform, after segmentation from an edge-detection a high –resolution tomographic scan.
Figure 2. 3D rendering of fibers and matrix in a C/C sample from an edge-detection mode, after fiber axis identification.
Modeling of CVI by random walks
The necessary steps for CVI modeling are the determination of geometrical quantities, effective gas transfer properties (in continuum and rarefied regimes), heat transfer properties (when thermal gradients are involved), and the prediction of the porous medium evolution under infiltration. We will present here the part of the approach which is devoted to isothermal CVI at fiber scale.
Geometrical parameters
Once a proper segmentation of the solid and void phases is available, the first characterization that can be carried out concerns the geometrical properties of the medium (18). Pore volume measurements performed on the high-resolution scans have proved to be consistent with experimental determinations; moreover, the convergence
towards an REV size has been obtained for volumes larger than 0.03 mm3 (i.e. edge size
superior to ~ 0.3 mm). Internal surface area has been determined by a Simplified Marching Cube discretization (24,25). Though this is obviously not the best Marching Cube method in terms of precision, it has the advantage of being extremely fast and memory-sparing, a fact that is exploited later on in this work. The total surface area has been found coherent with the experimental values, provided the sub-micrometric roughness contribution (not accessible to this µCT experiment) is removed. Also, the pore size distribution has been evaluated and compared to experimental data from Hg intrusion curves, showing excellent agreement (26).
Gas transport
Effective gas transport coefficients are calculated in high-resolution images with a Pearson random walk algorithm, making use of our surface triangulation scheme. There are three diffusion regimes depending on the Knudsen number Kn, which is the ratio between the mean free path of the molecules and the pore diameter : the ordinary regime (Kn << 1), the transition regime (Kn ~ 1), the Knudsen or rarefied regime (Kn >> 1), all three of importance in CVI. The random path followed by the walkers introduced in the void space is directly linked to the Knudsen number and it allows determining the effective diffusivity tensor D at any value of Kn from the covariance matrix of the
centered displacements (27), divided by time. The tortuosity tensor components ij are
then calculated using the equation ij = Dref.Dij-1 where is the porosity and Dref the gas
diffusivity in void space. The laws that have been fitted (28) to the values computed from the CMT sub-samples are somewhat intermediate between ideal media made of random straight cylinders: parallel to each other (1D), grouped into mats (2D), or isotropic (3D), with or without overlap between cylinders. Although most of the fibers are rather locally oriented in a parallel fashion, it appears that the 1D models are not the most suited to describe them. Indeed, the discrepancies with the 1D non-overlapping, random cylinder ideal media arises principally from the non-strict alignment between contiguous fibers, a fact which lowers considerably the percolation threshold (29).
Infiltration simulation
The last step in the fiber-scale modeling procedure is to simulation the morphological evolution of the porous medium. This has been achieved using an extension of the Random Walk/Simplified Marching Cube, featuring four additions. Firstly,
heterogeneous reaction is represented by sticking events, the probability Pc of which is a
function of the reaction rate k and of the average molecular velocity v: 2 4 k v k Pc [1]
Secondly, rules have been chosen for the reintroduction of the walkers, in order to represent what is known to occur in the case of pyrocarbon CVI from hydrocarbon precursors. Indeed, the molecular hydrocarbon which is introduced follows a series of decomposition and recombination reactions; deposition occurs from reaction intermediates such as radicals. Actually, in the case of methane, the first decomposition step being extremely slow, one can consider that the limiting step of the homogeneous chemistry is the production of some intermediate from methane, which does not suffer any depletion effect by itself (31). Accordingly, a random walker will represent an intermediate species: it has a constant birth rate in the fluid. The modeling procedure maintains a constant concentration of walkers in the fluid part of the image: any walker is randomly reintroduced in the fluid after having been stuck, unless the volume variation due to the infiltration progress prevents this. The matching parameter between physical time and simulation time will thus depend on the average concentration evolution, which is usually determined only from a larger-scale simulation.
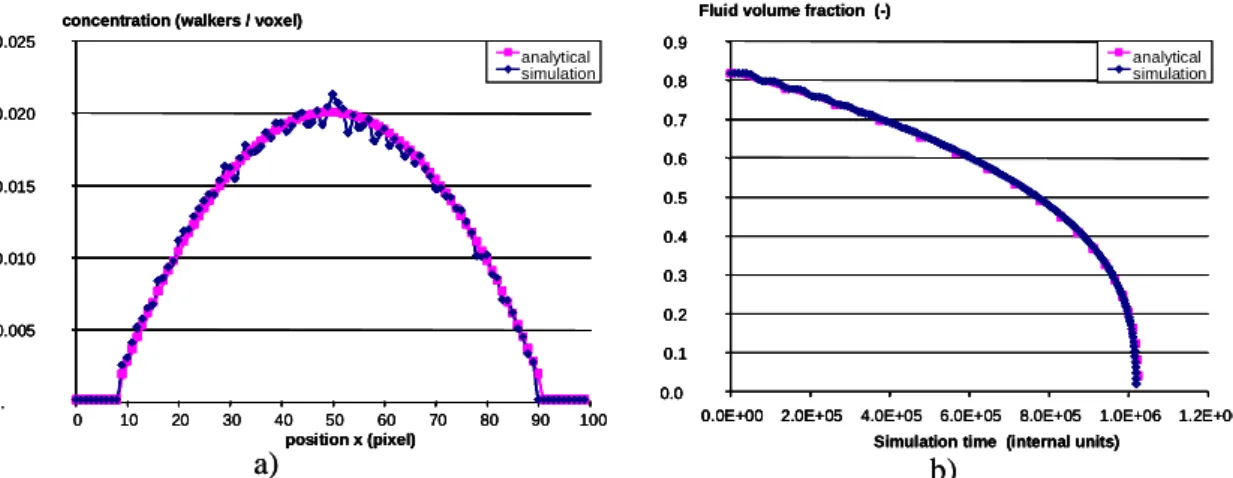
Thirdly, the surface modification is simulated by a pseudo-VOF technique. At each molecular sticking event, the closest fluid node is detected and its grayscale value increased by a determined amount, which is related to the actual condensation ratio and to the numerical factor which allows an explicit connection of the simulation scheme to physical infiltration time. The code has been validated on a test case: a flat pore is contained between two parallel infinite plates; there is a constant walker birth rate inside the fluid phase, which is kept equal to the deposition rate. A simple analytical approximation to the solution is readily available, and the numerical simulation has been compared to it, with an excellent agreement (30), as shown in Figure 3.
Finally, a percolation algorithm is implemented in order to eliminate all void space which would remain unconnected to the block faces. This does not represent the actual closed porosity, because some porosity which appears open at the image scale may be closed, when considered at a larger scale. This is one of the reasons that motivate simulations on large sizes.
0. 0.005 0.010 0.015 0.020 0.025 0 10 20 30 40 50 60 70 80 90 100 position x (pixel) concentration (walkers / voxel)
analytical simulation a) b) 0.0 0.1 0.2 0.3 0.4 0.5 0.6 0.7 0.8 0.9
0.0E+00 2.0E+05 4.0E+05 6.0E+05 8.0E+05 1.0E+06 1.2E+06
Simulation time (internal units) Fluid volume fraction (-)
analytical simulation 0. 0.005 0.010 0.015 0.020 0.025 0 10 20 30 40 50 60 70 80 90 100 position x (pixel) concentration (walkers / voxel)
analytical simulation 0. 0.005 0.010 0.015 0.020 0.025 0 10 20 30 40 50 60 70 80 90 100 position x (pixel) concentration (walkers / voxel)
analytical simulation a) b) 0.0 0.1 0.2 0.3 0.4 0.5 0.6 0.7 0.8 0.9
0.0E+00 2.0E+05 4.0E+05 6.0E+05 8.0E+05 1.0E+06 1.2E+06
Simulation time (internal units) Fluid volume fraction (-)
0.0 0.1 0.2 0.3 0.4 0.5 0.6 0.7 0.8 0.9 0.0E+00 2.0E+05 0.0 0.1 0.2 0.3 0.4 0.5 0.6 0.7 0.8 0.9
0.0E+00 2.0E+05 4.0E+05 6.0E+05 8.0E+05 1.0E+06 1.2E+06
Simulation time (internal units) Fluid volume fraction (-)
analytical simulation analytical simulation
Figure 3. Validation of the infiltration simulation on the case of a flat pore lying between two parallel plates. Mean free path = 1 pixel; Sticking Probability = 0.5 ; 1000 random walkers. a) Initial concentration profile ; b) Fluid volume fraction evolution with time.
Simulated pore-scale infiltrations: results and discussion
As an example, a first simulation is shown on a 400x400x350 voxels image
(0.28x0.28x0.245 mm3), with a mean free path equal to 1 voxel (i.e. 0.7 µm, so that Kn =
0.035, continuum regime), and a sticking probability equal to 0.16. Figure 4a-d) displays several snapshots of the structural evolution from an initial porosity of 72% down to 36%. Computation has been performed on a desktop PC featuring an Intel Q6600 CPU @ 2.4 GHz, has required 1.3 Gb memory, and lasted 79 hrs 23 min. Figure 4e) is rendering of the deposited matrix, in which it is clearly seen that the thickness is far from being constant: indeed, fibers lying close to a tow periphery receive a much larger deposit than in the tow center. It is striking to note that this phenomenon of premature pore plugging occurs even though the simulation features a random reintroduction of the stuck walkers everywhere in the void space, and though the sticking probability is moderate.
a)
b)
c)
d)
e)
a)
b)
c)
d)
e)
Figure 4. a-d) Four steps of the infiltration of a 400x400x350 voxels block. Porosities are from left to right and top to bottom: 72%, 60%, 50%, 36%. e) Rendering of the deposited
matrix.
The evolution of the composite may be monitored through the evolution of the scaled Thiele modulus : 0 0 0 / v v D D [2]
as the pore volume decreases. The Thiele modulus is a measure of the reaction/diffusion ratio; high values are synonymous of a difficult infiltration. This
quantity is roughly proportional to the inverse square root of the average pore diameter: accordingly, it is prone to suffer an increase when infiltration proceeds (32). Figure 9 displays such an evolution for a 100x100x100 block. The increase is firstly linear; then, it accelerates when getting closer to the percolation threshold, which in this case is extremely low. The linear increase is well depicted by an analytical approximation based on the model of Rikvold and Stell (33) for random dilute suspensions of partially non-overlapping parallel cylinders:
0 0 0 0 0 . 1 2 2 1 / [3]Such an evolution is shown to depend not only on the structure of the porous medium, but also on the initial values of the reaction/diffusion ratio and on the Knudsen number. Differences between a purely geometrical dilation – which corresponds to the kinetic limit, the sticking coefficient being lower than 0.01 – and a diffusional competition case – sticking coefficient = ½ – have been illustrated on a granular medium (34), with a more pronounced permeability decrease in the second case. Similarly, in the case of C/C infiltration, Figure 10 shows distinct evolutions of the same initial image under deposition with various conditions. The case of low sticking probability and continuum diffusion regime leads to the highest values of the surface area, corresponding to an optimal infiltration; when the Knudsen number or the sticking probability increases, the infiltration is less efficient.
0 0.05 0.1 0.15 0.2 0.25 0 0.2 0.4 0.6
Pore volume fraction (-) Dim/less surface area (-) Stick. Prob. = 1/3 Stick prob = 1/50 Stick. Prob. = 1/3 Stick. Prob. = 1/50 Rarefied Continuum 0 1 2 3 4 5 6 7 0 0.2 0.4 0.6 0.8 1
Pore volume fraction (-) Scaled Thiele Modulus (-) X direction Y direction Z direction Analytical
a)
b)
0 0.05 0.1 0.15 0.2 0.25 0 0.2 0.4 0.6Pore volume fraction (-) Dim/less surface area (-) Stick. Prob. = 1/3 Stick prob = 1/50 Stick. Prob. = 1/3 Stick. Prob. = 1/50 Rarefied Continuum 0 1 2 3 4 5 6 7 0 0.2 0.4 0.6 0.8 1
Pore volume fraction (-) Scaled Thiele Modulus (-) X direction Y direction Z direction Analytical 0 0.05 0.1 0.15 0.2 0.25 0 0.2 0.4 0.6
Pore volume fraction (-) Dim/less surface area (-) Stick. Prob. = 1/3 Stick prob = 1/50 Stick. Prob. = 1/3 Stick. Prob. = 1/50 Rarefied Continuum 0 1 2 3 4 5 6 7 0 0.2 0.4 0.6 0.8 1
Pore volume fraction (-) Scaled Thiele Modulus (-) X direction Y direction Z direction Analytical 0 1 2 3 4 5 6 7 0 0.2 0.4 0.6 0.8 1
Pore volume fraction (-) Scaled Thiele Modulus (-) X direction Y direction Z direction Analytical
a)
b)
Figure 5. Evolution of some quantities during infiltration. a) Scaled Thiele modulus; b)
Scaled surface area for various values of Kn and Pc.
Conclusion
This paper has presented a coherent simulation frame for the pore-scale infiltration of C/C composite chemical vapor infiltration, taking 3D blocks of the preform fibrous arrangement as obtained by X-ray CMT and image processing. The simulation is based on a Simplified Marching Cubes discretization of the fluid/solid interface, a Monte-Carlo Random Walk algorithm to account for diffusion of gases in continuum to rarefied regime, and a pseudo-VOF technique for surface modification. The chemical kinetic scheme involves a slowly decomposing gas precursor yielding a more rapidly reactive gaseous intermediate, suited to the case of pyrocarbon deposition from hydrocarbons. The computations allow producing quantitative estimates of the porous medium
properties as a function of infiltration progress, for different values of the gas rarefaction degree and of the reaction/diffusion ratio. Application of this procedure to various preforms allows discussing their relative merits in terms of infiltrability, i.e., their ability to receive a matrix deposit in given conditions.
Moreover, the simulated evolution results may be plugged inside a more global CVI modeling strategy, including a more detailed chemistry and a reactor-scale description of the mass and heat transfer (35). For instance, by combining the results of this approach with a chemical deposition kinetic scheme identified from CVD experiments inside a reactor-scale Finite Element model, it has been possible to get a quantitative validation of the whole modeling procedure in the case of carbon foam reinforcement (36).
Further work in this area involves optimization of the memory storage for the treatment of larger datasets, non-linear kinetics (second-order, Langmuir-Hinshelwood, etc …), other boundary conditions (e.g. introduction of a large-scale concentration gradient), and is currently under way.
Acknowledgments
The authors acknowledge CNRS and Snecma Propulsion Solide (Safran Group) for Ph. D. funding to O. C. and W. R., and the French Ministry of Education for Ph. D. funding to C. M.
References
1. G. Savage, Carbon/Carbon composites, Chapman & Hall, London (1993).
2. H.C. Mantz, D.A. Bowers, F.R. Williams, M.A. Witten, in Proceedings of the
IEEE 13th Symposium on Fusion Engineering vol. 2, IEEE-89CH2820-9, p. 947
(1990).
3. R. Naslain, F. Langlais, High Temp. Sci. 27, 221 (1990).
4. T. L. Starr, A. W. Smith, Mat. Res. Soc. Symp. Proc. 250, 207 (1992). 5. P. McAllister, E. E.Wolf, AIChE J., 39, 1196 (1993).
6. G. L. Vignoles, C. Descamps, N. Reuge, J. Phys. IV France 10, Pr2-9 (2000). 7. N. Reuge, G. L. Vignoles, J. Mater. Proc. Technol 166, 15 (2005).
8. D. Leutard, G. L. Vignoles, F. Lamouroux, B. Bernard, J. Mater. Synth. and Proc. 9, 259 (2002).
9. I. Golecki, Mater. Sci. Eng. R20, 37 (1997).
10. J. Y. Ofori, S. V. Sotirchos, J. Electrochem. Soc. 143, 1962 (1996).
11. G.L. Vignoles, J.M. Goyhénèche, P. Sébastian, J.R. Puiggali, J.F. Lines, J. Lachaud, P. Delhaès, M. Trinquecoste, Chem. Eng. Sci. 61, 5336 (2006).
12. S. Jin and X.-L. Wang: J. Comput. Phys. 186, 582 (2003).
13. P. Cloetens, W. Ludwig, J. P. Guigay, J. Baruchel, M. Schlenker, D. Van Dyck, in : X-ray tomography in material science, J. Baruchel, J.-Y. Buffière, E. Maire, P. Merle, G. Peix, Editors, p. 30. Hermès, Paris (2000).
14. P. Cloetens, W. Ludwig, J. Baruchel, D. Van Dyck, J. Van Landuyt, J. P. Guigay, M. Schlenker, Appl. Phys. Lett. 75, 2912 (1999).
15. J. H. Kinney, T. M. Breunig, T. L. Starr, D. Haupt, M. C. Nichols, S. R. Stock, M. D. Butts, R. A. Saroyan, Science 260, 789 (1993).
16. S.-B. Lee, S. R. Stock, M. D. Butts, T. L. Starr, T. M. Breunig, J. H. Kinney, J.
17. O. Coindreau, P. Cloetens, G. L. Vignoles, Nucl. Instr. and Meth. in Phys. Res. B 200, 295 (2003).
18. O. Coindreau, G. L. Vignoles, J. Mater. Res. 20, 2328 (2005).
19. M. Ando, S. Hosoya, in Proc. 6th Intern. Conf. On X-ray Optics and
Microanalysis, G. Shinoda, K. Kohra, T. Ichinokawa, Editors, p. 63, Univ. of
Tokyo Press, Tokyo (1972).
20. P. Cloetens, M. Pateyron-Salomé, J.-Y. Buffière, G. Peix, J. Baruchel, F. Peyrin, M. Schlenker, J. Appl. Phys. 81, 5878 (1997).
21. G. L. Vignoles, Carbon 39, 167(2001).
22. J. Martín-Herrero, C. Germain, Carbon 45, 1242 (2007).
23. C. Mulat, M. Donias, P. Baylou, G. L. Vignoles, C. Germain, J. Electronic
Imaging 17, 0311081 (2008).
24. G. L. Vignoles, J. Phys. IV France C5, 159 (1995).
25. M. Donias, G. L. Vignoles, C. Mulat, C. Germain, submitted to IEEE Trans. on
Visualization & Computer Graphics (2009).
26. O. Coindreau, G. L. Vignoles, J.-M. Goyhénèche, Ceram. Trans. 175, 77 (2005). 27. V. N. Burganos , S. V. Sotirchos, Chem. Eng. Sci 44, 2451 (1989).
28. G. L. Vignoles, O. Coindreau, A. Ahmadi, D. Bernard, J. Mater. Res. 22, 1537 (2007).
29. O. Coindreau, G. L .Vignoles, Mater. Sci. Forum 455-456, 751 (2004). 30. C. Mulat, PhD Thesis, University Bordeaux 1, France (2008).
31. S. Middleman, J. Mater. Res 4, 1515 (1989).
32. G. Vignoles, Advanced Engineering Materials, to appear (2009). 33. P.A. Rikvold, G. Stell, J. Colloid Interface Sci. 108, 158 (1985).
34. D. Bernard, G. L. Vignoles, in Computational methods for fluid flow and
Transport in porous media : Proc. Intl. Symp. on Computer Methods in Porous Media Engineering, J.-M. Crolet, Editor, Theory and Applications of Transport in Porous Media vol. 17, pp. 217-229, Kluwer Acad. Pub., Dordrecht (1999).
35. G. L. Vignoles, Adv. Sci. Technol. 50, 97 (2006).
36. G. L. Vignoles, C. Gaborieau, S. Delettrez, G. Chollon, F. Langlais, Surf. Coat.