C E N T R E D' ÉT U D E S E T D E R E C H E R C H E S S U R L E D E V E L O P P E M E N T I N T E R N A T I O N A L
SÉRIE ÉTUDES ET DOCUMENTS
Expanding Social Health Protection in Cambodia: An assessment of
the current coverage potential and gaps, and social equity
considerations
Robert Kolesar
Sambo Pheakdey
Bart Jacobs
Narith Chan
Samedy Yok
Martine Audibert
Études et Documents n° 3
February 2019
To cite this document:
Kolesar R., Pheakdey S., Jacobs B., Chan N., Yok S., Audibert M. (2019) “Expanding Social Health
Protection in Cambodia: An assessment of the current coverage potential and gaps, and social
equity considerations”, Études et Documents, n° 3, CERDI.
CERDI PÔLE TERTIAIRE 26 AVENUE LÉON BLUM F-63000 CLERMONT FERRAND TEL.+33473177400 FAX +33473177428 http://cerdi.uca.fr/
The authors
Robert KolesarSenior Health Financing Advisor, Health Policy Plus/The Palladium Group, Phnom Penh, Cambodia ; Senior Advisor, General Secretariat of the National Social Protection Council, Ministry of Economy and Finance, and Associate Researcher, Centre d’Études et de Recherches sur le Développement International (CERDI), Clermont-Ferrand. Email address: robertkolesar@outlook.com
Sambo Pheakdey
Under-secretary, General Secretariat of the National Social Protection Council, Ministry of Economy and Finance, Phnom Penh, Cambodia.
Bart Jacobs
Social Health Protection Policy Advisor, Deutsche Gesellschaft für Internationale Zusammenarbeit (GIZ), Phnom Penh, Cambodia.
Narith Chan
Secretary General, General Secretariat of the National Social Protection Council, Ministry of Economy and Finance, Phnom Penh, Cambodia.
Samedy Yok
Director, General Affairs, General Secretariat of the National Social Protection Council, Ministry of Economy and Finance, Phnom Penh, Cambodia.
Martine Audibert
Director of Research at CNRS, Université Clermont Auvergne, CNRS, IRD, CERDI, F-63000 Clermont-Ferrand, France.
Corresponding author: Robert Kolesar
This work was supported by the LABEX IDGM+ (ANR-10-LABX-14-01) within the program “Investissements d’Avenir” operated by the French National Research Agency (ANR).
Études et Documents are available online at:
https://cerdi.uca.fr/etudes-et-documents/
Director of Publication: Grégoire Rota-Graziosi Editor: Catherine Araujo-Bonjean
Publisher: Mariannick Cornec ISSN: 2114 - 7957
Disclaimer:
Études et Documents is a working papers series. Working Papers are not refereed, they constitute
research in progress. Responsibility for the contents and opinions expressed in the working papers rests solely with the authors. Comments and suggestions are welcome and should be addressed to the
3
Abstract
The Government of Cambodia recently launched its National Social Protection Policy
Framework to strengthen and expand its social protection system. To inform the future
direction of social health protection policy in Cambodia we examine the 2016 Cambodia
Socio-economic survey to assess the current coverage potential of existing health insurance
schemes and coverage gaps; and, compare fair and equitable contribution rates.
The current health coverage expansion efforts are likely to primarily benefit individuals from
higher income households. In addition, recent directives to expand coverage to some informal
workers leaves significant gaps, particularly among vulnerable groups, farmers, and the
self-employed. The average out-of-pocket health care costs exceed capacity to pay among
individuals in the lower wealth quintiles. Thus, we conclude they should be considered
financially vulnerable.
Finally, we illustrate that a fair and equitable approach to individual, monthly healthcare
contributions will yield low premium rates and collection costs could exceed the amount
collected, particularly among the informal sector. Therefore, we recommend that, in addition
to other vulnerable groups and uncovered households in the first wealth quintile, people
second and third quintiles who are not formally employed, should be exempted from premium
payments as social health protection is expanded.
Keywords
Social protection policy, Universal health care, Cambodia, social equity, Vulnerability.
JEL Codes
I13, I14, I18.
Acknowledgments
The authors would like to thank the Cambodia Ministry of Planning, Institute of Statistics for
providing the 2016 CSES data set which enabled the completion of this assessment.
Funding
This study was completed in part with financial support from the United States Agency for
International Development (USAID)/Cambodia under the Health Policy Plus (HP+) project,
Cooperative Agreement No. OAA-A-15-00051, technical support to the Cambodian Ministry
of Economy and Finance, National Social Protection Counsel General Secretariat. The
information, analysis, conclusions, and recommendations of this study are not official U.S.
Government information and does not necessarily represent the view or positions of the U.S.
Agency for International Development. Submission of the article for publication was the sole
decision of the authors.
Introduction
Cambodia has experienced more than two decades of strong economic growth with an average rate of 7.7% between 1995-2017 (World Bank 2018). In June 2016, the country was reclassified from a low-income to a lower-middle-low-income economy (World Bank 2016). In 2017, gross national low-income (GNI) per capita reached US$1,230 (World Bank 2018). Despite this progress, the World Bank estimates that around 4.5 million people, or nearly 28% of the population remain near-poor and vulnerable to falling back into poverty when exposed to economic and other shocks (World Bank 2018). Vulnerability to poverty has increased as a large proportion of the population is concentrated at the bottom of the wealth distribution (ADB 2014, OECD 2017).
Many countries are quickly extending social protection coverage (Ortiz 2018). The Royal Government of Cambodia (RGC) has established the reduction of poverty, vulnerability, and inequality as explicit policy goals in its National Social Protection Policy (NSPP) Framework 2016-2025 (RGC 2017). Aligning with the United Nations Sustainable Development Goals, the Framework’s strategy aims to protect all citizens and includes the development and expansion of health coverage schemes to achieve universal health care. The Cambodian Ministry of Health (MOH) estimates that the existing health coverage schemes can collectively cover about 4.7 million Cambodians or 30% of the population (MOH 2018). The MOH aims to increase coverage to 8.12 million or 50% of the population by 2020 (MOH 2016).
Presently, the Cambodian social health protection landscape includes insurance for civil servants’ and formally employed workers as well as social assistance with Health Equity Funds (HEF) for the poorest of the poor. The civil servants’ and formally employed workers’ schemes are managed by the National Social Security Fund (NSSF) under the Ministry of Labor and Vocational Training. NSSF is rapidly expanding enrollment in the worker and employee scheme: increasing the number of people covered from 265,761 in 2016 to 608,965 in 2017; enrolment is expected to exceed 1.2 million by the end of 2018. The contribution rate is set at 2.6% of the employee’s salary. Currently, premiums are all employer paid, thus minimizing the administrative and logistical burden of contribution collection. The civil servants scheme premium is calculated at 1% of the salary and paid by the state. These schemes do not presently include family members.
The Health Equity Fund (HEF), established to provide free access to healthcare for the poorest at the point of service delivery, is operated by the Ministry of Health (MOH) with claims and payment verification under the responsibility of a semi-autonomous Payment Certification Agency. Eligibility is primarily determined at the household level through a pre-identification ID poor system operated by the Ministry of Planning using community-based proxy means testing; pre-identification accounts for about 92% of enrollment. This system is complemented with a post-identification system enabling enrollment at the point of service delivery; post-identification accounts for about 8% of enrollment. As of 2017, approximately 2.6 million household members were covered under the HEF representing about 80.9% of the poorest quintile or 16.2% of the total population. More recently, free benefits under the HEF have been extended to some informal workers and selected populations (see below). However, there are large segments of the population that presently have no social health protection mechanism.
Health Equity Fund Extensions
In late 2017, the RGC issued Regulation 404, a joint legal directive expanding eligibility of HEF to some informal workers. This legal directive aimed to extend health coverage to approximately two million informal workers defined as individuals with a signed employment contract, which is for work not more than eight (8) hours a week, part-time, casual, or seasonal. In addition, coverage under this regulation requires that the individual has completed a registration process with the NSSF. In addition, special category beneficiaries were recently deemed eligible under other directives issued by the Ministries of Labor and Vocational Training (December 2017) and Health (January 2018). These beneficiaries include commune council members, village chiefs, deputy village chiefs, professional sport practitioners, and association members.
Towards Universal Health Coverage
Many low- and middle- income countries have adopted health financing reforms over the past decades with the intention of achieving universal health coverage and equity in financing of health care delivery (Asante, et al. 2016). The NSPP Framework’s stated focus on poor and vulnerable populations
establishes a clear policy directive for Cambodia’s expansion prioritization.
Vulnerability is defined as the forward-looking potential of harm due to risk exposure and the inability to manage risks and shocks (Alwang, Siegel and Jørgensen 2001, FAO 2010). Vulnerability is most commonly understood as financial vulnerability. However, income and assets are only one aspect of the various complex dynamics of human wellbeing (Mechanic and Tanner 2007, Edstrom 2007).
Vulnerability is multi-dimensional with risks relating to economic exclusion (financial), social exclusion and marginalization (societal), emotional disaffection (personal), discrimination (institutional), and health status (biological). These dimensions generally overlap: compounding the overall vulnerability of an individual, and thus their household (Luchenski, et al. 2017, Bradshaw and Finch 2003). These factors directly or in-directly impact on quality of life, especially income and assets. As such, each risk
dimension can exasperate vulnerability by affecting an individual, and therefore their household’s ability to cope with stressors and shocks: potentially undermining their economic security. For these reasons, the poorest, children under five years of age, pregnant women, People Living with HIV and AIDS (PLHIV), people with Tuberculosis (TB), the disabled, and the elderly are also considered vulnerable (ADB 2014). Among these vulnerable groups, only the poorest of the poor currently have a healthcare coverage mechanism. Finally, beyond the poorest, there is no consensus in Cambodia as to who is considered financially vulnerable, and therefore should be provided with free access to healthcare under the HEF.
The NSPP Framework also envisions the implementation of a health coverage scheme for nonpoor informal sector. Fairness in healthcare financial contributions is a central health system goal and a paramount consideration for the expansion of social health protection as social equity and solidarity are fundamental principles of the NSPP Framework (Murray, et al. 2002, RGC 2017). Murray and Frenk (1999) argue that for healthcare financial contributions to be fair households should not become impoverished or pay an excessive share of their income to obtain health care; and, lower income
households should pay less towards the health system than higher income households (Murray and Frenk 1999). Equity in healthcare financing can be characterized as vertical (financial contribution proportional
to capacity to pay) and horizontal (those of the same capacity to pay making the same contribution) (Wagstaff A 2000, Murray, et al. 2002, O’Donnell, et al. 2008). Vertical equity focuses on progressivity whereby healthcare contributions, as a proportion of income, rise as income increases (Amporfu 2013). Vertical equity can be assessed by the degree of inequality in paying for health care considering
individuals’ unequal ability to pay (O’Donnell, et al. 2008, Van Doorslaer, Wagstaff and Rutten 1993). We focus on vertical equity.
To plan for the expansion of social health protection it is imperative to understand the coverage potential of the current mechanisms, estimate the gaps vis-à-vis policy goals, and assess a fair and equitable approach to premium contributions within the current context. For example, decision-makers may ask: How many people do not yet have a coverage mechanism? Who is benefiting the most from the current expansion efforts focused on formal employees? How many informal workers are already eligible for coverage under the recent Health Equity Fund expansion? What would be an equitable approach to determining premium contributions?
To answer these questions and inform policy makers on the expansion of health insurance in Cambodia, we estimate vulnerable population and employment group sizes, review the poverty profile with a focus on the second and third quintiles; and, assess potential beneficiary contribution amounts using four approaches.
Data and methods
Data
We analyzed the 2016 Cambodia Socioeconomic Survey (CSES) dataset provided by the Ministry of Planning’s National Institute of Statistics. This survey is a nationwide representative sample which includes questions asked for the household and individual household members. The 2016 dataset contains records for 3,676 households with 10,746 individual working age adults.
Data was winsorized to bring income values below the first percentile to the first percentile and income values above the 97.5th percentile to the 97.5th percentile. This adjustment limits the influence of extreme
outliers in the analysis (Ghosh and Vogt 2012).
We adjusted the daily per capita international poverty line ($1.90) and the lower middle-income class poverty line (US$3.20) using the 2016 Cambodia Purchasing Power Parity (PPP) conversion factor for private consumption [1US$ PPP = 1643.3 Cambodian Riel (KHR)] (World Bank 2015). Local currency figures were converted to US$ using the standard CSES exchange rate of KHR4100 = US$1. These poverty metrics were used as benchmarks for wealth comparison.
Capacity to pay is defined as an individual’s effective income net subsistence expenditure (Murray, et al. 2002, Xu, et al. 2003).
The average monthly NSSF premium rate is based on the 2.6% *$170 US/month minimum wage for garment workers (US$63.53 per person per year) and the regulatory salary ceiling for premium collection of KHR1 million (US$76.10 per person per year).
Vulnerability group sizes for pregnant women and physically disabledi were estimated by applying 2014
Demographic Health Survey proportions for those groups to 2018 population projections (NIS 2017). Vulnerable age groups (i.e. children under five years, and seniors over 60 years) were taken directly from 2018 population projections. Elderly are defined as people aged 60 years or older as there is Cambodia specific evidence indicating households with people over 59 years of age are very vulnerable to out-of-pocket health care expenditures (Jacobs, de Groot and Fernandez Antunes 2016). Estimates for People Living with HIV/AIDS (PLHIV) and people with Tuberculosis (TB) were sourced from the World Health Organization Global Health Observatory (WHO 2018) and the Yale Global Health Review (Yale 2015), respectively. We used Stata 15.1 for all data management and analysis. All figures were prepared using Microsoft Excel 2016.
Variables employed
Employment Group Classification
We reviewed the CSES master survey questionnaire to establish inclusion criteria to identify employment groups among working age adults (age 15 to 59 years). To the degree possible, employment groups were defined to correspond to health scheme coverage eligibility. Individuals were assigned to one of eight employment groups: two formal sector groups (private and public workers); four informal sector groups (part-time, seasonal, farmers and fishermen, and self-employed); not-active adults; and, employers. Categorization was done following the inclusion/exclusion criteria detailed in table 1.
Table 1. Employment group inclusion and exclusion criteria among working age adults
There are four informal groups: part-time, seasonal, farmers, and self-employed. A part-time worker is defined as any employee who reported working more than 0 hours, but less than 40 hours per week; this is inclusive of individuals reporting employment less than 8 hours per week.ii Casual workers are
generally defined as employees with no guaranteed hours of work. As casual workers cannot be differentiated in the CSES data, we do not present them as a separate group. We adopt the CSES’ definition of seasonal work which is report of work done only part of the year with that same job
reoccurring every year. Finally, we consider farmers and fishermen (hereafter referred to only as farmers), and the self-employed as separate informal sector employment groups.
Employment
Group Exclusion/inclusion criteria
Public sector Individuals reporting government employment including civil servants and commune/village chiefs/administrators.
Employees Individuals reporting any non-government employment and working at least 40 hours in the past seven days.
Farmers (and fishermen)
Individuals who identified that the farm or fish products they produced in the last seven days in their main economic activity was mainly or only for sale.
Self-employed
Individuals reporting their main occupation or economic activity as working on their own account, as an unpaid family worker, or other, and reporting working hours during the past week, exempting farmers as defined here.
Part-time workers Individuals reporting being an employee and working less than 40 hours in the past seven days.
Seasonal employees
Individuals who identified their current or previous employment (within the past 13 months) as seasonal. Seasonal is work done part of the year but the same job is reoccurring every year. As per the CSES, examples of seasonal work include construction, tourism, and salt field workers.
Non-active/unemployed
Individuals who had no report of a main occupation or economic activity, or
reported working on their own account, as an unpaid family worker, or other, but did not report working any hours in the previous seven days and did not identify their most recent employment as seasonal.
Employers
Individuals who identified as such; these individuals were excluded from further analysis as they are not the focus of this study and are small in number (<1% of respondents).
Methods
Household survey consumption expenditure data is generally considered more reliable than income data. This is attributed to a variety of factors including underreporting as respondents may not wish to reveal their true income for privacy or other reasons. In addition, it is also recognized that income data is more vulnerable to random shocks. Therefore, over time the variance of current expenditure is smaller than the variance of current income (O’Donnell, et al. 2008, World Bank 2002, Xu, et al. 2003, Bouis 1994, Deaton 1992, NIS 2016). Furthermore, it is not unusual for households to report disposable income less than zero; this is because there is no standard in Cambodia on how to make depreciate expenditures for investments over time (NIS 2016). For these reasons, we use consumption expenditure as a proxy for effective income, particularly among the lower quintiles. All household level expenditure data was individualized (i.e. total household amount divided by the household size) to enable a direct comparison with the average NSSF premium rate.iii
However, we also recognize that consumption expenditure data does not enable a fair comparison of wealth at a population level as lower income individuals and households expend a greater proportion of their total income compared to their higher income counterparts. This issue is particularly problematic when analyzing data with a high wealth disparity (Lakner, et al. 2016). Therefore, we use total income to estimate the proportional distribution of wealth. Total income is defined as the sum of wages and salaries, self-employment, and property income, plus transfers received net transfers such as taxes, transfers to other households and for charity (NIS 2016).
We consider a person to be financially vulnerable if an average (one-month) out-of-pocket health care expense would reduce the average, monthly effective income of an individual to the poorest quintile. From the CSES survey data, we calculate the average monthly out-of-pocket health care treatment expenditure for working age adults among those with an expenditure at US$43.08 [95%CI: US$19.60 – US$66.58] for the second wealth quintile, and US$46.68 [95%CI: US$28.70 – US$64.65] for the third wealth quintile.
We use four approaches to illustrate fair and equitable health insurance contribution rates by wealth quintile and compare these rates with the average the NSSF individual monthly premium rate (US$5.29). First, we apply the NSSF fixed premium rate of 2.6% to effective income to illustrate a proportional income-based approach. This approximates the current approach used for formal employees, albeit the contribution is paid by the employer. We apply this approach to the mean effective income by wealth quintile and estimate an individual monthly contribution rate.
Proportional share of income = 2.6% * Mean_Effective_income quintile [Equation 1]
Second, we apply the NSSF fixed premium rate of 2.6% to calculate proportional share of capacity to pay (CTP) (mean effective income for each quintile net subsistence expenditure)
Proportional share of CTPquintile
Third, we calculate a weighted NSSF rate according to share of total income by wealth quintile; and, apply the weighted-rate to the mean effective income by wealth quintile to estimate an equitable approach.
Weighted NSSF rate𝑞𝑢𝑖𝑛𝑡𝑖𝑙𝑒 = ∑5𝑖=1(2.6%)∗ (
∑5𝑖=1𝑇𝑜𝑡𝑎𝑙_𝑖𝑛𝑐𝑜𝑚𝑒𝐻𝐻
∑𝑛𝑖=1𝑇𝑜𝑡𝑎𝑙_𝑖𝑛𝑐𝑜𝑚𝑒𝐻𝐻
) quintile
Equitable share of incomequintile
= Weighted NSSF rate quintile * Mean_Effective_income quintile
Fourth, we estimate equitable capacity to pay by reducing the mean effective income for each quintile by subsistence expenditure, and applying the weighted NSSF rate to CTP. Subsidence expenditure is based on $1.90 PPP per person per day which equates to $0.76 US per person per day for Cambodia.
Equitable CTPquintile =
(Mean_Effective_income quintile – subsistence expenditure) * weighted NSSF rate quintile
Results
Population Size Estimates
Vulnerable group size estimates
The vulnerable group populations, non-inclusive of the poor and financially vulnerable groups,
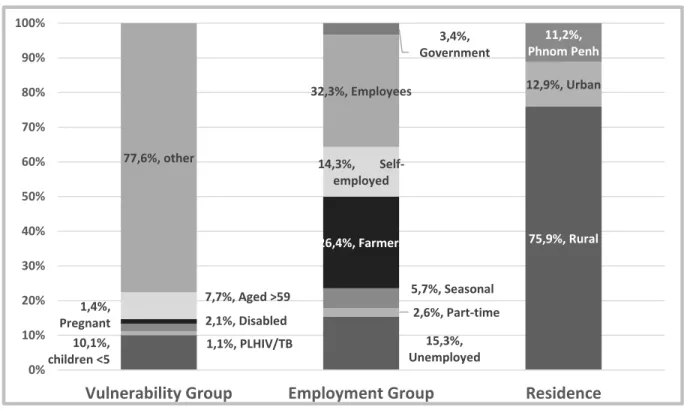
collectively amount to 22.4% of the total population or about 3.6 million people. This estimate includes about 1.6 million children under five years of age (10.1%), 225,000 pregnant women (1.4%), 175,000 People Living with HIV/AIDS/TB (1.1%), 337,000 disabled people (2.1%), and 1.24 million people over the age of 59 years (7.7%). As the source data for these estimates was not linked to the CSES data, it is not possible to segment these populations by wealth quintile.
[Equation 3]
[Equation 5] [Equation 4]
Figure 1. Population proportion estimates for vulnerable (non-income related), employment,
and residence groups
Employment group estimates
Cambodia’s population is predominately young and of working age. School aged children 5-15 represent 18.4% or nearly 3 million; and, working age adults aged 15-59 represent 63.8% of the total population or approximately 10.25 million adults (NIS 2017).
Figure 1 shows population proportion estimates among working age adults by employment group. About 15% of working age adults are not currently working. Part-time and seasonal workers, those explicitly covered under Regulation 404, are estimated to account for 8.3% or about 845,000. Farmers (and fishermen) constitute 26.4% or about 2.7 million, self-employed represent 14.3% or approximately 1.5 million, employees 32.3% or nearly 3.3 million; and public sector workers 3.4% or approximately 344,000.
Finally, over three-quarters of Cambodia’s population reside in the rural areas. About 11.2% of the population lives in Phnom Penh; and, 12.9% live in other urban centers.
10,1%, children <5 15,3%, Unemployed 75,9%, Rural 1,1%, PLHIV/TB 2,6%, Part-time 12,9%, Urban 2,1%, Disabled 5,7%, Seasonal 11,2%, Phnom Penh 1,4%, Pregnant 26,4%, Farmers 7,7%, Aged >59 14,3%, Self-employed 77,6%, other 32,3%, Employees 3,4%, Government 0% 10% 20% 30% 40% 50% 60% 70% 80% 90% 100%
Wealth profile by population and employment group
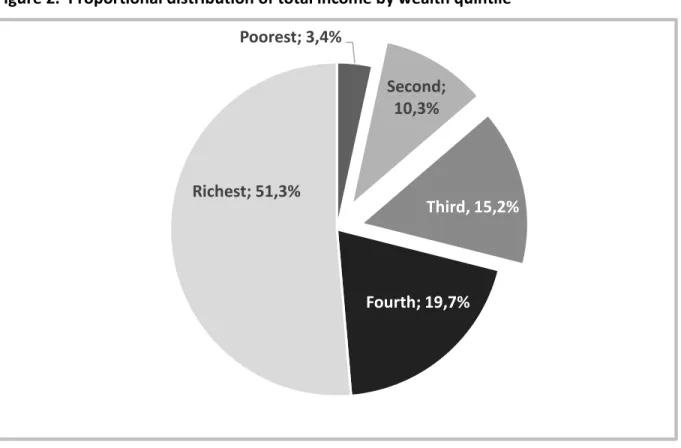
Figures 2 illustrates the distribution of total income by wealth quintile. The richest quintile accounts for 51.3% of total income. The fourth quintile has 19.7% of the total income wealth. Finally, the bottom three quintiles collectively have about 28.9% of the total income: 15.2% among the third quintile, 10.3% among the second quintile, and only 3.4% among the poorest.
Figure 2. Proportional distribution of total income by wealth quintile
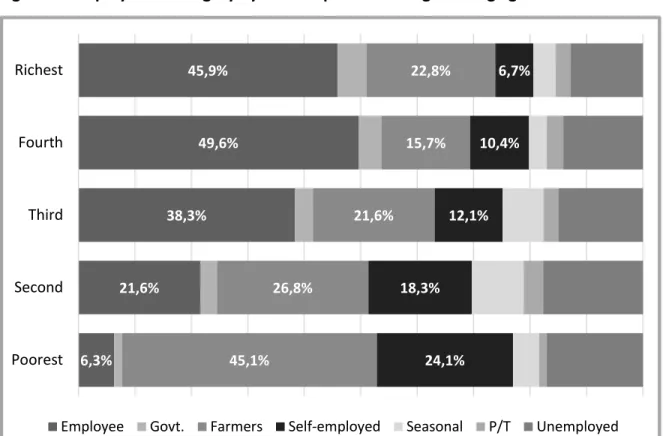
Nearly seven in 10 (69.2%) of the poorest are either farmers (45.1%) or self-employed (24.1%). These employment groups decrease as a proportion of adult workers as wealth quintile increases: 45.1% among the second quintile (26.8% farmers, and 18.3% self-employed); 33.6% among the middle quintile (21.6% farmers, and 12.1% employed); 26.1% among the fourth quintile (15.7% farmers, and 10.4% self-employed); and, 29.6% among the rich (22.8% farmers, and 6.7% self-employed). Inversely, the
proportion of full-time employees increases with wealth quintile: 6.3% among the poorest; 21.6% among the second quintile; 38.3% among the third quintile; 49.6% among the fourth quintile; and, 45.9% among the rich.
Poorest; 3,4%
Second;
10,3%
Third, 15,2%
Fourth; 19,7%
Richest; 51,3%
Figure 3. Employment category by wealth quintile among working age adults
[Notes: Govt = Public sector; P/T = Part-time]
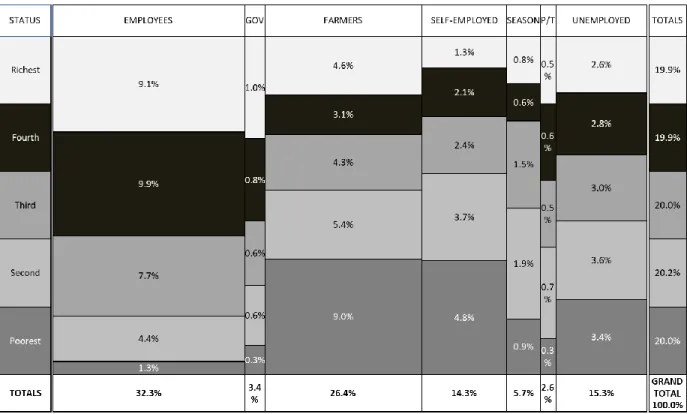
Figure 4 presents a population breakdown (in percent) by wealth quintile and employment group among working age adults. The height of the cell in each column corresponds to the wealth quintile proportion of the adult working age population for each employment category; the width of the column is
proportional to the total percent of the adult working age population in each employment group. This enables the identification of vulnerability within employment groups, particularly those who do not presently have a health insurance coverage option.
Employees, representing 32.3% of working age adults, predominately belong to higher income quintile households. Likewise, public sector employees tend to reside in higher income households, while they only represent 3.4% of the working age population. By contrast, farmers and self-employed adults represent large population segments (26.4% and 14.3% respectively) and are concentrated among the lower wealth quintiles. In addition, they are less wealthy then their seasonally employed and part-time counterparts who represent only 5.7% and 2.6% of the adult population, respectively. The unemployed are evenly distributed across wealth quintiles.
6,3% 21,6% 38,3% 49,6% 45,9% 45,1% 26,8% 21,6% 15,7% 22,8% 24,1% 18,3% 12,1% 10,4% 6,7% Poorest Second Third Fourth Richest
Figure 4. Population proportions by wealth quintile and employment group among working
age adults
[Notes: Gov = Public sector; Season = Seasonal; P/T = Part-time]
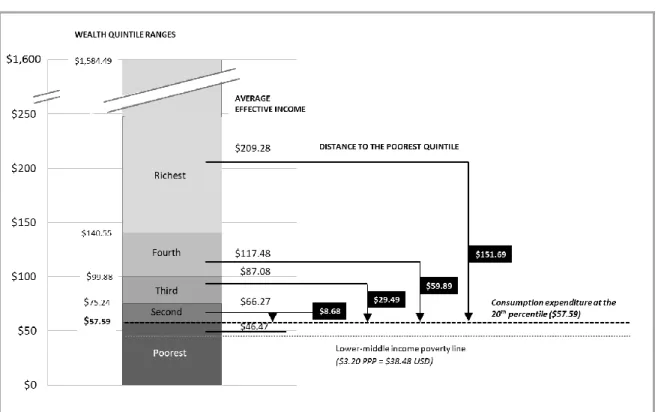
Figure 5 compares monthly individual effective income by wealth quintile. US$ amounts to the left of the stacked bar chart are the income cut-off points for each wealth quintile. US$ amounts to the right of the stacked bar chart are the average incomes by wealth quintile. Effective income under US$57.59 (or US$1.92 per day) falls under the 20th percentile or the poorest quintile (indicated with the black-dotted
line). The mean monthly effective income among the poorest individuals is US$46.47. This is slightly above the World Bank lower middle-income poverty line of $3.20 PPP, which is equal to US$38.48 for Cambodia (indicated with the grey-dotted line).
Figure 5. Monthly individual effective income by wealth quintile with averages and
differences to the poorest quintile in USD
The average effective monthly individual income for the second quintile is US$66.27 [range US$57.59-75.24]; the third quintile is US$87.08 [range US$75.24 – US$99.88]; the fourth is US$117.48 [range US$99.88 - US$140.55] and, the richest quintile’s effective income is US$209.28 [range US$140.44 - US$1,584.49]. Comparing the threshold for the poorest quintile with the average expenditure for other wealth quintiles reveals that the second quintile is only US$8.68 above the poorest, the third quintile is US$29.49. As the average monthly out-of-pocket health care expense exceeds these amounts (US$43.08 for the second wealth quintile, and US$46.45 for the third wealth quintile), these quintiles are considered financially vulnerable. By contrast, the fourth and richest quintiles are US$59.89 and US$151.69 above the poorest quintile, respectively.
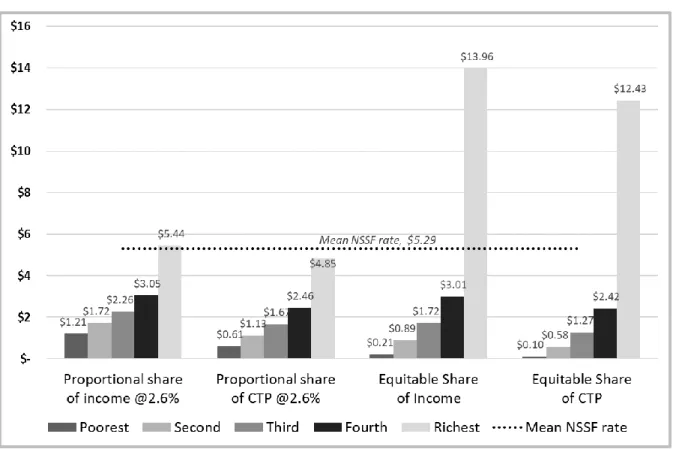
We assess a fair and equitable approach to premium contributions given the current context using four approaches (see Figure 6). First, we illustrate a proportional income-based approach by applying the NSSF fixed premium rate of 2.6% to effective income for each wealth quintile. This conservatively approximates the current approach used for formal workers and employees, albeit the rate is based on real income, and contribution is paid by the employer. We estimate an individual monthly premium rate to assess the contribution rate, particularly among lower income quintile households who comprise a higher proportion of informal workers. This approach results in the poorest individuals paying US$1.21 US; and, second and third quintile individuals premium rates to be, on average, US$1.72 and US$2.26, respectively. By contrast, the fourth and richest quintile individuals pay US$3.05 and US$5.44, respectively.
Figure 6. Proportional and equitable individual health insurance premium estimates
(monthly) by wealth quintile
Second, we estimate capacity to pay (CTP) by subtracting subsistence expenditure from effective income and apply the NSSF fixed premium rate of 2.6% for each wealth quintile. This results in an estimated individual monthly premium of US$1.13 for the second quintile, and US$1.67 for the third quintile. Third, we illustrate an equitable approach by weighting the NSSF rate following its proportional share of total income by wealth quintile (see Figure 2); then, we apply the weighted-rate to the average effective income by wealth quintile. This approach yields an estimated individual monthly premium of US$0.89 for the second quintile and US$1.72 for the third quintile.
Fourth, to illustrate an equitable capacity to pay (CTP) approach, we adjust effective income by subtracting subsistence expenditure and apply the weighted NSSF rate. This approach results in a monthly premium rate of just US$0.58, on average, for second quintile individuals; and, US$1.27, on average, for third quintile individuals.
Discussion
The expansion of legal coverage and enrolment entitling all people to access health services under publicly organized schemes is a critical step towards the achievement of universal health coverage (Knaul, et al. 2012, Scheil-Adlung and Bonnet 2011, C. Murray 2009). Cambodia’s social health
poorest of the poor. Current efforts to expand enrollment for formal employees has the potential to cover up to 3.3 million people. However, this coverage will primarily benefit individuals from higher income households. HEF is estimated to provide social health protection for about 2.6 million individuals, leaving about 600,000 people in the poorest quintile without coverage. In addition, recent directives to expand HEF could benefit about 845,000 part-time and seasonal workers. As these are relatively small sub-groups within the informal sector, there are still significant coverage gaps, particularly among vulnerable groups.
We estimate that about 8.8 - 9.8 million Cambodians do not yet have a social health protection mechanism. Collectively, uncovered vulnerable groups, defined as children under 5 years, pregnant women, the disabled, PLHIV/TB, and the elderly, constitute 22.4% of the total population or about 3.6 million people. Assuming that 20% of these populations are already covered under HEF reduces the estimate of uncovered vulnerable people to nearly 2.9 million. It is also important to note that school aged children 5-15 represent 18.4% of the population. An employment-based approach, if expanded to include the worker’s household, could also mitigate this coverage gap - representing a potential
opportunity to further increase enrollment by 1.66 million household membersiv. More conservatively,
costs could be offset by pooling funds or expanding coverage of the employer-based scheme to enroll vulnerable individuals who reside with a formal worker covered under that scheme.
In addition, farmers (26.4%) and self-employed (14.3%) are estimated to comprise about 40.7% or nearly 4.2 million adults. An examination of the second and third wealth quintile households reveals that nearly half (45.1% and 33.6%, respectively) are inhabited by farmers and self-employed- two employment groups with no coverage mechanism. There are about 932,500 and 686,500 farmers and self-employed in the second and third wealth quintiles, respectively.
In most developing economies the middle-income groups have very low incomes, necessitating inclusion in social protection schemes (Ortiz 2018). In Cambodia, the non-poor informal sector with capacity to pay into a contributory system is a relatively small group (OECD 2017). To assess financial
vulnerability, we compare the upper threshold for the poorest quintile with mean effective income for each other quintile. We find the average financial distance from falling into the poorest quintile is only US$8.68 US and US$29.49 per individual per month for the second and third wealth quintiles,
respectively. These amounts are insufficient to pay the average monthly out-of-pocket health care expense among working age adults seeking care which is estimated at US$43.08 and US$46.68, for the second and third wealth quintiles, respectively. Thus, we consider out-of-pocket health care cost to be an excessive share of income (O’Donnell, et al. 2008, Murray and Frenk 1999). As such, individuals within these quintiles can be considered financially vulnerable. This is consistent with a recent OECD study which found 55% of Cambodian households to be either poor or vulnerable using a vulnerability line at 1.5 times the level of the national poverty line. As a consequence, a relatively small income shock could dramatically raise the poverty rate (OECD 2017).
We also note that effective income may be a misleading measure of financial wellbeing as it does not account for debt which can increase consumption expenditure or decrease capacity to pay (i.e. effective income net subsistence expenditure) due to loan repayment obligations (O’Donnell, et al. 2008). Overall, 37% of Cambodian households hold outstanding debt averaging US$1,832. Rural areas have the highest proportion of indebted households (41.1%) compared with other urban areas (37.4%) and Phnom Penh
(7.9%) with an average outstanding loan of US$1,645, US$3,040, and US$3,128, respectively (NIS 2016). Also related, there is evidence that even relatively modest out‐of‐pocket health expenditure is a frequent cause of indebtedness and can lead to poverty in Cambodia (Van Damme, et al. 2004). The NSPP Framework envisions the implementation of a health coverage scheme for non-poor informal sector, initially voluntarily and then compulsory. Willingness to Pay (WTP) for voluntary health insurance premiums can limit enrollment and coverage, reducing access to health services, particularly among lower income quintile households (Dong, et al. 2005). A WTP study among informal sector workers in Vietnam found that less than half (48.8%) of uninsured households were willing to pay for family health insurance (Nguyen 2018). There is strong evidence demonstrating that voluntary health insurance programs for the non-poor informal sector have extremely low uptake (Cotlear, et al. 2015). These issues can undermine equity in access to healthcare. In addition, there is no clear enforcement mechanism by which to ensure enrollment under a compulsory approach for the informal sector. Finally, a recently published systematic review of WTP for health insurance in low and middle-income countries found that the WTP for healthcare insurance among rural households to be just below 2% of the GPD per capita (Nosratnejad, Rashidian and Dror 2016). In Cambodia, 2% of GPD per capita equates to US$14.98 per yearvor just US$3.48 per person per year.
Another important consideration is whether to pursue a contributory or non-contributory approach. Premiums can be charged at a flat rate, however this a highly regressive way of funding health care as lower income people will contribute a higher proportion of their income than wealthier people (Chuma, Mulupi and McIntyre 2013). Such vertical inequity could potentially undermine public trust and the expansion of social health protection. Informal workers could easily understand that they are paying a higher proportion of their income compared to their formally employed counterparts, especially as premium payments among the formally employed are at present fully paid by the employer.
We illustrate rational and fair individual monthly health care premium rates using four approaches that align with the NSPP Framework’s fundamental principles of equity and solidarity. These approaches reflect the current formal employee scheme rate of 2.6% of income, and account for individuals’ unequal ability to pay (Wagstaff A 2000, O’Donnell, et al. 2008). We find that the contribution rates are low for second and third wealth quintile individuals under all four scenarios: the rate ranges are
US$0.58-US$1.72 and US$1.27- US$2.26 per individual per month for the second and third quintiles, respectively. One may consider the comparative base rate of 2.6% to be excessively low. However, it is unlikely that this rate will be revised in the near to medium-term as current revenue collection is generating a large fund surplus for the employee scheme. Furthermore, as social security is expanded, other employer-based payments could be expected to be introduced: potentially crowding-out increases to the employee scheme rate.
Although there may be some economies of scale if households enroll multiple members, the low contribution rates raise the issue of collection feasibility and its associated costs. One of the primary challenges to extending healthcare coverage to informal sector workers, particularly in developing countries, is the logistical burden and associated administrative costs of premium collection (Wolfe, et al. 2014). There is evidence that national household premium collection programs, especially those that are voluntary, are administratively costly and have potential for regressive effects (Lagomarsino, Garabrant, et al. 2012, Mills, et al. 2012). This is because they require a strong administrative mandate and systems to track ability-to-pay (Bredenkamp, et al. 2015). As informal workers are occupationally and
generally do not typically pay income taxes- thwarting the potential for automated payments or deductions for premium collection. Theoretically, mobile payments, either using airtime or mobile money, can be used to collect premiums through payment reminders and self-payments via a mobile device (Saunders and Tappendorf 2014). However, the application of such a system has not yet been demonstrated in Cambodia.
The most logical approach to resolve these issues is to exempt premium payments among lower wealth quintile households who do not have another coverage mechanism. However, sub-targeting or
identification of these households will still be necessary and will likely present many challenges (Mills, et al. 2012). To address this issue, it is important to recall that Cambodia already has a well-developed ID poor system to assess household wealth. The ID poor targeting tool could be revised to facilitate identification of lower income quintile households for HEF enrollment.
Wagstaff found that social health insurance can easily cover the formal sector and the poor, however it is not effective at covering non-poor informal sector workers until the economy has reached a high level of economic development (Wagstaff 2009). A separate scheme for this population segment will face great challenges to sufficient revenue generation and adverse selection (OECD 2017). Many countries have struggled to effectively implement contributory schemes. For example, in Ghana, the National Health Insurance Scheme’s nationally set minimum payment amounts to just over US$5. However, authorities are unable to enforce the mandatory nature of contributions from the informal sector with those premiums amounting to only 4-5% of the cost of the scheme (Amporfu 2013, Chankova, Atim and Hatt 2010, Cotlear, et al. 2015, Schieber, et al. 2012).
In Mexico, the national Seguro Popular health insurance program initially set family contributions starting at $60 US (for the third income decile) to US$950 for families in the highest decile. However, very few people (<1%) make any premium contribution. The law has progressively exempted low-income households- originally the two poorest and later the four poorest low-income deciles as well as families in deciles four to seven with a pregnant woman or a young child (Han 2012, Knaul, et al. 2012, Cotlear, et al. 2015).
As the collection of insurance premiums from people in the informal sector is inefficient and unlikely to yield significant revenue, a focus on tax form for health is considered a more efficient and equitable approach (Oxfam 2013). In addition, there is evidence that tax-financed systems (i.e. those paid for primarily through public expenditure) tend to be proportional or mildly progressive, that social insurance systems (i.e. those paid for through enrollee contributions) are regressive, and that private systems are even more regressive (Wagstaff and van Doorslaer 1992).
Many countries have successfully expanded social health protection (Escobar, Griffin and Shaw 2010, Knaul, et al. 2012, Yiengprugsawan, et al. 2010). However, each countries’ path to universal health care is unique (Lagomarsino, Garabrant, et al. 2012). Progressive realization is a guiding principle for countries on their own path to universal coverage (Baltussen, et al. 2017). A phased approach for the gradual HEF expansion to vulnerable groups, including uncovered first wealth quintile households, as well as the financially vulnerable second and third wealth quintiles, aligns with the Cambodian
government’s incremental approach to policy making (Diaz Pedregal, Destremau and Criel 2015). This assessment of the current coverage potential, gaps, and social equity considerations in Cambodia can
enable decision-making and the development of health coverage expansion options to support the RGC’s national policy goal to reduce poverty, vulnerability and inequality.
Limitations
Due to limitations with the data set, it was not possible to analyze vulnerable (i.e. pregnant women, disabled) by wealth quintile or capacity to pay. As the source data for these estimates was not linked to the CSES data, it is not possible to segment these populations by wealth quintile.
We aligned employment categories, to the degree possible, with health coverage eligibility groups. In addition, we grouped currently non-eligible groups to create four major categories: unemployed, self-employed, farmers and fishermen, and employers. However, we recognize there is considerable heterogeneity within each category. For example, farmers and fishermen have different livelihoods as landownership is important for the former, and common property resources are important for the latter (Tong 2012). As our primary focus was on identifying healthcare coverage gaps, a more detailed poverty analysis of sub-employment categories was considered beyond the scope of this study.
Conclusion and recommendations
The Royal Government of Cambodia (RGC) has established national policy goals to reduce poverty, vulnerability, and inequality with social equity as a fundamental principle. The progressive expansion of social health protection should align with this principle: ensuring the costs of expanding coverage for universal health care do not present an undue burden on enrollees and that those costs are fairly distributed. In addition, it is important to consider the relative efficiency of premium collection, particularly among the informal sector population who do not currently have a coverage mechanism.
We assess the current coverage potential, gaps, and social equity considerations to advance decision-making for the progressive expansion of social health protection. First, we recommend that Cambodia pursue equitable access to healthcare through the gradual expansion of HEF coverage to include vulnerable groups, all households in the first quintile, and the economically vulnerable, non-formally employed second and third quintiles. To determine a specific policy approach, we recommend Cambodia complete cost and coverage modeling to provide options and a timeline for a phased coverage expansion. The information and parameter estimates presented in this paper are intended to support the proposed modeling.
Second, we recommend that Cambodia should gradually increase the regulatory ceiling for premium collection under the formal employees’ scheme. This is currently set at KHR1 million or US$243.90. Although the ceiling exceeds the mean income of the richest quintile (US$209.28), it is not an equitable approach as it favors the workers at the highest end of the wealth curve by capping their contribution. Increasing the premium ceiling would raise revenue to expand coverage- most logically to family members of formal employees’ already enrolled in the scheme. Minimally, the NSSF scheme should enroll vulnerable individuals who reside with a formal worker. Third, we recommend enabling higher income informal workers to voluntarily enroll and self-pay premiums for the current employees’ scheme.
to enable systematic progress monitoring of Cambodia’s investment, coverage, quality, and utilization towards the achievement of universal health coverage.
References
ADB. 2014. Cambodia Country Poverty Analysis . analysis , Mandaluyong City: Asian Development Bank. Alwang, J., P.B Siegel, and S.L. Jørgensen. 2001. Vulnerability: a View from Different Disciplines. Social
Protection Discussion Paper 0115, Washington D.C. : World Bank .
Amporfu, E. 2013. "Equity of the premium of the Ghanaian national." Journal for Equity in Health 12:4. Asante, A, J Price, A Hayen, S Jan, and V Wiseman. 2016. "Equity in Health Care Financing in Low- and
Middle-Income Countries: A Systematic Reivew of Evidence from Studies Using Benefit and Financing Incidence Analyses." PLoS ONE 11(4): e0152866.
https://doi.org/10.1371/journal.pone.0152866.
Baltussen, R, MP, Bijlmakers, L Jansen, N Tromp, Yamin A E, and O F Norheim. 2017. "Progressive realisation of universal health coverage: what are the required processes and evidence?" BMJ
Glob Health 2:e000342. doi:10.1136/ bmjgh-2017-000342.
Bouis, HE. 1994. "The effect of income on demand for food in poor countries: are our food consumption databases giving us reliable estimates?" Journal of Development Economics 44(1):199–226. Bradshaw, J, and N Finch. 2003. "Overlaps in Dimensions of Poverty." Journal of Social Policy Volume 32,
Issue 4, pp. 513-525.
Bredenkamp, C, T Evans, L Lagrada, J Langenbrunner, S Nachuk, and T Palu. 2015. "Emerging challenges in implementing universal health coverage in Asia." Social Science & Medicine 145:243-248. Chankova, S, C Atim, and L Hatt. 2010. "The Impact of Health Insurance in Low- and Middle-Income
Countries ." In Ghana's National Health Insurance Scheme, by ML Escobar, CC Griffin and RP Shaw, pp. 58-87. Washington D.C. : Brookings Institution Press.
Chuma, J, S Mulupi, and D McIntyre. 2013. "Providing financial protection and funding health service benefits for the informal sector: Evidence from sub-Saharan Africa ."
Cotlear, D, S Nagpal, O Smith, A Tandon, and R Cortez. 2015. Cotlear D, NagpalGoing Universal. How 24
developing countries are implementing universal health coverage reforms from the bottom up.
Washington D.C.: World Bank.
Deaton, A. 1992. Understanding consumption. Oxford: Oxford University Press.
Diaz Pedregal, V, B Destremau, and B Criel. 2015. "Health Policy in Cambodia: To What Extent Is an Aid-Dependent Country Able to Determine Its Own Policy? ." Journal of Social Policy 44:1:171-187. doi.org/10.1017/S0047279414000543.
Dong, H, B Kouyaté, J Cairns, and R Sauerborn. 2005. "Inequality in willingness-to-pay for community-based health insurance. ." Health Policy 149-156.
Edstrom, J. 2007. Rethinking ‘Vulnerability‘ and Social Protection for Children Affected by AIDS. IDS Bulletin Volume 38 Number 3, Institute of Development Studies.
Escobar, ML, CC Griffin, and RP Shaw. 2010. The Impact of Health Insurance in Low- and Middle-Income
Countries . Washington D.C. : Brookings Institution Press.
FAO. 2010. Food and Agriculture Organization of the United Nations, Vulnerability Assessment and
Analysis. Accessed 9 28, 2018. http://www.fao.org/elearning/#/elc/en/course/FV.
Ghosh, D, and A Vogt. 2012. "Outliers: An Evaluation of Methodologies, Survey Research Methods."
Joint Statistical Meetings 3455-3460.
Han, W. 2012. "Health Care System Reforms in Developing Countries." J Public Health Res 1(3):199-207. Jacobs, B, R de Groot, and A Fernandez Antunes. 2016. "Financial access to health care for older people
in Cambodia: 10-year trends (2004-14) and determinants of catastrophic health expenses."
International Journal for Equity in Health 15(94).
Knaul, FM, E Gonzalez-Pier, O Gomez-Dantes, D Garcia-Junco, and H Arreola-Ornelas. 2012. "The quest for universal health coverage: achieving social protection for all in Mexico ." Lancet 380:1259-79.
Lagomarsino, G, A Garabrant, A Adyas, and Otoo. 2012. "Moving towards Universal Health Coverage: Health Insurance Reforms in nine developing countries in Africa and Asia." Lancet.
Lagomarsino, G, A Garabrant, A Adyas, R Muga, and N Otoo. 2012. "Moving towards universal health coverage: health insurance reforms in nine developing countries in Africa and Asia." The Lancet Volume 380, Issue 9845, pp. 933-943.
Lakner, C, M Negre, J Cuesta, and A Silwal. 2016. The World Bank: Measuring inequality isn’t easy or
straightforward - Here’s why. March 11. Accessed December 12, 2018.
http://blogs.worldbank.org/developmenttalk/measuring-inequality-isn-t-easy-or-straightforward-here-s-why.
Luchenski, S, N Maguire, RW Aldridge, A Hayward, A Story, P Perri, J Withers, S Clint, S Fitzpatrick, and N Hewett. 2017. "Luchenski S, Maguire N, Aldridge RW, et al. 2017. What works in inclusion health: overview of effective interventions for marginalised and excluded populations." The
Lancet Volumn 391, Issue 10117, pp. 266-280.
Mechanic, D, and J Tanner. 2007. "Vulnerable people, groups, and populations: Societal view." Health
Affairs 26: 1220–30.
Mills, A, JE Ataguba, J Akazili, and et al. 2012. "Equity in financing and use of health care in Ghana, South Africa, and Tanzania: implications for paths to universal coverage." Lancet 380: 126–33.
MOH. 2018. "Cambodia Ministry of Health, Development of Social Health Protection." World Health Day
presentation, 5-6 April 2018. Phnom Penh.
MOH. 2016. Cambodia Ministry of Health, National Health Strategic Plan 2016-2020. National Strategy, Phnom Penh: Department of Planning and Health Information.
Murray, C JL, F Knaul, P Musgrove, K Xu, and K Kawabata. 2002. Defining and Measuring Fairness in
Financial Contribution to the Health System. Discussion Paper Series No. 24, Geneva: World
Murray, CJL. 2009. Assessing health system performance using information on effective coverage of
interventions. Working Paper Series 3, Brisbane: Health Information System Knowledge Hub.
School of Population Health, University of Queensland.
Murray, CJL, and J Frenk. 1999. A WHO Framework for Health System Performance Assessment. Evidence and Information for Policy, Geneva: World Health Organization.
Nguyen, Thi Thuy Nga. 2018. Family-based social health insurance for informal workers in Vietnam:
Willingness to pay and its determinants. PhD thesis, Queensland University of Technology.
NIS. 2016. National Institute of Statistics, Cambodia Socio-economic Survey. Survey Report, Phnom Penh: Ministry of Planning.
NIS. 2017. Population Projection of Cambodia 2013-2023. Population estimates, Phnom Penh: Cambodia Ministry of Planning, National Institute of Statistics.
Nosratnejad, S, A Rashidian, and DM Dror. 2016. "Systematic Review of Willingness to Pay for Health Insurance in Low and Middle Income Countries." PLoS One 11(6): e0157470.
O’Donnell, O, E Doorslaer, A Wagstaff, and M Lindelow. 2008. Analyzing Health Equity Using Household
Survey Data. www.worldbank.org/analyzinghealthequity, Washington DC: : The World Bank.
OECD. 2017. Social Protection System Review of Cambodia. OECD Development Pathways, Paris : OECD Publishing .
Ortiz, I. 2018. "The Case for Universal Social Protection ." Finance & Development 33-34.
Oxfam. 2013. Universal Health Coverage: Why health insurance schemes are leaving the poor behind. . 176 Oxfam Briefing Paper, Oxford: Oxfam GB.
RGC. 2017. " Royal Government of Cambodia, National Social Protection Policy 2016-2025." Phnom Penh.
Saunders, D, and T Tappendorf. 2014. Designing Mobile Microinsurance Products: Premium Payment
Methods. Consultative Group to Assist the Poor.
Scheil-Adlung, X, and F Bonnet. 2011. "Beyond legal coverage: assessing the performance of social health protection." Int Soc Sec Rev 64: 21–38.
Schieber, G, C Cashin, K Saleh, and R Lavado. 2012. Health Financing in Ghana. Directions in Development, Human Development Report 71894, Washington D.C. : World Bank.
Tong, K. 2012. Understanding Poverty Dynamics: Evidence from Nine Villages in Cambodia. research, Phnom Penh: Cambodia Development Resource Institute.
Van Damme, W, L Van Leemput, I Por, W Hardeman, and B Meessen. 2004. "Out-of-pocket health expenditure and debt in poor households: evidence from Cambodia." Tropical Medicine &
International Health 273-280.
Wagstaff A, Doorslaer EV. 2000. " Equity in health care finance and delivery." In Handbook of Health
Economics. 1Bth edition, by AJ Culyer and JP Newhouse, 18.3–1862. South Holland: Elsevier.
Wagstaff, A. 2009. "Social health insurance reexamined." Journal of Health Economics https://doi.org/10.1002/hec.1492.
Wagstaff, A, and E van Doorslaer. 1992. "Equity in the finance of health care: Some international comparisons." Journal of Health Economics Volume 11, Issue 4, pp. 361-387.
WHO. 2018. World Health Organization, Global Health Observatory data repository. 7 12. Accessed 10 29, 2018. http://apps.who.int/gho/data/node.main.620?lang=en.
—. 2018. World Health Organization, Health Financing: Monitoring Sustainable Development Goals –
Indicator 3.8.2. Accessed 10 29, 2018.
http://www.who.int/health_financing/topics/financial-protection/monitoring-sdg/en/.
Wilwohl, J. 2013. Cambodia Daily. Novermber 12. Accessed November 11, 2018.
https://www.cambodiadaily.com/news/world-bank-report-says-few-cambodians-using-bank-accounts-46844/.
Wolfe, R, D Mcintyre, K Hanson, and A Honda. 2014. Resilient & Responsive Health Systems, Covering the
Informal Sector: Report from a workshop on expanding access to health services and financial protection for people outside the formal employment sector. Technical Report , London: London
School of Hygiene & Tropical Medicine .
World Bank . 2002. "Guildelines for Constructing Consumption Aggregates for Welfare Analysis, Living Standards Measurement Study Working Paper No. 135."
World Bank. 2016. Cambodia is now a lower-middle income economy: What does this mean? August 11. Accessed November 25, 2018. http://blogs.worldbank.org/eastasiapacific/cambodia-is-now-a-lower-middle-income-economy-what-does-this-mean.
—. 2015. FAQs: Global Poverty Line Update. September 30. Accessed October 29, 2018. http://www.worldbank.org/en/topic/poverty/brief/global-poverty-line-faq. —. 2018. The World Bank In Cambodia. September 27. Accessed October 29, 2018.
http://www.worldbank.org/en/country/cambodia/overview.
Xu, K, J Klavus, K Kawabata, DB Evans, P Hanvoravongchai, JP Ortiz, R Zeramdini, and CJL Murray. 2003. "Chapter 39. Household Health System Contributions and Capacity to Pay: Definitional,
Empirical, and Technical Challenges, Chapter 39, pp. 533-542. In: Health systems performan." In
Health systems performance assessment: debates, methods and empiricism, 533-542. Geneva:
World Health Organization.
Yale. 2015. The Yale Global Health Review, Southeast Asia: Regional Incidence of Tuberculosis in
Cambodia. April 26. Accessed October 29, 2018.
https://yaleglobalhealthreview.com/2015/04/26/southeast-asia-regional-incidence-of-tuberculosis-in-cambodia/.
Yiengprugsawan, V, M Kelly, S Seubsman, and AC Sleigh. 2010. "The first 10 years of the Universal Coverage Scheme in Thailand: review of its impact on health inequalities and lessons learnt for middle-income countries." Australasian Epidemiologist Volume 17, Issue 3, pp. 24-26.
i Physical disability is defined as report of a lot of difficulty or cannot do any of the following domains: seeing, hearing, walking, concentrating, self-care, and/or communicating.
ii Due to the limited number of working age adults reporting being an employee and working less than 8 hours in the past week, we collapsed this category into “part-time”.
iii This rate was established in 2011 and was not based on the actual cost of the provision on care (i.e. services reimbursed by NSSF as still subsidized by the state through the health sector.
iv Total unduplicated HHs with formal employee(s)* mean (unduplicated) HH size of formal employees (4.89) net total estimate of formal employees (already eligible for insurance coverage)
vGDP per capita (constant LCU) 3,069,876/4100 = $748.75*2% =$14.98