HAL Id: hal-03137014
https://hal.archives-ouvertes.fr/hal-03137014
Submitted on 10 Feb 2021
HAL is a multi-disciplinary open access
archive for the deposit and dissemination of
sci-entific research documents, whether they are
pub-lished or not. The documents may come from
teaching and research institutions in France or
abroad, or from public or private research centers.
L’archive ouverte pluridisciplinaire HAL, est
destinée au dépôt et à la diffusion de documents
scientifiques de niveau recherche, publiés ou non,
émanant des établissements d’enseignement et de
recherche français ou étrangers, des laboratoires
publics ou privés.
Distributed under a Creative Commons Attribution - NonCommercial - NoDerivatives| 4.0
International License
iPSC-derived retinal pigment epithelium of a
choroideremia patient
Nicolas Cereso, Marie Péquignot, Lorenne Robert, Fabienne Becker, Valerie de
Luca, Nicolas Nabholz, Valérie Rigau, John de Vos, Christian Hamel, Vasiliki
Kalatzis
To cite this version:
Nicolas Cereso, Marie Péquignot, Lorenne Robert, Fabienne Becker, Valerie de Luca, et al.. Proof
of concept for AAV2/5-mediated gene therapy in iPSC-derived retinal pigment epithelium of a
choroideremia patient. Molecular Therapy - Methods & Clinical Development, 2014, 1, pp.14011.
�10.1038/mtm.2014.11�. �hal-03137014�
www.nature.com/mtm
INTRODUCTION
Inherited retinal dystrophies (IRDs) comprise a large group of dis-eases that are genetically and clinically heterogeneous. They are characterized by progressive vision loss; however, the age at which legal blindness is reached is variable. Although individually rare, col-lectively IRDs affect ~1 in 2,000 individuals worldwide.1 The most
prevalent form of IRD is the group of pigmentary retinopathies, which are characterized by degeneration of the photoreceptor cells of the retina and the presence of pigment deposits visible on the fundus. The majority of these disorders, of which a good example is choroideremia, are due to loss-of-function mutations with reces-sive or X-linked inheritance, making them ideal candidates for gene replacement strategies.2
The retina in general is highly amenable to gene therapy because (i) it is accessible via noninvasive routes; (ii) it is small and enclosed, allowing the use of low vector doses; and (iii) the presence of a blood–retina barrier—composed of the tight junctions of the reti-nal pigment epithelium (RPE), the Bruch membrane, and the non-fenestrated capillaries of the retinal circulation—prevents leakage into the circulation and renders it immunoprivileged.3 These
posi-tive attributes led to the first clinical trials for retinal gene therapy in 2008,4,5 which were rapidly followed by others.6–9 The targeted IRD
was Leber congenital amaurosis type 2 (LCA2), caused by mutations
in the RPE-specific gene, RPE65,10 which encodes a key enzyme of
the visual cycle. RPE65 was successfully vehicled into the RPE using a recombinant adeno-associated virus serotype-2 (AAV2/2) vec-tor. The positive results provided the proof of concept that AAV-mediated gene transfer can ameliorate sight in visually impaired subjects and thereby paved a path toward clinical trials for other retinal diseases.
Before clinical trials, preclinical trials are usually performed on animal models. In the case of LCA2, there exist both mouse11,12
and canine13 models. However, for other IRDs, appropriate
ani-mal models do not exist. Although many mouse models have been generated that are defective for a gene causing a spe-cific IRD, certain of these models are asymptomatic or do not fully reproduce the human disease. A pertinent example is the Usher-1 disease models,14 for which the lack of a phenotype was
recently explained by the observation that mice lack photore-ceptor calyceal processes that house the Usher 1 proteins in the primate retina.15 In general, dog models are more faithful than
mouse models because the canine retina resembles the human eye in both size and structure, and many retinal diseases in humans have canine counterparts.16 However, for many diseases,
the identification of a corresponding canine model has proven elusive.
Received 20 December 2013; accepted 24 February 2014
2329-0501
14011
Molecular Therapy — Methods & Clinical Development
10.1038/mtm.2014.11
1
20December2013
24February2014
2014
© 2014 The American Society of Gene & Cell Therapy
Gene transfer corrects human iPSC-derived RPE
N Cereso et al.
Inherited retinal dystrophies (IRDs) comprise a large group of genetically and clinically heterogeneous diseases that lead to progressive vision loss, for which a paucity of disease-mimicking animal models renders preclinical studies difficult. We sought to develop pertinent human cellular IRD models, beginning with choroideremia, caused by mutations in the CHM gene encoding Rab escort protein 1 (REP1). We reprogrammed REP1-deficient fibroblasts from a CHM-/y patient into induced pluripotent stem cells
(iPSCs), which we differentiated into retinal pigment epithelium (RPE). This iPSC-derived RPE is a polarized monolayer with a clas-sic morphology, expresses characteristic markers, is functional for fluid transport and phagocytosis, and mimics the biochemical phenotype of patients. We assayed a panel of adeno-associated virus (AAV) vector serotypes and showed that AAV2/5 is the most efficient at transducing the iPSC-derived RPE and that CHM gene transfer normalizes the biochemical phenotype. The high, and unmatched, in vitro transduction efficiency is likely aided by phagocytosis and mimics the scenario that an AAV vector encounters
in vivo in the subretinal space. We demonstrate the superiority of AAV2/5 in the human RPE and address the potential of patient
iPSC–derived RPE to provide a proof-of-concept model for gene replacement in the absence of an appropriate animal model.
Molecular Therapy — Methods & Clinical Development (2014) 1, 14011; doi:10.1038/mtm.2014.11; published online 2 April 2014
The first two authors contributed equally to this work.
1Inserm U1051, Institute for Neurosciences of Montpellier, Montpellier, France; 2University of Montpellier 1, Montpellier, France; 3University of Montpellier 2, Montpellier, France; 4Inserm U1040, Institute for Research in Biotherapy, Montpellier, France; 5Department of Ophthalmology, CHRU, Montpellier, France; 6Department of Anatomy and Pathological
Cytology, CHRU, Montpellier, France; 7Cellular Therapy Unit, CHRU, Montpellier, France; 8Centre of Reference for Genetic Sensory Diseases, CHRU, Montpellier, France. Correspondence:
V Kalatzis (vasiliki.kalatzis@inserm.fr)
Proof of concept for AAV2/5-mediated gene therapy in
iPSC-derived retinal pigment epithelium of a choroideremia patient
Nicolas Cereso1-3, Marie O Pequignot1-3, Lorenne Robert1-3, Fabienne Becker4, Valerie De Luca1-3, Nicolas Nabholz1-3,5, Valerie Rigau6,
John De Vos2-4,7, Christian P Hamel1-3,5,8 and Vasiliki Kalatzis1-3
2
An example of an IRD that lacks an appropriate mouse or canine model is choroideremia (CHM). CHM is an X-linked pigmentary reti-nopathy that represents 2% of IRD patients.17 It is characterized by
night blindness in childhood, followed by progressive loss of the visual field resulting in blindness by 40–50 years of age. CHM has a characteristic phenotype, comprising pigment deposits and an atrophy of the choriocapillaris of the choroid, situated just behind the retina. There is a single causative gene, CHM, which encodes REP1, Rab escort protein-1,18 a ubiquitous chaperone protein
allow-ing the correct prenylation of Rab guanosine triphosphatases (GTPases) and subsequent delivery to their membrane targets. The first Rep1-deficient mouse model of the disease was lethal19 due to
defective trophoblast development and vascularization in mouse
extraembryonic tissues20; a Rep1-deficient zebrafish model was also
lethal.21 An attempt to identify a canine model was unsuccessful,22
suggesting that CHM mutations may be lethal in this species also. To overcome the lethality associated with ubiquitous Rep1 deficiency, Seabra et al.23,24 generated conditional Rep1-deficient
mouse models. However, these models do not strictly reproduce the disease observed in human males and have been uninforma-tive in terms of restoring a normal phenotype in gene replace-ment studies.25 By contrast, the study of the conditional CHM
models has been more informative in terms of pathophysiology and suggests that the disease occurs in both the photoreceptors and the RPE, but that the defect in the RPE accelerates photore-ceptor degeneration.
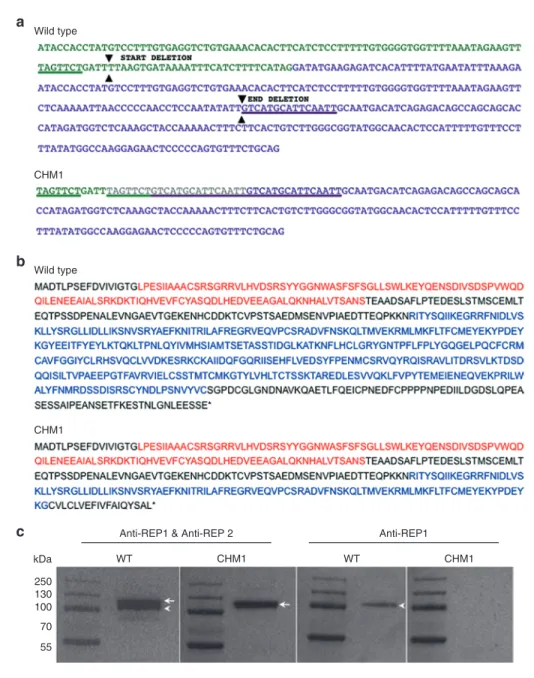
Figure 1 Characterization of the CHM deletion of patient CHM1. (a) The sequence of exon 7 of the CHM gene is indicated in green, and the sequence
of exon 8 is indicated in purple. The 7-bp sequence (underlined in green) in exon 7, and the 15-bp sequence in exon 8 (underlined in purple), which are duplicated in the DNA of CHM1 are positioned on the wild-type complementary DNA (cDNA) sequence. The limits of the resulting deletion (arrowheads) are also indicated. The duplicated and deleted cDNA sequences of patient CHM1 for the corresponding region are shown. The inserted sequence is in gray. (b) The wild-type REP1 sequence of 653 aa containing two guanosine diphosphate (GDP) dissociation inhibitor (GDI) domains, indicated in red and blue. The truncated REP1 sequence is predicted to be 332 aa long and to contain a truncated second GDI domain (in blue). (c) Western blot analysis with an antibody recognizing both REP1 and REP2 detects two bands that migrate at ~110 (arrowhead) and 120 (arrow) kDa, respectively, in wild-type cells. In the cells of CHM1, only the larger band corresponding to REP2 (arrow) is detected. This was confirmed using an antibody specific to REP1, which detected a single band in wild-type cells (arrowhead) and no band in CHM1 cells. REP1, Rab escort protein 1.
Wild type
Wild type CHM1
CHM1
Anti-REP1 & Anti-REP 2 Anti-REP1
WT CHM1 WT 55 70 100 130 250 kDa CHM1
a
b
c
3 In the absence of an appropriate CHM model for
proof-of-con-cept studies, we developed a human retinal cell model of the dis-ease. Because it is impossible to obtain retinal cells from a living patient, we generated a CHM-specific RPE from patient skin fibro-blasts via the intermediate generation of induced pluripotent stem cells (iPSCs).26 We characterized the bona fide CHM RPE in terms of
morphology and function and showed that it mimics the biochemi-cal defect in CHM patients. Furthermore, we assayed a panel of AAV vector serotypes (2/2, 2/4, 2/5, 2/8, and 2/9) for their ability to effec-tively transduce the RPE and generated a CHM-carrying vector from the most efficient serotype (AAV2/5). Finally, we provide the proof of concept that AAV2/5-mediated CHM gene therapy can effectively restore a normal cellular phenotype in human RPE.
ReSUlTS
Characterization of patient mutation
The characterization of genomic DNA from the fibroblasts of patient CHM1 revealed a duplication of a 7-bp (TAGTTCT) sequence in intron 7 situated 40 bp upstream of the start of exon 8. In between the duplicated sequence was a 4-bp insertion (GATT) (Figure 1a). This first duplication was followed by a second duplication of a 15-bp sequence within exon 8 (GTCATGCATTCAATT), situated 68 bp after the start. The 97 bp situated between the two duplicated sequences, which comprised the end of intron 7 and the beginning of exon 8, were deleted. The loss of the intron 7 acceptor splice site and the subsequent deletion of exon 8 resulted in a predicted frameshift at amino acid (aa) position 314 and a premature stop codon at position 332 (wild-type REP1 is 653 aa long), truncating the second guanosine
diphosphate dissociation inhibitor domain of REP1 (Figure 1b). Western blot analysis with an antibody directed against an N-terminal epitope present in both wild-type and truncated REP1 (73.49 kDa), as well as in REP2 (74.08 kDa), detected two bands for the control cells and one band for the CHM1 cells (corresponding to REP2), suggest-ing that the truncated protein was unstable (Figure 1c). Consistently, western blot analysis using a REP1-specific antibody did not detect a protein in CHM1 cells as opposed to the results in control cells
Taken together, these results showed that the mutation carried by patient CHM1 abolished REP1 protein production.
Generation and validation of patient-specific iPSCs
We used doxycycline-inducible lentiviral vectors carrying the Yamanaka transcription factor cocktail (c-MYC, KLF4, OCT4, and SOX2) to reprogram CHM1 fibroblasts (Figure 2a). We verified the expression of each transgene 24 hours after doxycycline induction by quantitative polymerase chain reaction (q-PCR) studies (Figure 2b). One week after doxycycline induction, the fibroblasts began to change morphology, with partially reprogrammed colonies appear-ing and disappearappear-ing over time. By contrast, 5 weeks after doxycy-cline induction, a morphologically characteristic iPSC colony was detected (Figure 2c), which survived mechanical passaging into embryonic stem (ES) cell media without doxycycline. PCR amplifica-tion of CHM1 iPSC DNA showed that the original CHM deleamplifica-tion was present (Figure 2d) and that it led to the complete deletion of exon 8 from the mRNA, as evidenced by a difference of 226 bp between the complementary DNA (cDNA) fragments generated from wild-type and CHM1 iPSC RNAs (Figure 2e). In addition, the CHM1 iPSCs did not
Figure 2 Generation of CHM1 iPSCs. (a) Fibroblasts of patient CHM1 in culture. Bar = 100 µm. (b) Lentiviral transduction and doxycycline induction
results in the expression of the four reprogramming factors, as determined by quantitative polymerase chain reaction analysis. (c) Successful reprogramming results in the detection of an iPSC colony composed of tightly packed cells with a clear border separating them from the underlying fibroblasts. Bar = 200 µm. (d) The deletion in CHM1 results in the amplification of exons 7 and 9 in patient fibroblasts (Fib) and iPSCs, but in the absence of exon 8, as opposed to the situation in wild-type (WT) DNA; − indicates negative control. (e) At the complementary DNA (cDNA) level, the CHM1 transcript is 226 bp smaller, corresponding to the deletion of exon 8. (f) No large chromosomal anomalies in CHM1 iPSCs were detected by karyotype analysis. iPSC, induced pluripotent stem cell.
0 SOX2 cMYC KLF4 Transgene WT 1 6 7 8 9 10 11 12 13 14 15 16 17 18 19 20 21 22 X Y 2 3 4 5 CHM1 − WT Fib iPSC CHM1 Exon 9 − OCT4 −DOX +DOX 0.1 0.2 Relativ e units 0.3 0.4 0.5 Exon 8 WT Fib iPSC CHM1 − Exon 7 WT Fib iPSC CHM1 −
a
d
e
f
b
c
4
present any large chromosomal anomalies that may occur during reprogramming, as shown by karyotype analysis (Figure 2f).
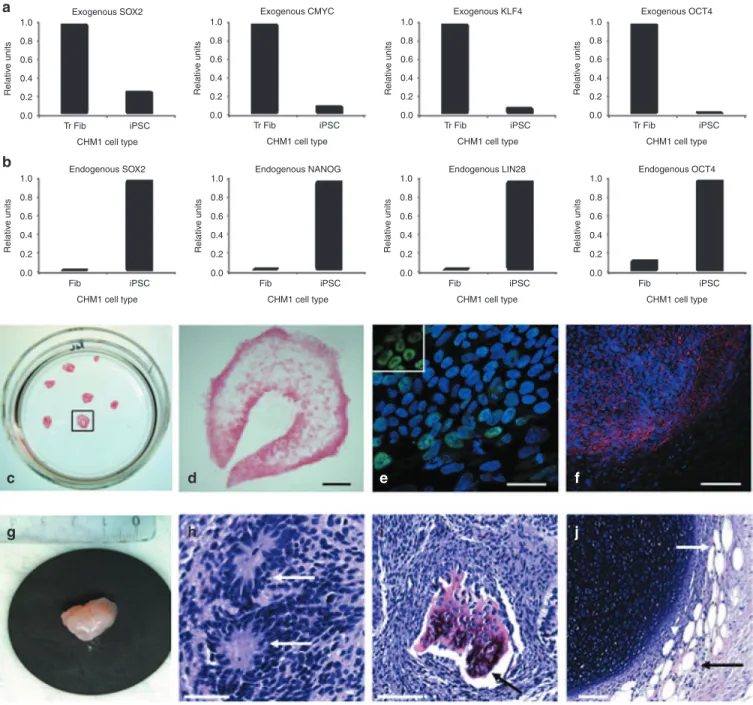
The pluripotency of the CHM1 iPSCs was verified by a variety of techniques and using a wild-type clone M4C7 (ref. 27) as a positive control. For a cell to be considered as correctly reprogrammed to a pluripotent state, host pluripotency genes need to be activated, in the absence of expression of exogenous pluripotency genes, and their encoded proteins need to be produced. First, at the mRNA level, q-PCR studies demonstrated the silencing of exogenous c-MYC, KLF4, OCT4, and SOX2 delivered by the lentiviral vectors
(Figure 3a) and the activation of expression of endogenous OCT4, SOX2, LIN28, and NANOG in the CHM1 iPSCs (Figure 3b). Second, alkaline phosphatase staining was positive (Figure 3c,d), and immu-nofluorescence (IF) studies confirmed the expression of NANOG (Figure 3e) and indicated the expression of SSEA3 (Figure 3f). Finally, the CHM1 iPSCs induced the formation of teratomas (Figure 3g) when injected subcutaneously into immunodeficient mice and the presence of derivatives of the three germ layers (ectoderm (Figure 3h), mesoderm (Figure 3i), and endoderm (Figure 3j)) was confirmed by histological analysis.
Figure 3 Characterization of CHM1 iPSCs. (a) Downregulation of the expression of the pluripotency genes delivered by the lentiviral vectors in iPSCs,
compared with the expression in transduced fibroblasts (Tr Fib), as detected by q-PCR analysis. (b) Activation of the host’s endogenous pluripotency genes in iPSCs, as compared with fibroblasts (Fib), as shown by q-PCR analysis. (c) Expression of the pluripotency marker alkaline phosphatase by cell staining. (d) Magnification of the colony boxed in c. Bar = 500 µm. (e) Expression of the nuclear pluripotency marker NANOG (in green), as shown by immunofluorescence studies and merged with a Hoechst staining of the nuclei (in blue). Bar = 50 µm. Inset, nuclear expression of NANOG exclusively. (f) Expression of the pluripotency marker SSEA3 (in red) merged with Hoechst staining of the nuclei. Bar = 200 µm. Subcutaneous injection of CHM1 iPSCs into immunodeficient mice results in the formation of (g) teratomas that contain derivatives of the three germ lines: (h) neuroblastic rosettes (arrows) that are ectodermal in origin (bar = 50 µm); (i) osteocytes (arrow) that are mesodermal in origin (bar = 100 µm), and (j) adipose cells (arrows) that are endodermal in origin (bar = 100 µm). iPSC, induced pluripotent stem cell; OCT4, octamer binding transcription factor 4; SOX2, sex determining region Y-box 2.
0.0 Tr Fib iPSC CHM1 cell type Exogenous SOX2 0.2 0.4 Relativ e units 0.6 0.8 1.0 0.0 Fib iPSC CHM1 cell type Endogenous SOX2 0.2 0.4 Relativ e units 0.6 0.8 1.0 0.0 Fib iPSC CHM1 cell type Endogenous NANOG 0.2 0.4 Relativ e units 0.6 0.8 1.0 0.0 Fib iPSC CHM1 cell type Endogenous LIN28 0.2 0.4 Relativ e units 0.6 0.8 1.0 0.0 Fib iPSC CHM1 cell type Endogenous OCT4 0.2 0.4 Relativ e units 0.6 0.8 1.0 0.0 Tr Fib iPSC CHM1 cell type Exogenous CMYC 0.2 0.4 Relativ e units 0.6 0.8 1.0 0.0 Tr Fib iPSC CHM1 cell type Exogenous KLF4 0.2 0.4 Relativ e units 0.6 0.8 1.0 0.0 Tr Fib iPSC CHM1 cell type Exogenous OCT4 0.2 0.4 Relativ e units 0.6 0.8 1.0
a
b
c
d
e
f
g
h
i
j
5 In conclusion, we generated bona fide iPSCs of a CHM patient.
Generation and validation of patient-specific RPE
We used a spontaneous differentiation protocol to generate RPE from wild-type M4C7 and CHM1 iPSCs. Approximately 15 days after
the iPSCs were cultured to confluence and the basic fibroblast growth factors were removed from the media, pigmented foci appeared in the plates (Figure 4a). These foci were mechanically passaged, and at confluence, from passage (P) 2, gave rise to a homogeneous layer of polygonal pigmented cells (Figure 4b) characteristic of RPE. Seeding
Figure 4 Generation and characterization of iPSC-derived RPE. (a) Pigmented foci in confluent iPSC plates following bFGF depletion (arrowheads).
(b) At confluence, passaged pigmented foci form a layer of polygonal pigmented cells. Bar = 100 µm. (c) Semi-thin section of iPSC-derived epithelium cultured on a porous filter and stained with toluidine blue demonstrates a regular monolayer (in blue) superposed on the filter (in white). Bar = 50 µm. (d) Transmission electron microscopy shows the iPSC-derived monolayer as a polarized epithelium with microvilli (m) on the apical side, desmosomes (arrowheads) at the apical junctions, melanosomes (asterisks) distributed throughout the cytosol, a nucleus (n) on the basal side, and a basal lamina (arrow) between the epithelium and the filter. Bar = 2 µm. (e) Expression of classic RPE genes, as determined by reverse transcriptase (RT)–polymerase chain reaction analysis in both wild-type (WT) and patient (CHM1) RPEs in the presence of RT (+RT). In the absence of RT (−RT) or complementary DNA (cDNA) (−), an amplicon was not detected. Immunofluorescence studies of the RPE monolayer, followed by confocal analysis, demonstrate the expression of (f) MERTK in the microvilli (in red), (g) CRALBP and (h) RPE65 in the cytoplasm (in green), and (i) ZO-1 at the apical junctions (in red). Bars = 100 µm (in f, g), 30 µm (in h), and 50 µm (in i). Apicobasal fluid transport causes the RPE to form fluid-filled domes, detaching it from the cell culture plate: (j) focus on the RPE adhered to the plate; (k) focus on the RPE at the top of the dome. Bars = 100 µm. (l) Confocal analysis of the RPE 6 hours postincubation with FluoSpheres showing the internalized beads (in green), nuclei (in blue), and F-actin (in red). Bar = 15 µm. (m) Flow cytometry analysis showing the percentage of RPE cells that internalized FluoSpheres over time. bFGF, basic fibroblast growth factor; BEST1, bestrophin 1; CRALPB, cellular retinaldehyde-binding protein; GAPDH, glycerglyceraldehyde 3-phosphate dehydrogenase; iPSC, induced pluripotent stem cell; LRAT, lecithin retinol acyltransferase; MERTK , C-mer proto-oncogene tyrosine kinase; PAX6 , paired box 6; RDH, retinal dehydrogenase 5; RLBP1, retinaldehyde binding protein 1; RPE, retinal pigment epithelium; TYR, tyrosinase; ZO1, zona occludens protein 1.
RLBP1 WT +RT −RT +RT −RT − CHM1 m n RPE65 PAX6 MERTK LRAT RDH5 TYR BEST1 0 0 2
Incubation time (hours) 6 20 40 60 P ercentage cells 80 100 ZO1 GAPDH
a
e
b
c
f
h
i
j
k
l
m
g
d
6
the cells on translucent porous filters allowed sectioning and histo-logical analysis. Observation of semi-thin sections demonstrated that the cell layer was a regular monolayer (Figure 4c). Transmission elec-tron microscopy showed that the monolayer was a polarized epithe-lium with microvilli on the apical side, a nucleus on the basal side, and cytosolic melanosomes and desmosomes indicative of tight junctions (Figure 4d). The epithelium appeared to secrete a basal lamina detect-able between the RPE cells and the filter. Reverse transcriptase–PCR (RT-PCR) studies (Figure 4e) demonstrated that the iPSC-derived epi-thelium expressed classic genes for the visual cycle (such as RLBP1, RPE65, LRAT, and RDH5), retinal development (PAX6), phagocytosis (MERTK), pigmentation (TYR), ion transport (BEST1), and cell adhe-sion (ZO-1). Furthermore, IF studies showed that MERTK was local-ized in the apical microvilli (Figure 4f), CRALBP (Figure 4g) and RPE65 (Figure 4h) in the cytoplasm, and ZO-1 at the apical junctions (Figure 4i), in accordance with their respective roles. Moreover, the presence of desmosomes was consistent with the positive ZO-1-labeling.
In addition to this classic RPE morphology, two of the in vivo func-tions were also conserved in the iPSC-derived RPEs. First, fluid-filled domes of varying sizes appeared in the plates over time (Figure 4j,k). These were probably formed due to apicobasal fluid transport lift-ing the RPE off the culture plate. Second, the RPE was able to induce the phagocytosis of FluoSpheres, which could be evidenced by flu-orescence microscopy (Figure 4l). Flow cytometry analysis showed that the quantity of spheres internalized increased over time (Figure 4m). Finally, the original CHM mutation was present at both the DNA and RNA levels, and REP1 was absent from the CHM1 RPE.
Taken together, these results confirmed that this iPSC-derived epithelium from both wild-type and CHM1 iPSCs was a bona fide and functional RPE.
Detection of the underlying biochemical defect
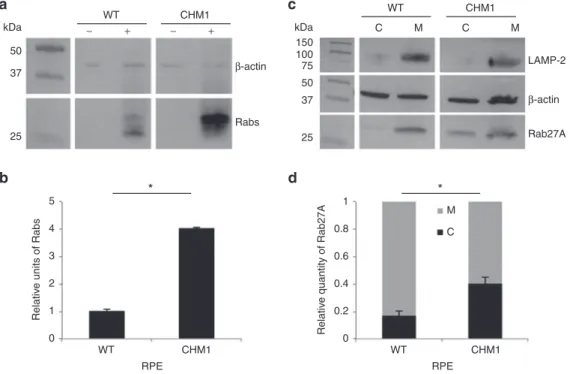
In order to determine whether the iPSC-derived RPE from the indi-vidual CHM1 reproduced the biochemical defect of patients, we used two different techniques to assay the prenylation status of intracellu-lar Rabs, a reflection of the activity of REP1. First, we assayed the size of the unprenylated Rab pool in the cells using an in vitro prenylation assay. To this end, we added recombinant Rab geranylgeranyl trans-ferase, REP1, and the biotinylated prenyl donor to the lysate of wild-type and CHM1 cells. Thus, if an unprenylated Rab pool were available for prenylation, the integrated biotin could be detected by western blot analysis using horseradish peroxidase–conjugated streptavidin (Figure 5a). The semiquantification of three experiments (Figure 5b) showed that a significantly lower level (P < 0.05) of biotinylated Rab proteins was detected in the wild-type RPE than in the CHM1 RPE, consistent with the fact that, in the presence of REP1 and REP2, most Rabs are prenylated and membrane bound. Second, we specifically assayed the subcellular distribution of Rab27A, a Rab protein highly expressed in the retina.28 By differential centrifugation, we separated
the cytosolic and membrane fractions of wild-type and CHM1 cell lysates and analyzed the respective contents of Rab27A by western blot analysis with a specific antibody (Figure 5c). The depletion of the membrane fraction from the cytosol was verified by hybridization with an antibody against the lysosomal membrane–associated pro-tein LAMP-2. The semiquantification of three experiments (Figure 5d) showed that the cytosolic versus membrane-bound Rab27A content was significantly lower (P < 0.05) in wild-type RPE as compared with that in CHM1 RPE.
Thus, in conclusion, the CHM1 RPE cells mimicked the biochemi-cal difference seen in CHM patients, i.e., an underprenylation of Rab proteins due to the absence of REP1.
Figure 5 Characterization of the biochemical defect in CHM1 RPE. (a) A representative in vitro prenylation assay using a biotinylated prenyl donor
followed by western blot analysis shows a weaker signal of incorporated biotin for the wild-type RPE than for the CHM1 RPE. (b) Semiquantification of the biotinylated Rab pool, after normalization with β-actin loading, confirms a significantly lower (*P < 0.05) relative quantity of biotinylated cytosolic Rabs in the wild-type RPE as opposed to that in CHM1 (data expressed as mean ± SEM, n = 3). (c) Following differential centrifugation and western blot analysis of Rab27A expression in the cytosolic (C) and membrane (M) fractions, a lower amount of Rab27A is detected in the cytosol of wild-type RPE, compared with that in the membrane fraction, for an equal β-actin loading. A less striking difference in Rab27A content between the two fractions is observed in CHM1 RPE. The depletion of the membrane fraction from the cytosol was controlled by hybridization with an anti-LAMP-2 antibody. (d) Semiquantification of the cytosolic fraction of Rab27A versus the total cellular content confirms a significantly lower quantity (*P < 0.05) in wild-type (WT) RPE, as opposed to the quantity in CHM1 RPE (data expressed as mean ± SEM, n = 3). LAMP, lysosomal membrane–associated protein; RPE, retinal pigment epithelium.
25 Rabs β-actin Rab27A LAMP-2 C M C M β-actin 37 50 kDa 25 0 0.2 0.4 0.6 Relativ e quantity of Rab27A 0.8 1 75 100 150 37 50 kDa WT − + CHM1 − + WT CHM1 WT CHM1 M * C RPE 0 1 2 3 4 5 Relativ e units of Rab s WT CHM1 * RPE
a
c
b
d
7 Transduction of RPE
To determine whether we could transduce the iPSC-derived RPE with AAV vectors and to ascertain the most efficient serotype, we tested a panel of vectors expressing enhanced green fluorescent protein (EGFP) under the control of a cytomegalovirus (CMV) promoter: AAV2/2, -2/4, -2/5, -2/8, and -2/9. First, all serotypes were able to transduce the iPSC-derived RPE, as determined by EGFP expression, and the efficiency of transduction was dose dependent (data not shown). Second, EGFP expression from all vectors seemed to peak at 4 weeks posttransduction (Figure 6a). Third, for an equivalent number of viral genomes per cell, the effi-ciency of each serotype was 2/5 > 2/2 > 2/4 > 2/8 = 2/9 (Figure 6a). Notably, on average, AAV2/5 vector expression was 1.5-fold higher (1.45 ± 0.26, n = 5) than that of AAV2/2. Furthermore, we used the most efficient serotype to compare the efficacy of two different promoters: CMV versus CAG (chicken β-actin with a CMV enhancer) (Figure 6a). On average, CAG directed a twofold higher (2.04 ± 0.21, n = 5) level of expression than CMV. Finally, the geno-type of the iPSC-derived RPE (i.e., wild geno-type versus CHM) did not influence transduction efficiency (Figure 6b).
Taken together, these results suggested that AAV2/5 vectors transduce human iPSC–derived RPE better than other serotypes, notably AAV2/2.
AAV2/5-CAG-CHM-directed REP1 expression
We thus generated an AAV2/5 vector expressing CHM under the control of the CAG promoter. IF studies of CHM1 fibroblasts trans-duced with AAV2/5-CAG-CHM confirmed that the encoded REP1 was expressed and correctly localized as a mostly vesicular staining in the cytoplasm (Figure 7a–c). Western blot analysis of transduced fibroblasts (Figure 7d), followed by semiquantification of REP1 expression normalized to β-actin levels, indicated that REP1 expres-sion in these cells was equivalent to ~17% of wild-type levels. In par-allel, and in accordance with the western blot data, we transduced fibroblasts with AAV2/5-CAG-EGFP and detected 14% of EGFP-positive cells by flow cytometry (data not shown). Consistently, initial transduction experiments of RPE with AAV2/5-CAG-CHM, fol-lowed by western blot (Figure 7e) and semiquantification analyses, indicated that REP1 expression was equivalent to 53% of wild-type expression level for 40% of EGFP-positive cells (as determined by flow cytometry of AAV2/5-CAG-EGFP-transduced RPE cells).
Thus, taken together, these data suggested that REP1 expression in CHM1 cells transduced with AAV2/5-CAG-CHM was at least equiv-alent to that in wild-type RPE.
CHM gene transfer
CHM1 RPE was transduced with AAV2/5-CAG-CHM vector and, based on the results of the time-course experiments, REP1 activity was analyzed 4 weeks posttransduction. A representative experi-ment is shown in Figure 8a. Following transduction of the CHM1 RPE with the AAV2/5-CAG-CHM vector and semiquantification of three experiments (Figure 8b), we detected a significant reduc-tion in the quantity of biotinylated Rab proteins (P < 0.05) to lev-els that were not significantly different from those of wild-type RPE. Similarly, an analysis of the subcellular distribution of Rab27A following AAV2/5-CAG-CHM transduction was performed, and a
Figure 6 Transduction efficiency of AAV vectors in the iPSC-derived
RPE. (a) Comparison of the transduction efficiency over time of a panel of AAV vectors (2/2, 2/4, 2/5, 2/8, and 2/9) expressing EGFP under the control of the CMV promoter. This transduction efficiency was also compared with that of an AAV2/5 vector expressing EGFP under control of the CAG promoter (2/5 CAG) and with nontransduced cells (–). Transduction was performed with 25,000 vector genomes (vg) per cell, and the number of EGFP-positive cells was analyzed by flow cytometry. (b) Comparison of the transduction efficiency in wild-type and CHM1 RPE 4 weeks postincubation with 100,000 vg per cell of AAV2/5-CAG-EGFP. AAV, adeno-associated virus; CAG, chicken β-actin with a CMV enhancer; iPSC, induced pluripotent stem cell; RPE, retinal pigment epithelium. 0 0 2 4 Weeks post-transduction 6 2/2 – 2/4 2/5 2/5 CAG 2/8 2/9 20 40 P
ercentage of EGFP cells
60 0 WT CHM1 RPE 20 40 P
ercentage of EGFP cells
60
a
b
Figure 7 REP1 expression from the vector AAV2/5-CAG-CHM.
(a) Immunofluorescence studies of REP1 expression (in green), nuclei in blue, and F-actin filaments in red in wild-type fibroblasts. (b) Absence of REP1 expression in CHM1 fibroblasts. (c) REP1 expression (in green) from AAV2/5-CAG-CHM 48 hours posttransduction of CHM1 fibroblasts with 100,000 vector genomes (vg) per cell. Bars = 50 µm. (d) Western blot analysis of fibroblasts 48 hours posttransduction with 100,000 vg per cell of AAV2/5-CAG-CHM showed that REP1 was expressed at a level ~17% of wild-type (WT) expression level. (e) Western blot analysis of RPE 4 weeks posttransduction with 100,000 vg per cell of AAV2/5-CAG-CHM showed that REP1 was expressed at a level ~53% of wild-type level. Note the absence of REP1 expression in nontransduced (NT) CHM1 cells in both
d and e. AAV, adeno-associated vector; CAG, chicken β-actin with a CMV
enhancer; REP1, Rab escort protein 1; RPE, retinal pigment epithelium.
35 55 75 100 130 kDa 150 100 75 50 37 kDa WT NT AAV-CHM REP1 β-actin CHM1 WT NT AAV-CHM CHM1
d
e
a
b
c
8
representative experiment is shown in Figure 8c. The semiquanti-fication of three experiments (Figure 8d) showed that the cytosolic versus membrane-bound Rab27A content in transduced CHM1 RPE was significantly reduced (P < 0.05) to levels similar to wild-type RPE. By contrast, transduction with a control AAV2/5-CAG-EGFP vector did not alter the proportions of Rab27A as compared with nontransduced CHM1 RPE (Figure 8d). A parallel transduction with AAV2/5-CAG-EGFP, analyzed by flow cytometry, suggested a trans-duction efficiency of ~70% in these experiments.
In conclusion, we provided the proof of concept that AAV2/5-mediated CHM gene transfer restores a normal cellular phenotype.
In vivo gene transfer
In order to complement these in vitro studies, we injected mouse eyes with phosphate-buffered saline (PBS), AAV2/5-CAG-EGFP, or AAV2/5-CAG-CHM and assayed for expression. As early as 3 days postinjection, EGFP expression was lightly perceptible in the fundus of mice injected with AAV-CAG-EGFP (data not shown). Q-PCR stud-ies performed on the retinal extracts 2 weeks postinjection showed the specific expression of human CHM in the retinal extracts of AAV2/5-CAG-CHM-injected mice and of EGFP in the CAV2/5-CAG-EGFP-injected eyes (see Supplementary Figure S1a). Western blot analysis at the same time point confirmed this specific expression at the protein level (see Supplementary Figure S1b). We followed the evolution of EGFP expression by funduscopy at 1 week, 2 weeks (see Supplementary Figure S1c), and 1 month postinjection and detected widespread transduction, which appeared stable.
Fluorescence microscopy confirmed transduction of half of the ret-ina up to the optic nerve, and EGFP expression was detected in both the RPE and in the outer and inner segments of the photoreceptors (see Supplementary Figure S1d).
In conclusion, AAV2/5-mediated gene transfer in vivo in the mouse retina results in gene expression in both the RPE and the photoreceptors.
DISCUSSION
Stem cells have revolutionized the field of human cell culture because they provide an immortal population of pluripotent cells that theoretically can differentiate into any cell type in the body.29
In particular, iPSCs represent an exceptional tool because they can be generated from adult somatic cells,30,31 hence circumventing the
ethical considerations involved with the use of human embryonic stem cells. Furthermore, they allow access to primary cell types that could not have been isolated by conventional techniques.32
Moreover, if the starting material came from an individual with a particular genetic disease, the targeted cell type could represent a disease-specific cellular model.33
We have used the iPSC technique to generate a disease-specific retinal pigment epithelium (RPE) model, which we used to provide a proof of concept for a gene therapy approach. To our knowledge, this is the first example of such a strategy. Generally, iPSC-derived cell models are used to further understand the pathophysiology of the disease,34 for screening the efficiency of pharmacological drugs,35
or for generating cell precursors for use in cell transplantation.36 We
Figure 8 Restoration of a normal cellular phenotype in CHM1 RPE following transduction with AAV2/5-CAG-CHM. (a) A representative in vitro
prenylation, followed by western blot analysis of incorporated biotinylated prenyl donor in wild-type (WT), nontransduced (NT) CHM1 RPE, and CHM1 RPE transduced with 100,000 vector genomes (vg) per cell of AAV2/5-CAG-CHM. (b) Normalization to β-actin loading levels and semiquantification indicate that the biotinylated Rab content in wild-type RPE is significantly lower (*P < 0.05) than that of nontransduced CHM1 RPE (data expressed as mean ± SEM, n = 3). Following transduction of CHM1 RPE with AAV2/5-CAG-CHM, the biotinylated Rab pool was significantly reduced (*P < 0.05) to levels not significantly different from wild-type levels. (c) Differential centrifugation and western blot analysis of cytosolic and membrane fractions in wild-type (WT), nontransduced (NT) CHM1 RPE, and CHM1 RPE transduced with 100,000 vg per cell of AAV2/5-CAG-CHM or AAV2/5-CAG-EGFP. (d) Semiquantification analysis indicates that wild-type cytosolic Rab27A levels were significantly different (*P < 0.05) from the Rab27A levels in nontransduced CHM1. Following transduction of CHM1 RPE with AAV2/5-CAG-CHM, the cytosolic Rab27A content was significantly reduced (*P < 0.05) to levels not significantly different from the wild-type levels (data expressed as mean ± SEM, n = 3). By contrast, Rab27A cytosolic levels in CHM1 RPE were unchanged following transduction with AAV2/5-CAG-EGFP. AAV, adeno-associated virus; CAG, chicken β-actin with a CMV enhancer; RPE, retinal pigment epithelium.
25 20 Rabs Rab27A β-actin 37 50 kDa 0 0.2 0.4 0.6 Relativ e quantity of Rab27A 0.8 1 WT − + WT C M NT C M AAV-CHM C M AAV-EGFP C M NT − + AAV-CHM − + CHM1 CHM1 WT CHM1 M * C RPE 0 1 2 3 4 5 Relativ e units of Rabs WT CHM1 CHM1 AAV-CHM RPE
a
c
b
d
CHM1 AAV-EGFP CHM1 AAV-CHM * * *9 show here the further potential of an iPSC-derived model for testing
the efficiency of a gene replacement strategy in the cell type that would be targeted in a corresponding therapeutic trial.
AAV vectors are now widely accepted as safe and efficient for reti-nal gene therapy. Of the various AAV serotypes identified, AAV2/2, -2/4, -2/5, -2/8, and -2/9 have all been shown to transduce retinal cell types at variable efficiencies depending on the species.37 All five
of these serotypes transduce the RPE, whereas all except AAV2/4 transduce photoreceptors.38 Furthermore, it has been shown in
multiple species that photoreceptor transduction efficiency var-ies according to the serotype with AAV2/5, -2/8, and -2/9 showing greater efficiency than AAV2/2.39,40 Two serotypes, AAV2/24–6 and
-2/4 (Dr F. Rolling, personal communication), have been tested in humans to date, and the accruing toxicology data suggest that these vectors are safe for the human eye; however the most efficient vector remains to be ascertained.
We assayed transduction efficiency of the aforementioned AAV serotypes in iPSC-derived human RPE. Consistent with the litera-ture, AAV2/5 resulted in higher expression levels for the same pro-moter than AAV2/2. Surprisingly, AAV2/8 levels were lower than those observed with AAV2/2. We excluded a batch effect by testing a different production lot of AAV2/8, but the results were identical. In addition, similar results were obtained for AAV2/9. The different transduction efficiencies could be explained by a difference in cell surface receptors because AAV2/5 binds α2–3 N-linked sialic acids, whereas AAV2/2, 2/8, and 2/9 do not (for review see ref. 41). AAV2/4, by contrast, does bind sialic acid but only α2–3 O-linked sialic acids. These results suggest that AAV2/5 may be a superior serotype for human RPE transduction. It must be noted that previous in vivo studies concluding that AAV2/8 is superior to AAV2/5 in other spe-cies specifically assessed photoreceptor transduction but not RPE transduction.39,40
We showed that AAV2/5 transduction of the RPE is dose depen-dent and that by using a CAG promoter, as opposed to a CMV promoter, transduction efficiency could be further increased. We reached transduction efficiencies of up to 70%, which was surpris-ing given the notorious difficulties of in vitro transduction ussurpris-ing this AAV serotype.42 Transduction was probably aided by the
phago-cytic properties of the RPE, which represent one of its key roles in the eye.43 In vivo, the photoreceptors continuously renew their
outer segment disks and shed their old segments at the RPE side daily. The RPE is responsible for the phagocytosis of the shed disks, which would be toxic if they accumulated. Thus, the phagocytosis ability of the iPSC-derived RPE mimics the situation encountered by AAV vectors administered into the subretinal space and further highlights the exceptional potential of this model. This property may also explain the higher transduction efficiency of the RPE as compared with that of photoreceptors with AAV vectors in all spe-cies.44 Finally, once the RPE is confluent in culture, cell division stops,
therefore preventing loss of the AAV vector over time and making it possible to follow transgene expression over the long term, similar again to the in vivo scenario.
In order to determine whether we could use a cellular model of the human RPE for testing the efficiency of an AAV2/5-mediated gene transfer approach, we generated iPSC-derived RPE from fibro-blasts of an individual with choroideremia. Choroideremia is a reti-nal dystrophy in which the degradation of the RPE appears to play a key role in its pathophysiology.24,45 Furthermore, it is a perfect
can-didate for an iPSC-derived approach because there does not exist a disease-specific animal model that is informative for gene rescue studies.25,46 We show here that choroideremia-specific RPE expresses
characteristic proteins, is functional, and mimics the biochemical
defect seen in patients: the absence of the encoded protein, REP1, results in an underprenylation of Rab proteins, notably Rab27A, leading to decreased number of membrane-associated Rabs and an increased cytosolic pool. This provided a quantitative readout that could be used to evaluate restoration of function. Using two independent assays, we showed that CHM gene transfer was able to reduce the pool of cytosolic Rabs, in particular Rab27A. This pro-vides the proof of concept in human RPE that AAV2/5-mediated
CHM gene transfer could restore a normal cellular phenotype.
The work described herein demonstrates the possibility of using a human disease-specific cellular model for proof-of-concept stud-ies in the absence of an appropriate animal model. This has been aided by the fact that the gene transfer vehicle itself has already been validated by clinical trials targeting the retina; thus, the in vitro study has mainly evaluated the functionality of the transgene. If the field of AAV-mediated retinal gene therapy continues to advance positively, then it could be envisaged that this same strategy could be applied to numerous IRDs in which the RPE is affected, hence facilitating clinical translation. However, although we can circum-vent the use of a disease-specific animal model, we cannot avoid the use of animals for subsequent safety tests, which is why we ini-tially assayed the AAV2/5-mediated expression of CHM and EGFP in the mouse eye.
To our knowledge, our approach of providing a proof of concept in a pertinent human cellular model of the diseased retina is the first example of its kind. While this manuscript was in preparation, two other articles concerning AAV-mediated CHM gene transfer were published.46,47 These studies confirm the difficulty of using the
conditional mouse models for restoration of phenotype studies for choroideremia and obtained proof of concept essentially on cellu-lar models, either CHM fibroblasts46,47 or iPSCs.47 Here, we go a step
further and provide the proof of concept in RPE cells, the principal cell type affected, hence avoiding extrapolation from cell types not implicated in disease pathogenesis. Furthermore, these aforemen-tioned studies assessed the efficiency of AAV2/2-mediated CHM gene therapy, which we show is less efficient than AAV2/5-mediated effects in the human RPE. A clinical trial is now required to address the question of whether AAV2/5 is more efficient than AAV2/2 for transduction of the human retina.
MATeRIAlS AND MeTHODS
Isolation and amplification of skin fibroblasts
A skin biopsy on the inner side of the upper arm of a 16-year-old boy (referred to as CHM1) with a confirmed molecular diagnosis of choroidere-mia (deletion of exon 8 of CHM identified by RT-PCR; Klinkum der Universität, Regensburg, Germany) was performed under sterile conditions at the Centre of Reference for Genetic Sensory Disorders (CHRU Montpellier) fol-lowing informed consent. The Ministry of Public Health accorded approval for biomedical research under the authorization number 11018S. The skin biopsy specimen was rinsed in PBS, cut into small pieces, and cultured in 35-mm culture dishes (two pieces per dish) in AmnioMax-C100 basal media with l-glutamine (Invitrogen, Life Technologies, St Aubin, France) contain-ing 10% decomplemented fetal calf serum (Lonza, Verviers, Belgium), 1% penicillin–streptomycin–amphotericin B (Lonza), and 2% AmnioMax-C100 supplement (Invitrogen, Life Technologies) at 37 °C under 5% CO2. The
biop-sies were removed to a fresh dish once the emerging fibroblasts reached 80% confluence. The cells were passaged, and aliquots ranging from P1 to P5 from each culture were frozen in fetal calf serum containing 10% dimethyl sulfoxide (Sigma Aldrich, St Quentin Fallavier, France).
Mutation characterization
Genomic DNA was isolated from primary fibroblasts using the DNeasy Blood & Tissue Kit (Qiagen, Les Ulis, France) according to the manufacturer’s instruc-tions. To define the borders of the exon 8 deletion in the CHM gene carried by
10
the CHM patient, three primer pairs distributed over 1.6 kb of genomic DNA 5′ to exon 8, and eight primer pairs distributed over 38 kb 3′ to exon 8 were tested for PCR amplification of control and patient DNAs using standard con-ditions. Once a reduced interval was established, an intron 7 forward primer (5′-TTC-ATC-TCC-TTT-TTG-TGG-GG-3′) situated 78 bp upstream of exon 8 and an intron 8 reverse primer (5′-CTG-GAA-ACA-TCC-TGT-GTT-CAT-C-3′) situated 362 bp downstream of exon 8 were used to amplify a 666-bp genomic DNA fragment that was cleaned using an ExoSAP-IT PCR Clean-up Kit (GE Healthcare, Velizy Villacoublay, France) before sequencing using the BigDye Terminator Cycle Sequencing Ready Reaction kit V3.1 on an Applied Biosystems 3130xL Genetic Analyzer (Applied Biosystems, Foster City, CA). Mutation detection
Three primer pairs were used for the PCR amplification of exons 7, 8, and 9 to test for the presence of the CHM deletion in genomic DNA from different cell types. The primer pairs for exon 7 amplified a 493-bp fragment, exon 8 primers amplified a 177-bp fragment, and exon 9 primers amplified a 975-bp fragment (primer sequences can be found in Supplementary Table S1). RNA was isolated from different cell types using the QiaShredder and RNeasy mini kits (Qiagen) according to the manufacturer’s instructions. The isolated RNA was treated with RNase-free DNase (Qiagen) and reverse-transcribed using the Superscript III Reverse Transcriptase kit (Life Technologies). The presence or absence of the CHM deletion was analyzed by PCR amplification of exons 7–11 (see Supplementary Table S1), which represented a 559-bp fragment from control cDNA and a 333-bp fragment from patient cDNA. Western blot analysis
Unless otherwise specified, cells were scraped into cold PBS containing cOmplete protease inhibitor cocktail tablets (Roche, Meylan, France) and centrifuged at 200g for 5 minutes at 4 °C. The pellet was resuspended in 2× Laemmli sample buffer (Biorad, Marne La Coquette, France) containing Benzonase (Sigma Aldrich) and loaded onto an AnyKD precast MiniProtean TGX Stain-Free gel (Biorad). The separated proteins were electrotransferred using a Trans-Blot Turbo Mini PVDF Transfer Pack and System (Biorad). After blocking for 1 hour in 0.5% Tween–PBS in 5% skimmed milk (blocking solu-tion), the membrane was incubated in 1:2,500 dilution blocking solution of a rabbit anti-REP antibody (Sigma Aldrich) or with 1:1,000 dilution of monoclonal mouse anti-REP1 antibody (clone 2F1; Millipore, St Quentin en Yvelines, France) for 1 hour at room temperature. After three washes in 0.5% Tween–PBS, the membrane was incubated with 1:10,000 dilution of horse-radish peroxidase–conjugated sheep antibody against rabbit or mouse whole immunoglobulins (IgGs) (Life Technologies). The detection step was performed using the Amersham ECL prime western blotting detection reagent (GE Healthcare).
Lentiviral vector production
Lentiviral-based plasmids containing the doxycycline-inducible transcrip-tion factors c-MYC hMYC; plasmid ID 20723), SOX2 (FUW-tetO-SOX2; 20724), KLF4 (FUW-tetO-KLF4; 20725), OCT4 (FUW-tetO-OCT4; 20726), the reverse doxycycline transactivator M2rtTA (FUW-M2rtTA; 20342), and green fluorescent protein (FUGW; 14883) were purchased from Addgene (Cambridge, MA). Lentiviral vectors were produced by the Lentiviral produc-tion platform (Montpellier, France). Infectious titer of FUGW was calculated at 1010 transducing units (TU)/ml by flow cytometry analysis. The infectious
titers of the remaining viruses were estimated by deriving the ratios of their P24 concentrations with that of FUGW (i.e., physical titer of reprogramming vectors/physical titer of FUGW) × infectious titer FUGW): FUW-tetO-Hmyc: 2 × 10⁹ TU/ml; FUW-tetO-SOX2: 7 × 10⁹ TU/ml; FUW-tetO-KLF4: 8 × 10⁹ TU/ml;
FUW-tetO-OCT4: 3 × 10⁹ TU/ml; and FUW-M2rtTA: 9.8 × 10⁹ TU/ml. The
mul-tiplicity of infection used for the subsequent reprogramming experiments was based on these values.
Feeder cells
Newborn human foreskin fibroblasts were purchased from American Type Culture Collection (hFF-1; LGC Standards, Molsheim, France). Cells were cul-tivated in Dulbecco's modified Eagle's medium containing Glutamax (Gibco, Life Technologies, St Aubin, France) supplemented with 15% fetal calf serum and irradiated by a dose of 35 Gray using a Cegelec BloodXrad irradiator (Etablissement Français du Sang, Montpellier, France). Feeder cells were seeded at a density of 2.5 × 10⁵ cells per 35-mm plate.
Reprogramming and iPSC culture
Before beginning reprogramming, the appropriate multiplicity of infection, in terms of transduction efficiency versus cell death for the lentiviral trans-duction experiments, was calculated using the green fluorescent protein– encoding FUGW vector and flow cytometry analysis. CHM patient fibroblasts at P6 were then seeded at a density of 105 cells per well on a six-well plate
on day 0 in Dulbecco's modified Eagle's medium containing Glutamax supplemented with 10% fetal calf serum and 1% penicillin–streptomycin– amphotericin B. On day 1, cells were transduced with the five vectors (the control vector FUGW was not used in the reprogramming experiments) at a multiplicity of infection of 10 per vector (total multiplicity of infection of 50) in the presence of 8 µg/ml polybrene. On day 2, the cells were rinsed with PBS, and fresh medium was added. On day 5, the medium was renewed and supplemented with 2 µg/ml of doxycycline (Sigma Aldrich). On day 6, the transduced cells were dissociated using 0.25% trypsin (Gibco), and the cells from one well were divided across four wells containing feeder cell layers (1:4 dilution). The cells were then cultured in ES media: KnockOut Dulbecco's modified Eagle's medium (Gibco) supplemented with 20% KnockOut serum replacement (Gibco), 200 mmol/l l-glutamine (Gibco), 1% nonessential amino acids (Gibco), 0.1% β-mercaptoethanol (Gibco), 1% penicillin–strep-tomycin (Gibco), and 10 ng/ml basic fibroblast growth factors (Peprotech, Neuilly Sur Seine, France), containing 2 µg/ml doxycycline; the media were then changed daily. Resulting iPSCs were mechanically passaged using a scalpel under a Lynx stereomicroscope (Vision Engineering SA, Le Plessis Pâté, France) onto 35-mm plates containing feeder cells in ES media without doxycycline. For the first indication of pluripotency, iPSCs at P10 were stained with the Red Alkaline Phosphatase Substrate Kit I (Vector Laboratories, ABCYS, Paris, France) according to the manufacturer’s instructions.
Teratoma formation and analysis
iPSCs were pretreated with 10 µmol/l ROCK (Rho-associated coiled-coil forming protein serine/threonine kinase) inhibitor (Y-27632; Sigma Aldrich), for 1 hour at 37 °C and then enzymatically dissociated with 1× TrypLE Select (Gibco) for 10 minutes at 37 °C. Dissociated cells were seeded at a density of 5,000 cells/cm2 onto a 10-cm plate containing a feeder cell layer and
cul-tured in ES media containing ROCK inhibitor for 24 hours after passaging. Cells were enzymatically passaged five times before injection. Dissociated cells were resuspended in ES media containing 30% BD Matrigel Basement Membrane Matrix (BD Biosciences, Le Pont de Claix, France) at a concentra-tion of 2 × 10⁶ cells per 200 µl injected. NOD.Cg-Prkdcscid Il2rgtm1Wjl/SzJ
(NSG) mice (Charles River, L’Arbresle, France) were anesthetized with 35 mg/ kg ketamine (Merial, Lyon, France) and 14 mg/kg xylazine (Bayer Healthcare, Loos, France), shaved on the left and right hind flanks, and injected subcu-taneously with the 200-µl cell mixture using a 1-ml syringe attached to a 27-gauge needle. As controls, mice were injected with 30% Matrigel in ES media containing either no cells or previously characterized wild-type iPSCs (M4C7).27 The mice were housed in individually ventilated cages and were
euthanized when the tumors reached a maximum size of 1 cm3 (~2 months
postinjection). Tumors were dissected, rinsed in PBS, fixed in 3.7% formal-dehyde, and embedded in paraffin. Then, 4-µm sections were stained with hematoxylin–eosin and analyzed for the presence of the three germ layers. RPE generation
To differentiate iPSCs into RPE, we used a previously described spontaneous differentiation protocol,48 with minor modifications. Briefly, iPSC colonies were
allowed to grow to confluence on feeder cells, and the basic fibroblast growth factors were then removed from the ES media. The media continued to be changed daily during the differentiation process. Pigmented foci appeared over the course of the month following bFGF depletion, which were manually dissected. The foci from one plate were pooled, dissociated with 0.25% tryp-sin, seeded onto 24-well or 6-well culture dishes coated with Matrigel (diluted 1:30), and cultured in bFGF-depleted ES media. Once a confluent monolayer was reached, the cells showed a pigmented polygonal morphology and could be maintained in culture long term with media changes every 3–5 days. Cells were passaged by trypsin dissociation and amplified as required. All analy-ses were performed on RPE at P3. Fluid-filled domes were observed using a SteREO Discovery V2.0 microscope (Carl Zeiss S.A.S., Le Pecq, France). Electron microscopy
RPE was passaged onto translucent BD Falcon cell culture inserts with high-density 0.4-µm pores (BD Biosciences). When a characteristic morphology
11 was reached, the filters were detached from the chambers, fixed in 3.3%
glutaraldehyde, postfixed in 2% osmium tetraoxide, and embedded in epoxy resin. Semi-thin (700-nm) sections were stained with toluidine blue and observed under light microscopy. Furthermore, 70-nm sections were stained with uranyl acetate and lead citrate and visualized using a Hitachi H7100 transmission electron microscope (Centre Regional d’Imagerie Cellulaire, Montpellier, France).
Fluorescence microscopy
For the IF studies, iPSCs and RPEs were seeded onto plastic 96-well plates, whereas fibroblasts were seeded on glass cover slips in 24-well plates. All cell types were fixed with 3.7% formaldehyde and blocked in 5% donkey serum/1% bovine serum albumin. Cells were permeabilized with 0.2% Triton X-100 or 0.05% saponin. Primary antibodies were incubated overnight at 4 °C, and the secondary antibody was incubated for 45 minutes at room tem-perature with 0.2 µg/ml bisBenzimide Hoechst (Sigma Aldrich) and 1 ng/ ml phalloidin–TRITC (Sigma Aldrich) before mounting in Dako Fluorescent Mounting Media (Dako France S.A.S., Les Ulis, France) when appropriate. For the iPSCs, the primary antibodies used were rat IgM anti-human SSEA3 at 1:5 dilution (Developmental Studies Hybridoma Bank, University of Iowa, Iowa City, IA) and 1:10 dilution goat anti-human NANOG (R&D Systems Europe, Lille, France). For the RPE, the primary antibodies used were 1:100 dilution rabbit anti-human ZO-1 (Invitrogen, Life Technologies), 1:250 dilution rab-bit anti-human MERTK (AbCam, Cambridge, Great Britain), 1:150 dilution mouse anti-human RPE65 (AbCam), and 1:1,000 dilution mouse anti-human CRALBP (directed against the recombinant protein; Agrobio, La Ferté St Aubin, France). For the fibroblasts, the primary antibody used was 1:500 dilu-tion mouse human REP1 (Millipore). For all samples, the secondary anti-bodies were 1:800 dilution donkey anti-mouse IgM-Alexa594 or -Alexa488 or 1:1,000 dilution donkey anti-mouse, anti-rabbit, or anti-goat IgG-Alexa Fluor 594 or IgG-Alexa 488 (Molecular Probes, Invitrogen). For the phago-cytosis studies, cells were incubated with 1-µm diameter, yellow–green (505/515 nm) carboxylate-modified microspheres (FluoSpheres; Molecular Probes, Invitrogen, Life Technologies) at a quantity of 160 beads per cell. Cells were observed using a Zeiss-5 Live Duo high speed/spectral confocal microscope, and image acquisition was performed using the correspond-ing acquisition software (Carl Zeiss S.A.S.; Montpellier RIO Imagcorrespond-ing platform). Reverse transcription and quantitative PCR studies
Quantitative RT–PCR (q-PCR) was used to analyze the expression of the exogenous transgenes in the transduced fibroblasts, in addition to study-ing the silencstudy-ing of the exogenous transgenes and the activation of the endogenous pluripotency genes in the iPSCs. Following RNA isolation and cDNA synthesis, q-PCR amplification was performed using gene-specific primers (see Supplementary Table S1) and the LightCycler 480 SYBR Green I Master mix on a LightCycler 480 II thermal cycler (Roche). Gene expres-sion was normalized to glyceraldehyde 3-phosphate dehydrogenase (GAPDH) expression. Results were analyzed using LightCycler 480 soft-ware and Microsoft Excel. The expression of RPE-specific markers was ana-lyzed using classic RT-PCR amplification with gene-specific primers (see Supplementary Table S1), and the amplification products were analyzed on 2% agarose gel in 1× TAE buffer.
In vitro prenylation assay
RPE cultured in a well of a 24-well plate was washed in cold PBS, scraped in PBS containing antiproteases, pelleted, and resuspended in cold, degassed prenylation/lysis buffer prepared fresh, as described previously.49 Cells were
incubated for 15 minutes on ice and then sonicated thrice for 45 seconds at 40 Hertz. The cells were then centrifuged for 5 minutes at 1,500g at 4 °C, and the supernatant was collected and further centrifuged for 30 minutes at 450,000g at 4 °C on an Optima MAX-TL ultracentrifuge (Beckman, Villepinte Roissy, France). An in vitro prenylation assay was performed on the freshly prepared lysate using 5 µmol/l biotin-labeled geranyl pyrophosphate (Euromedex, Souffelweyersheim, France) as a prenyl group donor, 0.5 µmol/l recombinant REP1 (Euromedex), 0.5 µmol/l recombinant Rab geranylgera-nyl transferase type 2 (GGTase-II; Euromedex), and 20 µmol/l guanosine diphosphate in prenylation/lysis buffer at 37 °C for 1 hour.49,50 The
prenyl-ation reaction was stopped with 6× sodium dodecyl sulfate, boiled at 90 °C for 5 minutes, and biotin incorporation analyzed by western blot analysis. The membrane was incubated with 1:5,000 horseradish peroxidase–conju-gated streptavidin (Jackson ImmunoResearch, Cambridge, UK) and 1:50,000
mouse anti β-actin (Sigma Aldrich). Detection was performed using the ChemiDoc MP Imaging system (Biorad). The amount of biotinylated Rab proteins was then quantified by scanning densitometry using the appropri-ate software package (Image Lab, Biorad) and expressed as a function of the
β-actin signal. Experiments were performed in triplicate.
Differential centrifugation
Pelleted RPE cells from a well of a 24-well plate were thoroughly homog-enized in three volumes of subcellular fraction lysis buffer containing 50 mmol/l Tris-HCl (pH 7.5), 150 mmol/l NaCl, 2 mmol/l MgCl2, 0.5 mmol/l eth-ylene glycol tetraacetic acid, 0.5 mmol/l etheth-ylenediaminetetraacetic acid, 5 mmol/l dithiothreitol, 0.1 mmol/l guanosine diphosphate, and protein inhibitors, as previously described.28 The homogenate was centrifuged at
1,500g for 5 minutes at 4 °C, the pellet discarded, and the supernatant ultra-centrifuged at 450,000g for 1 hour at 4 °C to obtain the cytosolic and mem-brane fractions. Following ultracentrifugation, the pellet was resuspended in one volume of subcellular fraction lysis buffer adjusted to 1% Nonidet P-40 (Sigma Aldrich). The protein contents of the cytosolic supernatant and the 1% Nonidet P-40-solubilized membrane fraction were analyzed by western blot analysis. The transferred membranes were incubated with 1:250 mouse anti-Rab27A (AbCam), 1:500 mouse anti-LAMP-2 (clone H4B4; Abcam), and 1:50,000 mouse anti-β-actin antibodies. The quantity of cytosolic Rab27A is expressed as a function of the total Rab27A content (cytosolic + membrane), which was normalized among experimental groups to allow comparisons. Experiments were performed in triplicate.
AAV vector production
The Viral Vector Production Platform, Nantes, France, produced all the AAV vectors used for this work. Briefly, the viral vectors were produced by tran-sient transfection of HEK293 cells, and the viral particles were precipitated from either the supernatant using polyethylene glycol or, in the case of the AAV2/4 and -2/5 vectors, from the cell pellet using ammonium sulfate. The vectors were purified by double CsCl centrifugation, dialyzed, and titered by dot blot assay. For the transduction efficiency experiments, the titers of the AAV vectors expressing EGFP under the control of the CMV promoter were as follows: AAV2/2-CMV-EGFP: 3.5 × 10¹² vector genomes (vg)/ml;
AAV2/4-CMV-EGFP (provided by the intermediary of Dr. F. Rolling, Inserm UMR 1089, Nantes, France): 3 × 10¹¹ vg/ml; AAV2/5-CMV-EGFP: 3.3 × 10¹² vg/ml;
AAV2/8-CMV-EGFP: 9 × 10¹² vg/ml, and AAV2/9-CMV-EGFP: 2.55 × 10¹² vg/ml. For the
proof-of-concept experiments, AAV plasmids carrying either the CHM gene (provided by Professor J. Bennett, University of Pennsylvania, Philadelphia, PA) or the EGFP gene (provided by the Nantes Viral Vector Production Platform) under the control of the CAG (chicken β-actin promoter with CMV enhancer) promoter were used to produce the following vectors: AAV2/5-CAG-CHM: 4.4 × 10¹² vg/ml and AAV2/5-CAG-EGFP: 2.34 × 10¹² vg/ml. In vitro AAV transduction
For the transduction efficiency experiments, the iPSC-derived RPE was seeded in 96-well plates, and 2 × 10⁵ cells per well were estimated at
con-fluence. Cells were transduced equivalently with 25,000 vg (dictated by the serotype with the lowest titer) per cell in a minimum volume (50 µl) of bFGF-depleted ES media for 6 hours to promote vector–cell interaction. The wells were then supplemented with extra media, and the media was changed every 3–4 days. At the desired time points, cells were dissociated with 0.25% trypsin, fixed in 3.7% formaldehyde, and the number of EGFP-expressing cells analyzed using a BD FACSCalibur flow cytometer (BD Biosciences) at 48 hours and at 1, 2, 4, and 6 weeks posttransduction. Experiments were performed in duplicate. For transgene expression experiments, 2 × 10⁴
fibro-blasts were seeded in 24-well plates containing cover slips for IF studies, and 1.5 × 10⁵ fibroblasts were seeded in six-well plates for western blot and
flow cytometry analyses. Twenty-four hours postseeding, cells were trans-duced with 100,000 vg of AAV2/5-CAG-CHM or AAV2/5-CAG-EGFP per cell for 48 hours. For the western blot analysis, cells were scraped in lysis buffer (50 mmol/l Tris-HCl (pH 6.8), 10% glycerol, and 2% sodium dodecyl sulfate), centrifuged for 5 minutes at 1,500g at 4 °C, and the protein content of the supernatant assayed using the Pierce BCA protein assay kit (Thermo Fisher Scientific, Courtaboeuf, France) before loading. For the proof-of-concept experiments, iPSC-derived RPE was seeded in 24-well plates, and 1.2 × 10⁶
cells were estimated at confluence. Cells were transduced with 100,000 vg per cell, and prenylation assays were performed at 4 weeks posttransduc-tion. Experiments were performed in triplicate.