HAL Id: hal-00316773
https://hal.archives-ouvertes.fr/hal-00316773
Submitted on 1 Jan 2001
HAL is a multi-disciplinary open access
archive for the deposit and dissemination of
sci-entific research documents, whether they are
pub-lished or not. The documents may come from
teaching and research institutions in France or
abroad, or from public or private research centers.
L’archive ouverte pluridisciplinaire HAL, est
destinée au dépôt et à la diffusion de documents
scientifiques de niveau recherche, publiés ou non,
émanant des établissements d’enseignement et de
recherche français ou étrangers, des laboratoires
publics ou privés.
Pc5 geomagnetic field fluctuations at discrete
frequencies at a low latitude station
U. Villante, P. Francia, S. Lepidi
To cite this version:
U. Villante, P. Francia, S. Lepidi. Pc5 geomagnetic field fluctuations at discrete frequencies at a
low latitude station. Annales Geophysicae, European Geosciences Union, 2001, 19 (3), pp.321-325.
�hal-00316773�
Annales
Geophysicae
Pc5 geomagnetic field fluctuations at discrete frequencies
at a low latitude station
U. Villante1, P. Francia1, and S. Lepidi2
1Dipartimento di Fisica, Universita’ dell’Aquila, L’Aquila, Italy 2Istituto Nazionale di Geofisica, L’Aquila, Italy
Received: 31 January 2000 – Revised: 13 February 2001 – Accepted: 16 February 2001
Abstract. A statistical analysis of the geomagnetic field
fluc-tuations in the Pc5 frequency range (1–5 mHz) at a low lati-tude station (L = 1.6) provides further evidence for daytime power peaks at discrete frequencies. The power enhance-ments, which become more pronounced during high solar wind pressure conditions, may be interpreted in terms of ground signatures of magnetospheric cavity/waveguide com-pressional modes driven by solar wind pressure pulses. In this sense, the much clearer statistical evidence for afternoon events can be related to corotating structures mainly imping-ing the postnoon magnetopause. A comparison with results obtained for the same time intervals from previous investi-gations at higher latitudes and in the Earth’s magnetosphere confirms the global character of the observed modes.
Key words. Magnetospheric physics (MHD waves and
in-stabilities; solar wind-magnetospheric interactions)
1 Introduction
Pioneering investigations by several authors (Ruohoniemi et al., 1991; Samson et al., 1991, 1992; Walker et al., 1992; Ziesolleck and McDiarmid, 1994) reported evidence at au-roral latitudes of long period ULF waves in F-region drift velocities and in the local geomagnetic field components at discrete frequencies (of the order of 1.3, 1.9, 2.6 and 3.4 mHz). According to the theoretical suggestions provided by Radoski (1974) and extended by Kivelson and Southwood (1985, 1986), these modes were interpreted in terms of field line resonances driven by compressional modes of the mag-netosphere which would act as a resonant cavity (with eigen-frequencies depending on its dimensions and physical char-acteristics) when excited by external mechanisms such as pressure pulses of the solar wind (SW). Samson et al. (1992) extended the cavity model, considering the magnetosphere as an open-ended waveguide in which compressional modes Correspondence to: P. Francia
(patrizia.francia@aquila.infn.it)
driven by the SW propagate in the antisunward direction. Samson et al. (1991) and Walker et al. (1992) also found that the discrete frequencies (also known as CMS frequen-cies, after the cavity mode model proposed by Samson et al., 1992) were stable within 5–10% over time intervals rang-ing between a few hours and several months. On the other hand, Ziesolleck and McDiarmid (1995), who analyzed data from the CANOPUS array (corrected geomagnetic latitude between 61◦and 73◦), suggested that these apparently stable frequencies do not necessarily represent a unique set. In a re-cent paper, Mathie et al. (1999) examined the statistical char-acteristics of ULF pulsations observed by the IMAGE array (corrected geomagnetic latitudes between 56◦and 76◦) and found that CMS frequencies (1.2–1.4, 1.8–2.0, 2.4–2.6, 3.2– 3.4 mHz) are very prominent in ground observations but their results do not support a day-to-day stability of the spectral peaks. They suggested that the CMS frequencies represent the average (most frequently occurring) eigenfrequencies of the magnetospheric cavity but are subject to variability in re-sponse to the changing nature of the waveguide. Low fre-quency pulsations have been studied at lower latitude, using data from the Australia Wide Array of Geomagnetic Stations (AWAGS; corrected geomagnetic latitude between −22◦and −50◦), by Ziesolleck and Chamalaun (1993), who consid-ered their observations consistent with signatures of global compressional modes of the magnetosphere.
At our latitude (L’Aquila, Italy, AQ, IGRF99 corrected ge-omagnetic latitude 36.2◦, L = 1.6, LT = UT+1, MLT = UT
+1:37), geomagnetic field fluctuations in the ULF band are, typically, a Pc3 (20–100 mHz) daytime phenomenon which is characterized by the occurrence of two dominant oscilla-tion modes (Vellante et al., 1989). They have been inter-preted in terms of a driving source of waves with a wide spectrum typically peaked at a frequency of ∼40–50 mHz (coming from upstream waves generated in the Earth’s fore-shock region and penetrating deep into the magnetosphere) and as a local signal amplification at the frequency ∼80 mHz of the fundamental field line oscillations. Through the solar cycle, due to the variable interplanetary and magnetospheric
322 U. Villante et al.: Pc5 geomagnetic field fluctuations 1 2 3 4 5 200 1000 2000 spectral density (nT 2 /Hz) freq (mHz) (a) 95% 1 2 3 4 5 200 1000 2000 spectral density (nT 2 /Hz) freq (mHz) (b) 95%
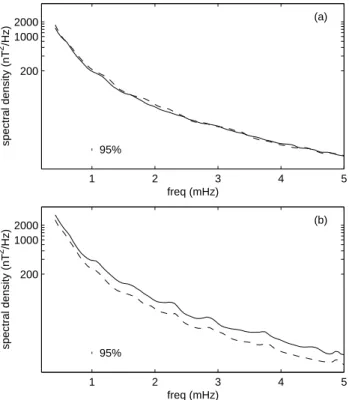
Fig. 1. Average power spectra of the H (solid line) and D (dashed
line) component in the frequency band 0.4–5.0 mHz for (a) day-time and (b) night-day-time intervals during 1997–98. The error bars correspond to the 95% confidence interval.
conditions, the two modes become often intermingled (Vel-lante et al., 1996). However, in the Pc3 range, the statistical analysis of the hourly power spectra of the geomagnetic field fluctuations averaged over time intervals of several months (for example, Villante et al., 1990) does not show any dis-tinct power peak. Conversely, at lower frequencies, an anal-ysis of the power spectra of the geomagnetic field compo-nents H and D in two different phases of the solar cycle, at the minimum (1985–86) and the maximum (1989–90) of the previous solar cycle, allowed us to propose statistical evi-dence on both components for daytime power enhancements at discrete frequencies, approximately corresponding to the CMS frequencies: i.e. ∼1.4, 1.9, 2.5 and, less evident, 3.6 mHz (Francia and Villante, 1997, hereafter paper 1). Night-time observations did not show evidence for similar power enhancements.
In the present paper we performed, during the ascending phase of the new solar cycle, the same statistical analysis as in paper 1, in order to investigate if the power enhancements can be considered characteristic features of the low latitude field fluctuations at any phase of the solar cycle. We also found it interesting to compare our observations with the re-sults simultaneously obtained at different positions by previ-ous investigations in order to ascertain the global character-istics of these phenomena.
1 2 3 4 5 200 1000 2000 spectral density (nT 2 /Hz) freq (mHz) (a) 95% 1 2 3 4 5 200 1000 2000 spectral density (nT 2 /Hz) freq (mHz) (b) 95%
Fig. 2. The same as Fig. 1 separately for (a) prenoon intervals and (b) postnoon intervals.
2 The experimental results
We used 1 min averages of the geomagnetic field components H and D measured (with a sampling rate of 1 s) at AQ as original data for the present investigation. For the SW, we used the key parameters from the WIND spacecraft.
The spectral analysis of the low frequency fluctuations was conducted over a 2-year interval (1997–98) during the as-cending phase of the new solar cycle; as in paper 1, indi-vidual power spectra have been computed over consecutive 3-hr intervals by means of the maximum entropy method at order m = 30 of the prediction error filter (the frequency res-olution is about 0.1 mHz and the Nyquist frequency is 8.33 mHz). The total number of 3-hr spectra is 5434. In order to have confident spectral power estimates, we computed aver-age spectra over the whole 1997–98 period. Assuming that the distribution of a smoothed estimate is approximately a chi-square distribution, we computed the statistical uncer-tainty at a 95% confidence level. We also computed, as an independent test, the standard deviation of the mean value of the power spectral density at any given frequency (divid-ing the whole 1997–98 period into subintervals and assum-ing that the average for each subinterval follows a gaussian distribution) and found that it is comparable with the 95% statistical uncertainty previously obtained.
Average daytime (05–17 UT) and night-time (17–05 UT) spectra have been computed separately. As can be seen, the average daytime spectra (Fig. 1a) confirm the occurrence of several power enhancements on both components which,
1 2 3 4 5 200 1000 2000 spectral density (nT 2 /Hz) freq (mHz) (a) 95% 1 2 3 4 5 200 1000 2000 spectral density (nT 2 /Hz) freq (mHz) (b) 95%
Fig. 3. The same as Fig. 2 during high SW pressure conditions.
typically, have amplitude greater than (or comparable to) the statistical uncertainty; conversely, as in paper 1, no signifi-cant spectral feature emerges in the average night-time spec-tra (Fig. 1b). Daytime enhancements appear at discrete fre-quencies of the order of ∼ 1.1, 1.7, 2.3, 2.8, and 3.7 mHz.
We also found that the daytime enhancements have a clear local time dependence. In Fig. 2, we compare the average prenoon (05–11 UT) and postnoon (11–17 UT) spectra (the spectra corresponding to the intervals 05–08 and 08–11 UT and to the intervals 11–14 and 14–17 UT have been grouped together since they are very similar); as it can be seen, power peaks emerge clearly in the afternoon both in the H and the Dcomponent, while no significant spectral feature appears in the prenoon interval. Note, also, the greater power level of the H spectrum in the afternoon compared to the morning.
We next investigated the possible relationship between po-wer enhancements and SW conditions, performing the same spectral analysis for prenoon and postnoon daytime intervals associated with SW dynamic pressure values greater than 3 nPa (approximately 20% of the intervals). As shown in Fig. 3, the power levels are definitely higher than in Fig. 2 and the power peaks in the postnoon spectra of both components be-come even more evident (as to the prenoon spectra, no clear power enhancement emerges).
In order to ascertain the global character of the observed low frequency pulsations, we also found it interesting to com-pare new experimental observations with those simultane-ously obtained at different positions by previous investiga-tions. For example, the Earth’s passage of the 10–11 Jan-uary 1997 magnetic cloud triggered a highly polarized mode
−5 0 5 HAQ (nT) −5 0 5 DAQ (nT) −60 −40 −20 0 20 40 60 HTNB (nT) −60 −40 −20 0 20 40 60 DTNB (nT) 0 1 2 3 4 5 −5 0 5 BG O ES9 (nT) Hour (UT)
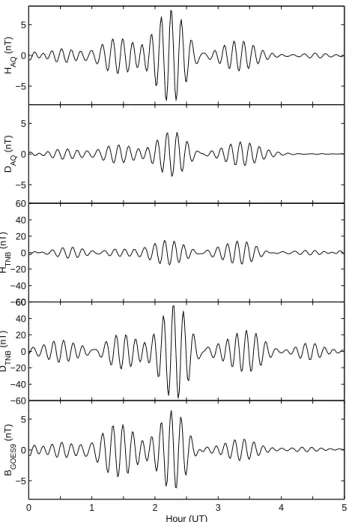
Fig. 4. The 1.8 mHz filtered data on 11 January 1997 (00–05 UT):
the H and D components at AQ and TNB and the total magneto-spheric field observed by GOES 9.
at 1.8 mHz, which was observed simultaneously at AQ and Terra Nova Bay (TNB, Antarctica, corrected geomagnetic latitude −80.0◦, MLT = UT − 8) with a high coherence between the stations, despite the wide longitudinal and lati-tudinal separation (Villante et al., 1998). Simultaneous mag-netospheric observations at the geosynchronous orbit (GOES 9, UT − 9) show that the same wave packets are simultane-ously observed on the ground and in the magnetosphere (Fig. 4), a result which confirms that the observed mode extends to a major portion of the Earth’s magnetosphere.
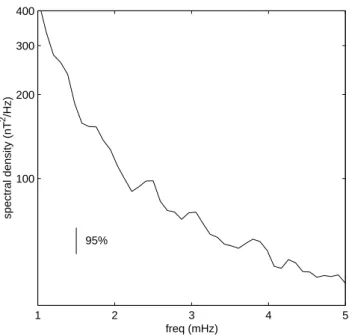
Another test of the global character of the observed low frequency pulsations was conducted by evaluating the av-erage daytime H spectrum at our station for the same 3-month interval (March 1994, 1995 and 1996), recently an-alyzed by Mathie et al. (1999) who statistically examined 137 low frequency events detected at the IMAGE array in Scandinavia. They found that dominant amplitude pulsations preferentially occur at frequencies of the order of 1.2–1.4, 1.8–2, 2.4–2.6 , 3.2–3.4, and 3.8–4.0 mHz; our results (Fig. 5) confirm the occurrence of power enhancements, approx-imately at the same frequencies, although the statistical
un-324 U. Villante et al.: Pc5 geomagnetic field fluctuations 1 2 3 4 5 100 200 300 400 spectral density (nT 2/Hz) freq (mHz) 95%
Fig. 5. The H component average power spectrum during March
1994, 1995 and 1996.
certainty is comparable with (or greater than) the amplitude of the emerging spectral peaks.
3 Summary and discussion
We have statistically examined the spectral characteristics of ULF Pc5 (1–5 mHz) geomagnetic field fluctuations at a low latitude station during the ascending phase of the present so-lar cycle and investigated their relationship with the SW pa-rameters.
When compared with results of paper 1, the present results indicate that power enhancements at discrete frequencies ap-pear in the daytime spectra through the whole solar cycle. Although the observed frequencies are not exactly the same as observed in paper 1, we may well interpret our results in terms of ground signatures of cavity/waveguide modes. In-deed, the averaging procedure and the changing nature of the waveguide characteristics under different geomagnetic and SW conditions may well introduce a frequency uncertainty somewhat larger than the theoretical one (i.e. ∼0.1 mHz). On the other hand, Ziesolleck and McDiarmid (1995) and, more recently, Mathie et al. (1999) suggested that there is no unique set of waveguide mode frequencies; the CMS are dominant against a background spread of frequencies.
A comparison with the statistical results obtained for the same time interval at much higher latitude (Mathie et al., 1999) confirms the global character of these fluctuations. Moreover, the analysis of simultaneous ground observations at widely separated stations and observations obtained at the geosynchronous orbit during the 10–11 January 1997 mag-netic cloud event clearly shows that the same oscillation mode (∼1.8 mHz) was simultaneously detected in a major portion of the Earth’s magnetosphere. Similar results were
also found in a previous paper (Lepidi et al., 1999a) on the analysis of the geomagnetic field fluctuations triggered by the Earth’s passage of the coronal ejecta on 11 April 1997. Coherent fluctuations at the same frequency (3.6 mHz) were also observed at two ground stations and in the magneto-sphere.
Although the significance of the present statistical analy-sis cannot be as good as that determined by analyzing se-lected events, the clear differences which emerge over dif-ferent MLT intervals as well as during difdif-ferent SW con-ditions clearly correspond to real and important features of ground observations at low latitudes. In this context, we unambiguously found that power enhancements at discrete frequencies are typically a daytime feature which becomes much more explicit during high pressure SW conditions. It is interesting to note that individual events (such as the 10– 11 January 1997 event) triggered by extremely strong SW pressure pulses were also well detected during nighttime in-tervals (Villante et al., 1998). In the present scenario, the much clearer statistical evidence for afternoon events (which is opposite to the results obtained at high and mid latitudes where morning side pulsations are more clearly identified and are interpreted in terms of field line resonances driven by the Kelvin-Helmholtz instability; Chisham and Orr, 1997; Mathie et al., 1999) can tentatively be interpreted in terms of the statistical importance of SW pressure pulses associated with corotating structures which more frequently impinge on the postnoon side of the magnetopause. In this sense, it is also interesting to note that, at high and mid latitudes, the oc-currence of afternoon events was associated with global com-pressional modes excited by solar wind pulses impacting the magnetopause (Rostoker and Sullivan, 1987; Chisham and Orr, 1997; Mathie et al., 1999), in particular along the dusk flank (Rostoker and Sullivan, 1987). On the other hand, the importance of corotating structures on low latitude Pc5 pul-sations was also proposed by Lepidi et al. (1999b) who, ana-lyzing the polarization pattern of the low frequency waves at AQ, showed that the expected counterclockwise/clockwise polarization noon reversal consistent with waves driven by the SW and propagating westward in the morning and east-ward in the afternoon (Samson, 1972) is delayed by a few hours with respect to the local noon, indicating a source pref-erentially located in the early afternoon sector. Consistently, at higher latitudes equatorward of the resonance position, it was found that while morning and late afternoon pulsations are dominated respectively by counterclockwise and clock-wise polarization, events occuring around noon and in the early afternoon show mixed polarization (Rostoker and Sul-livan, 1987; Mathie et al., 1999).
Acknowledgements. This research activity is supported at L’Aquila by GIFCO/CNR, PNRA and MURST.
Topical Editor G. Chanteur thanks I. R. Mann and C. L. Waters for their help in evaluating this paper.
References
Chisham, G. and D. Orr, A statistical study of the local time asym-metry of Pc5 ULF wave characteristics observed at midlatitudes by SAMNET, J. Geophys. Res., 102, 24339, 1997.
Francia, P. and U. Villante, Some evidence of ground power en-hancements at frequencies of global magnetospheric modes at low latitude, Ann. Geophysicae, 15, 17, 1997.
Kivelson, M. and Southwood, D., Resonant ULF waves: a new in-terpretation, Geophys. Res. Lett., 12, 49, 1985.
Kivelson, M. and Southwood, D., Coupling of global magneto-spheric MHD eigenmodes to field line resonances, J. Geophys. Res., 91, 4345, 1986.
Lepidi, S., Francia, P., Villante, U., Meloni, A., Lazarus, A. J., and Lepping, R. P., The Earth’s passage of the April 11, 1997 coronal ejecta: geomagnetic field fluctuations at high and low latitude during northward interplanetary magnetic field conditions, Ann. Geophysicae, 17, 1245, 1999a.
Lepidi, S., Francia, P., Villante, U., Lanzerotti, L. J., and Meloni, A., Polarization pattern of low-frequency geomagnetic field fluctua-tions (0.8–3.6 mHz) at high and low latitude, J. Geophys. Res., 104, 305, 1999b.
Mathie, R. A., Mann, I. R., Menk, F. W., and Orr, D., Pc5 ULF pulsations associated with waveguide modes observed with the IMAGE magnetometer array, J. Geophys. Res., 104, 7025, 1999. Radoski, H. R., A theory of latitude dependent geomagnetic mi-cropulsations: the asymptotic fields, J. Geophys. Res., 79, 595, 1974.
Rostoker, G. and Sullivan, B. T., Polarization characteristics of Pc5 magnetic pulsations in the dusk hemisphere, Planet. Space Sci., 35, 429, 1987.
Ruohoniemi, J. M., Greenwald, R. A., Baker, K. B., and Samson, J. C., HF radar observations of Pc5 field line resonances in the mid-night/early morning MLT sectors, J. Geophys. Res., 96, 15697, 1991.
Samson, J. C., Three dimensional polarization characteristics of
high latitude Pc5 geomagnetic micropulsations, J. Geophys.
Res., 77, 6145, 1972.
Samson, J. C., Greenwald, R. A., Ruohoniemi, J. M., Hughes, T. J., and Wallis, D. D., Magnetometer and radar observations of MHD cavity modes in the Earth’s magnetosphere, Can. J. Phys., 69, 929, 1991.
Samson, J. C., Harrold, B. G., Ruohoniemi, J. M., Greenwald, R. A., and Walker, A. D. M., Field line resonances associated with MHD waveguides in the magnetosphere, Geophys. Res. Lett., 19, 441, 1992.
Vellante, M., Villante, U., Cerulli-Irelli, P., and De Lauretis, M., An analysis of micropulsations events at a low latitude station during 1985, Planet. Space Sci., 37, 767, 1989.
Vellante, M., Villante, U., De Lauretis, M., Barchi, G., Solar cycle variation of the dominant frequencies of Pc3 geomagnetic pulsa-tions at L = 1.6, Geophys. Res. Lett., 23, 1505, 1996.
Villante, U., Vellante, M., De Lauretis, M., Cerulli-Irelli, P., and Or-fei, R., Micropulsation measurements at low latitudes, Il Nuovo Cimento, 13, 93, 1990.
Villante, U., Francia, P., Lepidi, S., De Lauretis, M., Pietropaolo, E., Cafarella, L., Meloni, A., Lazarus, A. J., Lepping, R. P., and Mariani, F., Geomagnetic field variations at low and high latitude during the January 10–11, 1997 magnetic cloud, Geophys. Res. Lett., 25, 2593, 1998.
Walker, A. D. M., Ruohoniemi, J. M., Baker, K. B., Greenwald, R. A., and Samson, J. C., Spatial and temporal behavior of ULF pulsations observed by Goose Bay HF radar, J. Geophys. Res., 97, 12187, 1992.
Ziesolleck, C. W. S. and Chamalaun, F. H., A two-dimensional array study of low-latitude Pc5 geomagnetic pulsations, J. Geophys. Res., 98, 13703, 1993.
Ziesolleck, C. W. S. and McDiarmid, D. R., Auroral latitude Pc5 field line resonances: quantized frequencies, spatial characteris-tics and diurnal variations, J. Geophys. Res., 99, 5817, 1994. Ziesolleck, C. W. S. and McDiarmid, D. R., Statistical survey of
auroral latitude Pc5 spectral and polarization characteristics, J. Geophys. Res., 100, 19299, 1995.