HAL Id: hal-00298335
https://hal.archives-ouvertes.fr/hal-00298335
Submitted on 30 May 2007
HAL is a multi-disciplinary open access
archive for the deposit and dissemination of
sci-entific research documents, whether they are
pub-lished or not. The documents may come from
teaching and research institutions in France or
abroad, or from public or private research centers.
L’archive ouverte pluridisciplinaire HAL, est
destinée au dépôt et à la diffusion de documents
scientifiques de niveau recherche, publiés ou non,
émanant des établissements d’enseignement et de
recherche français ou étrangers, des laboratoires
publics ou privés.
Scaling aspects of the sea-ice-drift dynamics and pack
fracture
A. Chmel, V. N. Smirnov, L. V. Panov
To cite this version:
A. Chmel, V. N. Smirnov, L. V. Panov. Scaling aspects of the sea-ice-drift dynamics and pack fracture.
Ocean Science, European Geosciences Union, 2007, 3 (2), pp.291-298. �hal-00298335�
Ocean Sci., 3, 291–298, 2007 www.ocean-sci.net/3/291/2007/
© Author(s) 2007. This work is licensed under a Creative Commons License.
Ocean Science
Scaling aspects of the sea-ice-drift dynamics and pack fracture
A. Chmel1, V. N. Smirnov2, and L. V. Panov2
1Fracture Physics Department, Ioffe Physico-Technical Institute, Russian Academy of Sciences, 194021 St. Petersburg, Russia
2Arctic and Antarctic Research Institute, Bering street, 38, 199397 St. Petersburg, Russia
Received: 12 October 2006 – Published in Ocean Sci. Discuss.: 30 January 2007 Revised: 12 April 2007 – Accepted: 15 May 2007 – Published: 30 May 2007
Abstract. A study of the sea-ice dynamics in the periods of
time prior to and during the cycles of basin-wide fragmenta-tion of the ice cover in the Arctic Ocean is presented. The fractal geometry of the ice-sheets limited by leads and ridges was assessed using the satellite images, while the data on the correlated sea-ice motion were obtained in the research sta-tions “North Pole 32” and “North Pole 33” established on the ice pack. The revealed decrease of the fractal dimension as a result of large-scale fragmentation is consistent with the localization of the fracture process (leads propagation). At the same time, the scaling properties of the distribution of amplitudes of ice-fields accelerations were insensitive to the event of sea-ice fragmentation. The temporal distribution of the accelerations was scale-invariant during “quiet” periods of sea-ice drift but disordered in the period of mechanical perturbation. The period of decorrelated (in time) ice-field motion during the important fracture event was interpreted as an inter-level transition in the hierarchic dynamical system. The mechanism of the long-range correlations in the sea-ice cover, including the fracture process, is suggested to be in re-lation with the self-organized oscilre-lation dynamics inherent in the ice pack.
1 Introduction
Two continuous processes determine, mainly, the mechani-cal behavior of the ice pack in the Arctic Ocean: the sea-ice drift and pervasive fracturing. These processes are highly interrelated because the fracture events occur due to inter-action between ice floes, and the large scale deformations are caused by the non-uniform pack motion. In recent years, it was revealed that the mechanical behavior of the Arctic sea-ice cover (ASIC) can be characterized by various
scal-Correspondence to: A. Chmel
ing exponents related to the elastic and strength properties of ice sheets. First of all, the plate-size distribution (num-ber of ice pieces as a function of their dimension) follows the power law over several orders of magnitude (Matsushita, 1985; Korsnes et al., 2004) as well as the geometric propor-tions between the area and “coastline” of ice floes (Chmel et al., 2005). This suggests that the plate dimension distribution in the ASIC is fractal (Hopkins et al., 2004). The deforma-tion rate that determines the fracture pattern in the ASIC is also scale invariant (Marsan et al., 2004). These spatial char-acteristics are combined with the temporal invariance of the sea ice motion (Chmel et al., 2005).
The mentioned above scaling features signalize that the mechanical behavior of the ice pack is highly correlated on scale levels, at least, 10 to 103km (Weiss, 2003; Marsan et al., 2004) (or, in terms of Overland (1995), from the level of individual plates to climate geophysical scales). This work is to demonstrate the response of the fractal properties of the lead-and-ridge pattern to basin-wide fracture events, and to consider the underlying mechanism of the correlated frac-ture in the ASIC issuing from the dynamics of pack motion. In other words, we show some intrinsic features of the sea-ice-drift dynamics and pack fracture seen by statistical physi-cists. The sources of information were the databases of field observations carried out in the ice-research stations of series “North Pole” (NP) NP 32 and NP 33 supplemented with the images from the NOAA satellite.
2 Fractality
2.1 Guiding analogy
In order to illustrate the scale invariance of the fracture events in nature, we shall consider the following example. Let us imagine a stone wall that bears a load or, at least, its own weight. The wall undergoes the action of wind pressure,
292 A. Chmel et al.: Sea-ice-drift dynamics and pack fracture
Fig. 1. A series of images dated of April 1999 when a giant lead
nucleated and propagated over about 300 km. The region covered by the image is shown on the top.
temperature gradients, solar radiation, etc. The aging pro-cesses develop themselves step by step. One day, or to be more precise, at a certain moment, the internal deformations overcome the aging-modified ultimate values, and the wall breaks down to pieces of different sizes. Numerous exper-iments and observations of fracture events of different kind
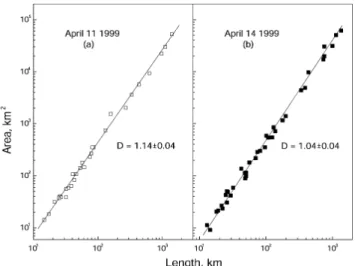
Fig. 2. Area versus perimeter dependences for ice-floes fragments
resolved in images obtained prior to the large event (a), on the day of event (b) and a few weeks after the event (c). The straight lines fit the power law dependence (2). The shown values of D were found from the slope of lines. The accuracy of the determination of D was estimated from the deviation of the slope at the end points of log-log plots with respect to the best-fit data of S versus L dependences.
suggest that if one measures the size distribution of pieces, it would be turned out that the number of wall fragments (n) is corresponded to their size (r) by the power law:
n(r) ∝ r−D (1)
where the power index D is the fractal dimension of the en-semble of fracture products. The experiment similar to this mental illustration was carried out by Carpinteri et al. (2004) who studied the breakage of blocks of constructional materi-als and confirmed the validity of relation (1). The occurrence of the power-law statistics evidences the absence of charac-teristic lengths because the function n(r) satisfies the scaling equation:
n(λr) = λ−Dn(r). (1a)
where λ is the scale factor. In our example, this means that the number of wall fragments of different sizes changes with the scale of observation λr as given by the Eq. (1a). The power law distribution of fracture products results from the long-range correlation of the fracture process itself: each new breakage of links affects not only the neighboring sites but the whole ensemble of sites in a way to maintain the crit-ical state (Caldarelli et al., 1996).
The ice cover is a kind of “horizontal” wall. Individual ice plates are restricted by leads (open water), cracks or pressure ridges. The action of compressive, tensile and shear stresses causes its fragmentation on various scale levels. Matsushita (1985) was the first who analyzed the size distribution of ice pieces (in the aerial photos of the frozen Okhotsk Sea) and he found the same relation (1) between the number and linear
A. Chmel et al.: Sea-ice-drift dynamics and pack fracture 293 dimension of ice plates. Thus he had shown that the ice-cover
fragmentation occur in a similar way on all scale levels. The scale invariance of this kind can be characterized quantitatively be the value of fractal dimension, which is available, in particular, from measurements of the area (S) and perimeter (L) of fractal collection of two-dimensional objects; the relation between S and L is also expressed by the power law (Mandelbrot et al., 1984):
SD∝L2. (2)
In the next section we shall demonstrate the validity of the relation (2) as applied to the vast areas of the fragmented ice cover, and consider the response of the value D to large scale mechanical perturbations in the ASIC.
2.2 Sea-ice cover fragmentation 2.2.1 Shore interference
Figure 1 shows a series of AVHRR images of April 1999 where a large-scale event was detected in the geographical region depicted in the cut-in. The appearance of the branch-ing lead on 14 April was followed by prevailbranch-ing transverse fragmentation with formation of smaller “debris” (compare Fig. 1b and Fig. 1c). We suppose that this fracture event was caused by the shore interference that affected strongly the ice cover drift in April 1999. This was concluded from the moni-toring of a set of reference points (well-recognizable patches of free water selected throughout the region of observation). From 7 to 12 April the distances between reference points gradually decreased so indicating the effect of ice compres-sion. The quasi-stationary drift was disturbed on 12–13 April by the appearance of a strong rotational component accom-panied with translations along the leads. Such the behavior is typical for ice-cover/offshore interaction. The measured dependences of S on L referred to images obtained prior to and after ice fracturing are depicted in Fig. 2. One can see a difference in the slope of two L versus S linear dependences plotted in doubly logarithmic coordinates. According to rela-tion (2), the increase of the slope after the event of fragmen-tation signifies the decrease of the D-value (from 1.14±0.04 to 1.04±0.04). Physically, the decrease of D evidences the localization of the process; in our case, this indicates a partial loss of the planar structure with a trend to one-dimensional organization (propagating leads). The fractal dimension was also determined from satellite images obtained a few days prior to 14 April 1999, and a few weeks after that day. Un-fortunately, during the posterior period the cloudiness shaded the ice-cover pattern, and it was impossible to measure the geometric parameters of ice pieces. A variation of the fractal dimension value of the sea-ice cover pattern in the available period of time is shown in Fig. 3a.
Fig. 3. Variation of the fractal dimension value of the sea-ice cover
pattern in 1999 (a) and 2004 (b). The lines serve as guides for the eyes. The data in the periods of time after large events were not available due to the dense cloudiness (designated by dotted lines).
2.2.2 Atmospheric depression
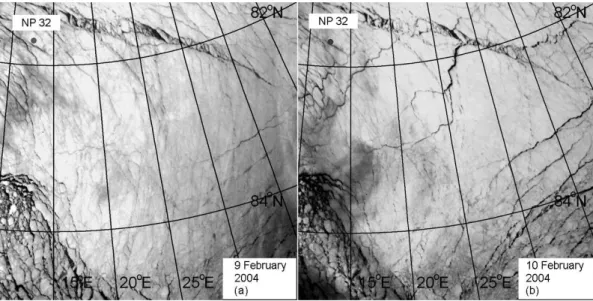
The ice-drift in the Arctic Ocean is driven, mainly, by the wind forcing (Lewis et al., 1994; Richter-Menge and Elder, 1998), and the variability of the weather pattern causes cy-cles of redistribution of stresses and deformations with ice breaking (Hopkins et al., 2004) followed by refreezing (Ko-rsnes et al., 2004). On 10 February 2004, a basin-wide sea-ice fragmentation occurred, and it was detected in the satel-lite images. Figure 4 shows the NOAA satelsatel-lite images of the region of drift obtained on 9 February and 10 Febru-ary 2004. In Fig. 4b one can see large-scale leads (up to 400 km in length), which formed in one day between two subsequent images and a position of the research station NP 32 that drifted on the pack during that period of time. The displacements and fragmentation of the ice-cover lasted dur-ing the whole February; on 2 March 2004 the research station NP 32 was abandoned in connection with multiple breakage of the ice-field on which the observations were carried out.
Any shore interference is not seen in the images; there-fore, the large-scale perturbation was referred to a passage of the deep atmospheric depression over the region. This de-pression was recorded in the database of the station NP 32 (Chmel and Smirnov, 2005) in the time interval covering the event of 10 February 2004. The presence of the station NP 32 in the region of perturbation gave us a rare opportunity to put in comparison the visual data obtained using the remote technique with the results of field observations.
294 A. Chmel et al.: Sea-ice-drift dynamics and pack fracture
Fig. 4. 400×400 km fragments of satellite images of the region of NP 32 drift obtained on 9 February (a) and 10 February (b) 2004. A
branched, newly formed lead is seen in (b).
A variation of the D-value in the period of interest (Fig. 3b) was available from the analysis of a series of satel-lite images obtained before and after the catastrophic frag-mentation. Similar to the event of 14 April 1999, a certain decrease of D was detected in the day of event of 10 Febru-ary 2004.
A posterior analysis of the database of field observations revealed a response to the event of 10 February not only in the geometric relations of ice floes, but also in the dynamics of sea-ice motion. In the next Section, the temporal correla-tion of ice-field acceleracorrela-tions in quiet and excited periods of the ice drift will be considered.
3 Drift dynamics
3.1 Accelerations
The drift of the station NP 32 was monitored with the help of the GPS system with space and time resolutions 15 m and 10 min, respectively. On the base of these data, the ice-field speed (V ) and accelerations A=1V/1t were calculated (here
1V is the variation of drift rate measured in regular intervals
1t=10 min).
It has been shown previously (Chmel et al., 2005), that both positive and negative accelerations produce an approxi-mately equivalent contribution to the total distribution of ac-celerations. Therefore, when processing the data, only the absolute values of accelerations were under consideration:
A ≡ |A| = |1V |/1t . (3)
A sequence of ice-field accelerations recorded in the time interval covering the event of 10 February 2004 is depicted in Fig. 5.
3.2 Temporal correlation
A temporal correlation between events can be found from the time distribution of events of a certain importance. In this work, a time series of values A determined during January– February, 2004 was used to construct the function of distribu-tion of intervals (waiting times, τ ) between the most signif-icant accelerations, that is between those whose amplitudes exceed a certain cut-off value Acut−off: NA>Acut−off(>τ ). To specify the value Acut−off, one should take into account a well-established trend in correlated statistical series of dif-ferent nature: the greater event the more correlation (Chris-tensen and Olami, 1992). In this analysis we considered the contribution of accelerations with amplitudes
A > Acut−off=8 × 10⁻⁴m/s2. (4) These accelerations constituted ∼20 per cent of all drift-rate variations detected during the given period of time. A range of variation of times τ covered the range from 6×10²s to
∼1.3×10⁴s.
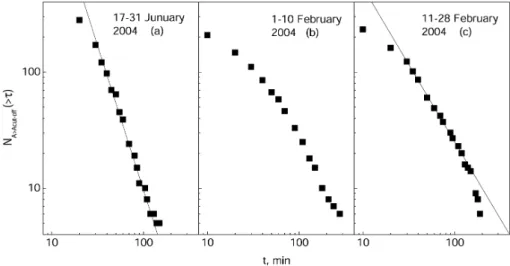
The functions NA>Acut−off(>τ ) were found for three pe-riods of observations: (a) from 17 January to 31 January (a “remote” period); (b) 1 February to 10 February (a period prior to the “catastrophic” ice perturbation); (c) 11 February to 28 February (a “posterior” period).
To construct NA>Acut−off(>τ ) graphically, the number of subsequent events NA>Acut−offseparated by the time inter-val that exceeds τ was plotted against τ in doubly logarith-mic coordinates (Fig. 6). Three constructed distributions of waiting time are unambiguously different. In Figs. 6a and c, corresponded to remote and posterior periods, respectively, the NAversus τ dependences exhibit the power law: NA>Acut−off(> τ ) ∝ τδ (5)
A. Chmel et al.: Sea-ice-drift dynamics and pack fracture 295 shown by straight lines in these figures. The power law
dis-tribution of waiting times is an indication of the long-time correlation between events: “the system refers to its history in order to define its future” (Kapiris et al., 2003). At the same time, the time sequence of ice-field accelerations does not follow the power law in the immediate time interval be-fore the “catastrophic” perturbation (Fig. 6b).
The latter finding evidences the decorrelation of ice-drift dynamics in the pre-catastrophic period of time. To under-stand the mechanism of this decorrelation, we analyzed the field records of meteorological parameters and found that the period 1 to 10 February was characterized by very low air temperatures (−35 to −45◦C). We suppose that such tem-perature drops induce freezing cycles with suppressing the mobility of ice sheets, and, thus, disturb the temporal correla-tion of the drift. In addicorrela-tion, a restricted mocorrela-tion of ice-sheets hinders both the energy exchange, and the stress/deformation redistribution. During prolonged freezing cycles, such as that that occurred in February 2004, the suppression of the energy discharge through local shear and impact interactions caused the appearance of zones of overstress and promoted the ice cover fragmentation.
3.3 Force scaling
The distribution of forces acting on the ice-field of a given mass is identical to the distribution of its accelerations. Therefore, in order to determine the distribution of local forces that induced the accelerations, the amplitude distri-bution functions N (>A) (here N is the number of events, in which the amplitude of acceleration exceeds A) were con-structed using the January and February databases of the NP 32. The functions plotted in log-log coordinates (Fig. 7) ex-hibit portions approximated with straight lines over at least one and a half decade. The exponents of the power law:
N (> A) ∝ A−γ (6)
were found from the graphs’ slope. Unlike the exponent τ that characterizes the temporal pattern of accelerations, the values γ were found to be close to each other in January and February (3.0±0.1 and 3.2±0.3, respectively). The divid-ing of the February database into two portions related with “catastrophic” and “posterior” periods did not affect the re-sult (not shown) but made the statistics worse. Consequently, the force distribution in the sea-ice remains scale-invariant both in quiet and excited periods of the drift.
4 Oscillation processes
The above described scale invariance of the fragmentation and drift of the sea ice was formally derived from either spatial or temporal relations between the parameters char-acterizing, respectively, the geometry and the motion of the ice cover. The shown satellite images give a picture of
Fig. 5. Amplitudes of accelerations measured in the time interval
from 4 February to 22 February 2004. A gap on 14–15 February is caused by excluding the data recorded during the ice breakage in the close vicinity of the GPS sensor position.
the self-organized behavior of the sea-ice both during the quasi-stationary drift, and in the periods of mechanical per-turbations. Meanwhile, the mechanism, which controls the long-range interaction of sea-ice cover fragments and the “memory” about preceding events (expressed by the power law distributions of, respectively, dimensions and times), re-mains shaded since the driving force of the self-organization cannot be determined in the framework of the statistical physics (excluding general thermodynamical principles, Ar-neodo, 1995). A formalistic description of events restricts the possibility of the analysis and prediction of the behav-ior of sea ice even with taking into account the features of self-organization. Therefore, one should search the physical processes in the ice pack, which could result in correlated fracture events in the ASIC. In this light, the pack oscilla-tions are of particular interest since the oscillation processes of various nature arise and extend in the sea ice permanently thus maintaining the dynamical connectedness between com-ponents and realizing long-range interactions over this dy-namical system (Smirnov, 1995, and references therein).
The spectrum of oscillations is composed of periodic mo-tions due to ripple and those due to slip-stick and impact interactions accompanied with hummocking and cracking. In contact interactions the amplitudes of the horizontal dis-placements are much higher than the amplitudes of the verti-cal components (Martin and Drucer, 1991). The character of elastic waves is directly connected with the value and distri-bution of the deformations and stresses.
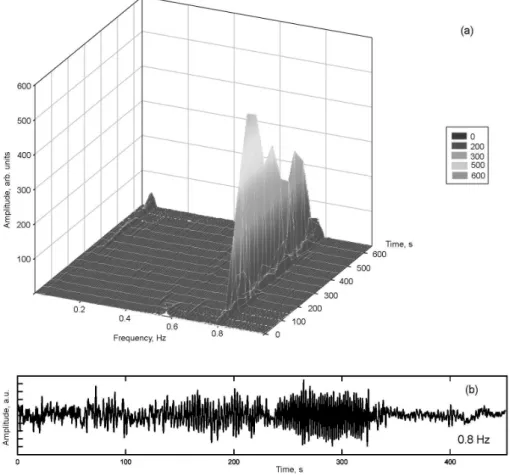
Figure 8a represents a typical example of horizontal os-cillations excited by shearings, which were recorded with the help of accelerometers in the station NP 33 in June, 2005. Chaotic oscillations at 0.8 Hz (Fig. 8b) transformed to quasi-harmonic auto-oscillations; in a few minutes the
296 A. Chmel et al.: Sea-ice-drift dynamics and pack fracture
Fig. 6. Number of waiting times NA(> τ ) with duration higher than given by the corresponding abscissa. The straight lines fit the power
law NA(>τ )∝τγ. Only accelerations with amplitudes higher than Acut−off=8×10⁻⁴m/s2were taken into account.
Fig. 7. Number of accelerations with amplitudes higher than that
given by the corresponding abscissa. The straight lines show the power law N(>A)∝A−δ.
process ceased due to aligning of the interacting compo-nents. No relations with meteo-factors were detected in this and other similar records; consequently, the observed auto-oscillations emerge as a self-organizing process under the permanent (non-periodic) external force. Synchronous ob-servations carried out using sensors established on adjacent ice fields showed that the correlation radius of such phenom-ena could exceed the dimensions of individual pack compo-nents with involving into the correlated motion important ar-eas up to the basin scale (Smirnov, 1995).
The oscillation processes in the sea ice are highly affected by the rheological properties of this medium. Under the pro-longed (non-impact) action of the compressive/tensile force, a feedback between the energy input and the deformation
properties of the oscillating domain composed of adjacent sheets takes place; this effect causes the parametric redis-tributing of the vibrational energy. As a result, the period and amplitude of oscillations do not depend on the outer forcing and are determined by the properties of the vibra-tional system. The parametric interaction leads to the auto-oscillations seen in Fig. 8. In contrast to forced auto-oscillations under the action of periodic force, the energy input from a non-vibrational external source to the auto-oscillation dissi-pative system is dosed by the system itself. Thus, the energy of compression/tension transforms to the correlated motion of ice sheets.
5 Discussion
The scaling properties of the sea-ice drift dynamics and fracturing in the ASIC are shown to be sensitive to large-scale perturbations. The fractal dimension of the collec-tion of fragments limited by leads, cracks and ridges de-creases in response to the fracture events in agreement with well-established trend of decreasing the dimensionality of the fracturing system due to fault nucleation (Zang, 1998; Kapiris 2004). (A term “fault” in this context is applicable to giant leads like those seen in Fig. 1b and Figs. 4b, c, Weiss, 2003).
The response of scale-invariant parameters of the drift dy-namics is not so well defined. The distribution of the ampli-tudes of accelerations, which is equivalent to the force distri-bution in the ice cover, was found to be almost the same both in the period of quasi-stationary drift and during the basin-wide ice cover fragmentation. The temporal correlation (ex-pressed by the power-law distribution of waiting times be-tween significant accelerations in the quiet period of drift)
A. Chmel et al.: Sea-ice-drift dynamics and pack fracture 297
Fig. 8. Spectrum of oscillations induced by horizontal displacements of the ice-field recorded in the NP 33 in June 2005 (a). (b) shows the
formation and frustration of quasi-harmonic oscillations at frequency 0.8 Hz.
was, in contrast, disturbed during the intensive fracture pro-cess.
Scaling is inherent to critical phenomena where an in-significant event could trigger a “global” perturbation. The lack of the time correlation in the behavior of a critical sys-tem occurs, for example, under the condition of phase tran-sition when the temporal sequence of events is fully disor-dered. In this light, the fracture of heterogeneous materi-als could be regarded as a sort of dynamic phase transition (Bouchaud, 1997). The used term “heterogeneous” implies the presence of multi-scale or hierarchic structure. The hi-erarchic concept of sea-ice morphology was put forward by Overland et al. (1995). They pointed out the existence of a set of scale levels related to specific formations, such as crys-tals, blocks, floes, and the basin as a whole. In the framework of the hierarchic approach, the fracture processes that take place on different levels are, to a significant extent, indepen-dent (as controlled by forcing of different nature) but they are self-similar. The degree of disconnection of events con-stitutes the organization of the hierarchic system. The dam-ages of a lower scale level could form a “cluster” of damdam-ages that would be an isolated (but structurally similar) damage of a higher level. The inter-level transition in a multi-scale
sys-tem can disturb a time sequence of events at adjacent levels if the “reservoir of weak points” on the lower level is depleted, and the number of newly-forming damages of higher level is insufficient for statistics. However, the force distribution remains all the time scaled and unchanged since it does not depend on the events’ sequence.
Consequently, the observed response of the temporal statistics of the sea-ice drift to the large-scale perturbation in combination with the invariability of the force distribution can be interpreted as a manifestation of the transient process in the critical, hierarchic system.
The feedback mechanism needed for maintaining the crit-ical state is realized through ice shearings under the action of both external and internal forces. A spectrum of such shearings is related with different modes of deformation and fracture of contact zones in the sea-ice. The horizontal ice shearings result in auto-oscillations of different spatial and temporal scales, which provide the local stress release; the whole system returns to the equilibrium/critical state until another event occur. Thus, the spectrum of cyclic shearings of ice reflects a variety of self-similar processes in the perma-nently critical system. The parametric interactions of oscil-lations provide conditions for the energy re-distribution over
298 A. Chmel et al.: Sea-ice-drift dynamics and pack fracture vast areas, what is the requirement for self-organizing of the
system.
6 Conclusions
The temporal invariance of the ice drift dynamics in com-bination with the fractal geometry of ice sheets allows one to consider the ASIC as a space-time fractal domain. Large-scale perturbations in the ASIC, which manifest themselves by the short-time basin-wide fragmentations of the ice cover, do not affect neither scaling properties of the fracture pattern, nor self-similarity of the force distribution in the pack; however, the temporal correlation of the ice-field motion becomes disturbed in the periods of fragmentation. This kind of decorrelation is similar to the phase transition in the heterogeneous system whose transient metastable state is characterized by disordered sequence of events. The mechanism of the long-range correlation in the sea-ice cover is related with the self-organized oscillation dynamics inherent in the ice pack.
Edited by: K. D¨o¨os
References
Arneodo, A., Bacry, E., and Muzy, J. F.: The thermodynamics of fractals revisited with wavelets, Physica A, 213, 232–275, 1995. Bouchaud, E.: Scaling properties of cracks, J. Phys.: Cond. Matter,
9, 4319–4344, 1997.
Caldarelli, G., Di Tolla, F. D., and Petri, A.: Self-organization and annealed disorder in a fracturing process, Phys. Rev. Lett., 77, 2503–2506, 1996.
Carpinteri, A., Lacidogna., G., and Pugno, N.: Scaling of energy dissipation in crushing and fragmentation: a fractal and statisti-cal analysis based on particle size distribution, Int. J. Fracture, 129(1), 131–139, 2004.
Chmel, A. and Smirnov, V. N.: Forestalling response of the corre-lated sea-ice drift dynamics to the approaching atmospheric de-pression, Fifth Annual Meeting of the European Meteorological Society, Utrecht, Abstract A-00131, 2005.
Chmel, A., Smirnov, V. N., and Astakhov, A. P.: The fractality of sea ice drift dynamics as revealed from the “North Pole 32” mon-itoring, JSTAT P02002, 2005.
Christensen, K. and Olami, Z.: Scaling, phase transitions, and nonuniversality in a self-organized critical cellular-automation model, Phys. Rev. A, 46, 1829–1838, 1992.
Hopkins, M. A., Frankenstein, S. F., and Thorndike, A. S.: Forma-tion of an aggregate structure in the Arctic ice pack, J. Geophys. Res., 109, C01032, doi:10.1029/2003JCool1855, 2004. Kapiris, P. G., Balasis, G. T., Kopabas, J. A., Antonopoulos, G. N.,
Peratzakis, A. S., and Eftaxias, K. A.: Scaling properties of mul-tiple fracturing of solid materials, Nonlin. Processes Geophys., 11, 137–151, 2004,
http://www.nonlin-processes-geophys.net/11/137/2004/. Kapiris, P. G., Eftaxias, K. A., Nomikos, K. D., Polygiannakis, J.,
Dologlou, E., Balasis, G. T., Bogris, N. G., Peratzakis, A. S., and Hadjicontis, V. E.: Evolving towards a critical point: A possible electromagnetic way in which the critical regime is reached as the rupture approaches, Nonlin. Processes Geophys., 10, 511–524, 2003, http://www.nonlin-processes-geophys.net/10/511/2003/. Korsnes, R., Souza, S. R., Donangelo, R., Hansen, A., Paczuski,
M., and Sneppen, K.: Scaling in fracture and refreezing of sea ice, Physica A, 331, 291–296, 2004.
Lewis, J. K., Tucker, W. B., and Stein, P. J.: Observation and mod-eling of thermally induced stresses in first-year ice, J. Geophys. Res., C99, 16 361–16 371, 1994.
Mandelbrot, B. B., Passoja, D. F., and Paullay, A. J.: Fractal char-acter of fracture surfaces of metals, Nature, 308, 721–723, 1984. Marsan, D., Stern, H., Lindsay, R., and Weiss, J.: Scale dependence and localization of the deformation of Arctic sea ice, Phys. Rev. Lett., 93, 178501, doi:10.1103/PhysRevLett.93178501, 2004. Martin, S. and Drucer, R.: Observation of short-period ice floe
ac-celerations during leg II of the Polarbjorn drift, J. Geophys. Res., 96, 10 567–10 580, 1991.
Matsushita, M. L.: Fractal viewpoint of fracture and accretion, J. Phys. Soc. Japan, 54, 857–860, 1985.
Overland, J. E., Walter, B. A., Curtin, T. B., and Turet, P.: Hierarchy and sea ice mechanics: a case study from the Beaufort Sea, J. Geophys. Res., 100, 4559–4571, 1995.
Richter-Menge, J. A. and Elder, B. C.: Characteristics of pack ice stress in the Alaskan Beaufort sea, J. Geophys. Res., C103, 21 817–21 829, 1998.
Smirnov, V. N.: Dynamic processes in sea ice, edited by: Timokhov, L. A., Gidrometeoizdat, St. Petersburg (in Russian), 1995. Weiss, J.: Scaling of fracture and faulting of ice on earth, Surv.
Geophys. 24, 185–227, 2003.
Zang, A., Wagner, F. C., Stanchits, S., Dresen, G., Andresen, R., and Haidekker, M. A.: Source analysis of acoustic emission in Aue granite cores under symmetric and asymmetric compressive loads, Geophys. J. Intern., 135, 1113–1130, 1998.