HAL Id: hal-01389713
https://hal.univ-reunion.fr/hal-01389713
Submitted on 29 Oct 2016HAL is a multi-disciplinary open access
archive for the deposit and dissemination of sci-entific research documents, whether they are pub-lished or not. The documents may come from teaching and research institutions in France or abroad, or from public or private research centers.
L’archive ouverte pluridisciplinaire HAL, est destinée au dépôt et à la diffusion de documents scientifiques de niveau recherche, publiés ou non, émanant des établissements d’enseignement et de recherche français ou étrangers, des laboratoires publics ou privés.
A quantitative evaluation of the contribution of crustal
rocks to the shear-wave splitting of teleseismic SKS
waves
Guilhem Barruol, David Mainprice
To cite this version:
Guilhem Barruol, David Mainprice. A quantitative evaluation of the contribution of crustal rocks to the shear-wave splitting of teleseismic SKS waves. Physics of the Earth and Planetary Interiors, Elsevier, 1993, 78, pp.281 - 300. �10.1016/0031-9201(93)90161-2�. �hal-01389713�
A quantitative evaluation of the contribution of crustal rocks
to the shear-wave splitting of teleseismic SKS waves
Guilhem Barruol *, David Mainprice
Laboratoire de Tectonophysique, Université Montpellier Il, F-34095 Montpellier, Cedex 05, France (Received 5 February 1992; revision accepted 30 June 1992)
ABSTRACT
The seismic (elastic) properties of the crust have been modelled using hypothetical polycrystals with typical crustal compositions and commonly measured petrofabrics. This modelling allows us to better evaluate and quantify the crustal contribution to splitting of teleseismic SKS-waves. Mafic rocks such as anorthosite or pyroxene-bearing gabbros have complex S-waves properties, i.e. with small shear-wave anisotropies ( < 3%) and without clear relationships between the fast shear-wave polarization plane orientations and the fabric. On the other hand foliated felsic rocks such as gneisses or schists and mafic rocks such as amphibole-bearing gabbros are strongly birefringent (anisotropies greater than 5%) and exhibit clear relationships with the structure. Biotite and amphibole preferred orientations clearly play a major rote in shear-wave splitting in crustal rocks. We show strong correlations between the orientation of the foliation and the amplitude of the delay time. Maximum delay time is systematically observed for waves propagating parallel to the foliation. The fast shear-wave is furthermore polarized parallel to the foliation plane. We calculate a delay time of about 0.1-0.2 s per 10 km of crustal rocks.
1. Introduction
To better constrain the magnitude and orien tation of the mantle anisotropy using splitting of teleseismic SKS-waves it is important to evaluate the crustal contribution to the observed total delay time. A direct way is to measure the delay from splitting of PmS waves (e.g. McNamara et al., 1989). In this paper, we propose an alterna tive approach: we calculate the S-wave seismic properties of hypothetical rocks and then we esti mate the delay time for various typical crustal rocks with various orientations. We show that the crust in some specific cases may generate a signif icant splitting.
Seismic anisotropy of rocks is increasingly in vestigated and shows relationships with the struc ture (foliation, lineation) (see reviews by Kern (1990) and Fountain and Christensen (1989)). This link between deformation fabric and seismic
* Corresponding author
properties may provide a powerful method to derive tectonic interpretations from seismic data. From this point of view, shear-waves propagating through anisotropie media are particularly inter esting because their analysis may be very infor mative. A shear-wave crossing an anisotropie medium splits into two shear-waves which propa gate at different velocities and which are perpen dicularly polarized (e.g. Crampin, 1985). This phenomenon is called birefringence. From three component seismic records, one can extract: (1) the arrivai time of each shear-wave; (2) the differ ence in arrivai times (or delay time) between the two perpendicularly polarized waves which is a fonction of the thickness and intrinsic anisotropy of the anisotropie medium; (3) the orientation of the polarization planes which reflects the orienta tion of the structure.
Seismic anisotropy, and hence shear-wave splitting, has two different origins: microcrack-in duced anisotropy and anisotropy due to minerai lattice preferred orientation (LPO). Crack-re lated anisotropy obviously plays an important role
at low effective confining pressure or at high pore fluid pressure and may have a dominant role in the upper crust (e.g. Peacock et al., 1988; Crampin et al., 1990). In the middle to lower crust, LPO is expected to be the major cause of seismic anisotropy. To better evaluate the shear-wave delay time due to the lower and middle crust, we focus in this paper on the effect of rock petrofab ric on shear-wave splitting.
In the first part of this paper, we review the birefringence data obtained through direct labo ratory measurements. This has some implications for anisotropy magnitude and orientation in crustal rocks. in the second part, combining single crystals' stiffness coefficients and measured petrofabrics, we calculate the seismic properties of hypothetical rocks with typical LPO and modal compositions. We show that the results obtained by the calculations are in complete agreement with the direct velocity measurements. In the last section of this study we evaluate the delay time due to the crust on typical SKS records, using simple crustal structures and realistic lithologies.
Vpx
Vpy
2. Birefringence of crustal rocks from direct ve locity measurements
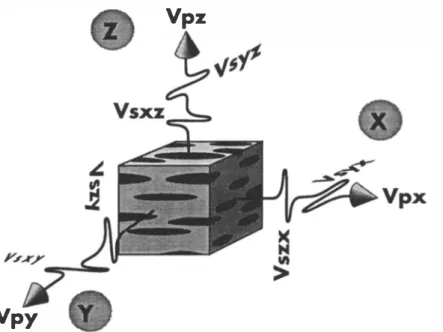
Although many laboratory S-wave measure ments have been carried out over the last 25 years, very few studies have investigated shear wave splitting (SWS), i.e. measured seismic veloc ities of the two perpendicularly polarized S-waves for each propagating direction. Here we present the birefringence data available in the literature. Ail measurements were carried out in the struc tural reference frame (X, Y and Z, XY being the foliation plane, X representing the lineation and
Z the foliation pole) parallel to the three struc
tural directions, as shown in Fig. 1. For rocks from the Santa Rosa Mylonite zone (Kern and Wenk, 1990) SWS was only measured along the
X- and Z-axis. For metamorphic rocks (Christen
sen, 1966), only one seismic velocity was mea sured along the Z-axis because splitting was not significant. Rocks studied by Barruol et al. (1992) and by Barruol and Kern (1993) were, respec tively, sampled in the Saint Barthélémy massif
Fig. 1. Schematic diagram showing the orientations of P- and S-wave velocity measurements in the structural reference frame (X,
Y, Z) on a cube-shaped specimen. For instance, V
Px represents VP measurements along the X direction and V.xY represents velocity measurements of a shear-wave polarized within the XY plane and propagating along the Y direction.
(Pyrénées, France) and in the Ivrea zone (north ern Italy). Data from Seront et al. (1993) have been obtained on an Oklaoma anorthosite.
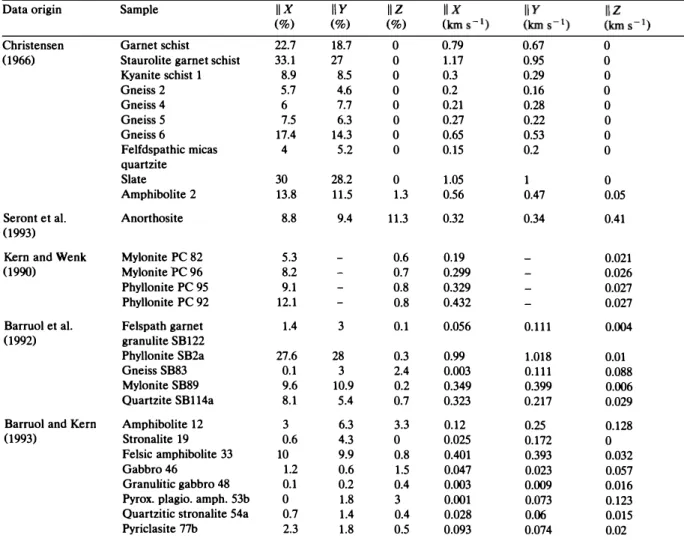
Table 1 summarizes birefringence values (V.max
- V.min) in kilometres per second at 600 MPa
confining pressure and the percentage of birefrin gence anisotropy defined as [(V.max - V.min)/
V.mean ]lOO, with V.mean =(V.max+ V.min )/2. Bire
fringence may reach 1 km s - i but typical birefrin
gences range between 0.1 and 0.3 km s - t. Bire fringence is often higher for propagation parallel to the X- or Y-axes than to the Z-axis. Figure 2
TABLE 1
shows the frequency histograms of the measured birefringence for each structural direction of the 28 samples. Distributions of values along the X and Y directions are very similar. The maximum number of measured anisotropies are lower than 4% for these two directions but the spectrum is very wide and about 50% of samples exhibit significant anisotropies (above 4%). On the other band, anisotropies measured along the Z struc tural axis (Fig. 2, right) are systematically lower than 4% (and frequently less than 1 %, see Table 1), except for plagioclase-rich rocks. Similarly,
Summary of the birefringence obtained by direct laboratory measurements Data origin
Christensen (1966)
Seront et al. (1993)
Kem and Wenk (1990) Barruol et al. (1992)
Barruol and Kem (1993)
Sample Gamet schist Staurolite gamet schist Kyanite schist 1 Gneiss 2 Gneiss 4 Gneiss 5 Gneiss 6 Felfdspathic micas quartzite Slate Amphibolite 2 Anorthosite Mylonite PC 82 Mylonite PC 96 Phyllonite PC 95 Phyllonite PC 92 Felspath gamet granulite SB122 Phyllonite SB2a Gneiss SB83 Mylonite SB89 Quartzite SB114a Amphibolite 12 Stronalite 19 Felsic amphibolite 33 Gabbro 46 Granulitic gabbro 48 Pyrox. plagio. amph. 53b Quartzitic stronalite 54a Pyriclasite 77b IIX (%) 22.7 33.1 8.9 5.7 6 7.5 17.4 4 30 13.8 8.8 5.3 8.2 9.1 12.1 1.4 27.6 0.1 9.6 8.1 3 0.6 10 1.2 0.1 0 0.7 2.3 IIY (%) 18.7 27 8.5 4.6 7.7 6.3 14.3 5.2 28.2 11.5 9.4 3 28 3 10.9 5.4 6.3 4.3 9.9 0.6 0.2 1.8 1.4 1.8 IIZ (%) 0 0 0 0 0 0 0 0 0 1.3 11.3 0.6 0.7 0.8 0.8 0.1 0.3 2.4 0.2 0.7 3.3 0 0.8 1.5 0.4 3 0.4 0.5 0.79 1.17 0.3 0.2 0.21 0.27 0.65 0.15 1.05 0.56 0.32 0.19 0.299 0.329 0.432 0.056 0.99 0.003 0.349 0.323 0.12 0.025 0.401 0.047 0.003 0.001 0.028 0.093 0.67 0.95 0.29 0.16 0.28 0.22 0.53 0.2 1 0.47 0.34 0.111 1.018 0.111 0.399 0.217 0.25 0.172 0.393 0.023 0.009 0.073 0.06 0.074 0 0 0 0 0 0 0 0 0 0.05 0.41 0.021 0.026 0.027 0.027 0.004 0.01 0.088 0.006 0.029 0.128 0 0.032 0.057 0.016 0.123 0.015 0.02
Reported data have been obtained at 600 MPa confining pressure and at room temperature. The birefringence values (km s -1) and the birefringence anisotropy (%) for each sample, as defined in the text, are presented.
TABLE 2
Modal composition of the samples for which direct birefringence measurements have been performed Sample Quartz Micro. Biotite Plagio. Amphib. Others Garnet schist 29.0 0.0 30.0 35.0 0.0 5.0 al., 1.0 ma. Staurolite garnet schist 44.0 0.0 23.0 13.0 13.0 mu., 2.0 al. Kyanite schist 1 8.0 14.0 23.0 23.0 mu., 2.0 al. Gneiss2 22.1 38.7 5.3 22.7 1.4 mu.
Gneiss4 19.5 0.4 16.5 45.6 17.4 0.1 mu., 0.3 sp., 0.2 ma. Gneiss5 8.9 18.3 50.0 21.5 1.3 cl.
Gneiss6 39.4 20.8 31.9 4.1 mu., 2.8 al., 1.0 si. Felspathic mica quartzite 68.9 10.1 20.2 0.5 mu., 0.2 ap., 0.1 al. Slate Anorthosite 90.0 10.0 ol. Mylonite PC82 24.0 14.0 9.0 49.0 Mylonite PC96 26.0 13.0 11.0 50.0 Mylonite PC95 26.0 7.0 9.0 55.0 Mylonite PC92 25.0 7.0 9.0 55.0
Felsic acid gran. SB122b 45.0 10.0 8.0 12.0 15.0 gar., 5.0 si., 5.0 pyrox
PhylloniteSB2a 100
GneissSB83 35.0 28.0 15.0 18.0 2.0 gar., 2.0 si., MyloniteSB89b 30.0 15.0 45.0 10.0
QuartziteSB114a 100.0
Amphibolite 12 4.0 35.0 59.0 1.0 ox.
Stronalite 19 55.0 10.3 8 sill., 25.2 gar., 1.5 ox. Felsic amphibolite 33 35.8 54.2 8 pyrox., 2.0 ox. Stronalite 46 35 55 feldsp., 10 pyrox. Granulitic gabbro 48 58.0 19.0 horn. 23.0 pyrox.
Pyroxenite plagio. 53b 25.4 68.5 pyrox., 4.5 spi., 1.6 ox. Quartzitic stronalite 54a 48.4 37.0 13.8 pyrox., 0.8 ox. Pyriclasite 77b 47.0 52 pyrox., 1 ox.
al, almandite; ma, magnetite; mu, muscovite; sp, sphene; cl, clinozoisite; si, sillimanite; ap, apatite; ol, olivine; gar, garnet; ox, oxydex; spi, spinel; pyrox, pyroxene; feldsp, feldspar.
28 28
..
C 24//X
a
24// y
b
20 20"'
t
16 16 •.;::: 12 12 8 8 4 4 0 0 4 8 1 2 1 6 20 2 4 28 32 36 40 4 8 1 2 16 20 2 4 28 32 36 40 4 8 12 16 20 24 28 32 36 40Birefringence range (%) Birefringence range (%) Birefringence range (%)
Fig. 2. Summary diagrams showing the frequency of measured birefringence anisotropies (as defined in the tex!). Each diagram corresponds to a structural direction (see Table 1). Birefringence anisotropy measured normal to the foliation (along the Z
structural axis) is systematically lower than 4%, and in 80% of the samples it is lower than 1 %. On the other hand birefringence measured along the X and Y directions displays a very similar pattern: the maximum number of anisotropies is lower than 4% but about 50% of the samples exhibit birefringence anisotropies higher than 4%. The total number of measurements is 28.
average birefringence anisotropies (Fig. 3) clearly show high values within the foliation plane (9% and 8%, respectively, along the X and Y direc tions) and very low values for waves propagating normal to the foliation plane (about 1 % ).
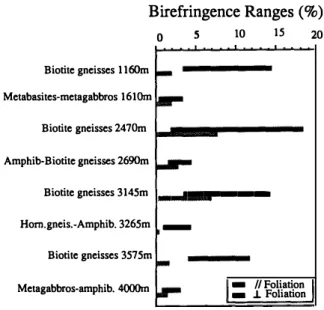
Laboratory measurements of shear-wave split ting have been performed at confining pressures up to 600 MPa on 45 drilled rocks sampled in the KTB hole (Kern et al., 1991) (Fig. 4). In the rock samples (biotite gneisses, amphibolites, metagab bros) the shear-wave splitting is systematically higher within the foliation plane than normal to it.
In summary laboratory S-wave birefringence measurements performed on gneissic or amphi bolitic rocks show strong splitting within the folia tion plane whereas splitting normal to the folia tion is very small.
The main factor controlling the shear-wave splitting at high confining pressure (above 200 MPa) has been interpreted as being modal com position and minerai lattice preferred orientation of the rocks (particularly of phyllosilicates). At low confining pressure, the main factor control ling velocity variations is microcracks. Kern (1990) clearly shows that microcracks close at about 200 MPa confining pressure. Above 200 MPa, the intrinsic minerai seismic properties become
domi-,,-..., 10 �
•
'-" (1)/IX
u
8•
� (1)//Y
�-�
6-(1)-�
4-.D
(1)//Z
� 2-•
Total= 28 measurements 0Structural direction
Fig. 3. Average birefringence anisotropies (as defined in the text) for the 28 measurements for the three structural direc tions.
Birefringence Ranges(%)
Biotite gneisses 1160m Metabasites-metagabbros 1610m Biotite gneisses 2470m Amphib-Biotite gneisses 2690m 0 5 10 15 Biotite gneisses 3145ml-..11•r--
Horn.gneis.Amphib. 3265m -Biotite gneisses 3575m Metagabbros-amphib. 4000m - //Foliation - .L Foliation 20Fig. 4. Birefringence ranges measured on about 45 samples (Kern, 1991), drilled in the KTB hole. The vertical axis represents the schematic lithologie units and the correspond ing depth ranges. Birefringences have been measured in di rections normal to the foliation (grey) or for S-waves propa gating along directions contained within the foliation plane (black). Birefringence is systematically lower when measured normal to the foliation.
nant. Variations of seismic velocities are mainly controlled by their pressure and temperature derivatives. Biotite and amphibole have often been described as playing a major role in anisotropy for P- and S-waves (e.g. Fountain et al., 1984; McDonough and Fountain, 1988; Kern and Wenk, 1990; Barruol et al., 1991).
3. Calculations of SWS from petrofabric data Three-dimensional (3-D) distribution of seis mic velocities (Vp, V., shear-wave birefringence) in an anisotropie polymineralic rock is calculated from single crystal densities and elastic stiffness coefficients, LPO and volume fraction of each minerai species. Using an interactive program (Mainprice, 1990), the procedure for the calcula tion of seismic phase velocities uses the Christof fel equation and has been described in detail by Crosson and Lin (1971) and Peselnick et al. (1974).
SINGLE CRYSTAL SHEAR WA VE ANISOTROPIES
B
b
C
This kind of calculation provides the opportu nity to understand the three steps of the calcula tion and hence the final results: (1) the seismic anisotropy of the single crystal; (2) the seismic properties of each minerai phase; (3) the influ ence of each mineral's bulk percentage on the polymineralic aggregate anisotropy. This allows us to obtain 3-D patterns of anisotropy in direct relationship to the rock structure (foliation and lineation).
3.1. Single crystals S-wave properties
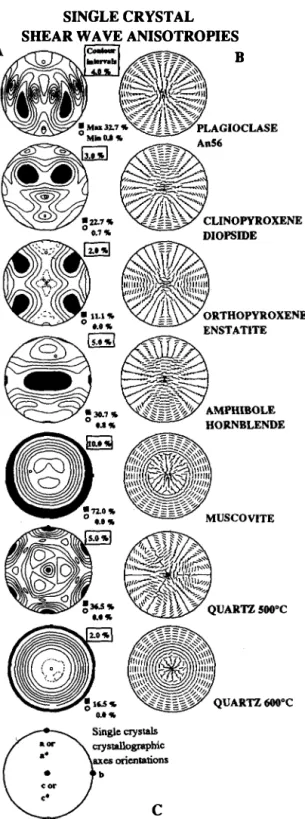
Figure 5 shows the 3-D single crystal S-wave anisotropies. The two shear-wave velocities (V.1
and
V.
2,V.
1 > V.2) and the orientations of their polarization planes are determined for each propagation direction. Contour diagrams of bire fringence anisotropy (Fig. 5(A)), and orientation of the fast shear-wave V.1 (Fig. 5(B)) are shown inequal area projection in the crystallographic ref erence frame (Fig. 5(C)). The single crystal bire fringence anisotropies are in the range from 10% (enstatite) up to 70% (muscovite). Orientation of maximum birefringence anisotropy value is shown by a black square, the minimum by a white circle. Note the contour intervals are not the same for every minerai.
The plagioclase crystal is triclinic but the stiff ness coefficients have been calculated using mon oclinic symmetry by Aleksandrov et al. (1974).
Fig. S. Single crystal shear-wave properties. The birefringence anisotropies (as defined in the text) (A), and the polarization plane orientations (B) are shown in equal area projection in the crystallographic reference frame. The maximum birefrin gence is marked by a filled square and the minimum by an open circle. Note that the contour intervals are not the same for every single crystal. For each propagation direction, the little arc segment represents the orientation of the polariza tion plane of the fast split shear-wave and is a part of a great circle. The
V.
2 polarization plane orientation is at evety point perpendicular to theV.
1 orientation. The equal area projec tion is done in a crystallographic reference frame (C). North represents the a crystallographic axis (or [ 100]) or a* for monoclinic and triclinic crystals (the normal to the (100) crystallographic plane). The east direction corresponds to the b (or [010]) crystallographic direction.LA TTICE PREFERRED ORIENT A TI ONS ' �
..•
' AMPHIBOLES """""""'" .��· '. . , 0 ' ' 1 1 Vs ANISOTROPY Vsl ORIENTATION 0 c ... , mta-,,all U1' Max.5.1 .. o Mi•t.11'il
e •• , •• , ftlcrYalf...
0 Mas ,.1 .. OMl.t.t 1' 0 ia&crv•il 5.11' Max 29.2"BIOTITE
m
MAXDISNSJTY HA•.. Coolou,
o Mint.,.,
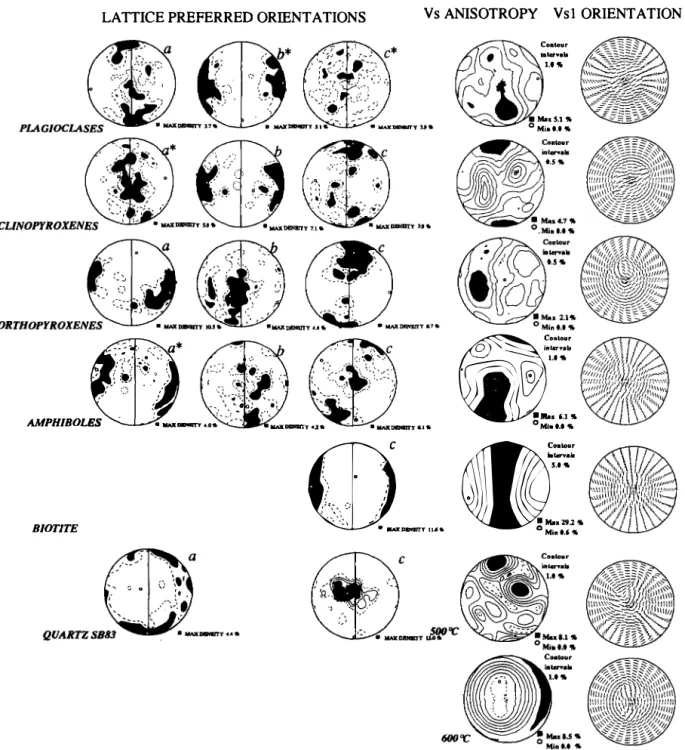
Fig. 6. Typical LPO of the main crystallographic axes of crustal minerai phases selected to mode! S-wave properties of synthetic crustal rocks. The projections are in the structural reference frame: foliation is north-south and lineation is north-south. Maximum density of crystallographic axes is marked by a filled square (left). The 3-D variations of the birefringence anisotropy of the ideal aggregate composed of 100% of the given minerai with the measured LPO and the fast split shear-wave polarization plane orientations are shown on the right. For more details see text.
This explains the only monoclinic symmetry of the diagrams. The anisotropy pattern shows nu merous maxima and minima, with complex angu lar relations with the crystallographic axes. Only the a* direction is close to the lowest anisotropy value.
Clinopyroxene ( Cpx) stiffness coefficients were determined by Aleksandrov and Ryzhova (1961) on diopside. The seismic properties clearly ex hibit the monoclinic symmetries. There is no di rect relation between the orientations of maxi mum anisotropies and the Cpx principal crystallo graphic axes.
The hornblende stiffness coefficients (Alek sandrov and Ryzhova, 1961) have been used to characterize amphibole seismic properties. The minimum birefringence orientation is close to the
a crystallographic axis but to the c-axis corre sponds the maximum value of S-wave anisotropy (30%). Furthermore, the plane containing the b and c crystallographic directions forms a girdle of high anisotropies ( > 20%). For these highly bire fringent directions, the fast shear-wave (V.1) is
systematically polarized parallel to the (100) crys tallographic plane.
Orthopyroxene (Opx) stiffness coefficients were measured on enstatite (Weidner et al., 1978). The seismic properties show the two-fold symme try axes parallel to the a-, b- and c-axes. The directions of maximum anisotropy do not corre spond to principal crystallographic axes. The plane containing the a- and c-axes forms a girdle of very small anisotropies (
<
2%). Opx is the least anisotropie of ail minerais considered here (maximum anisotropy 11 % ).For biotite we used constants measured by Vaughan and Guggenheim (1986) on muscovite which shows very close similarity with biotite crys tal structure and elastic properties. These data are indeed more recent and more reliable than those of Aleksandrov and Ryzhova (1961) for the biotite single crystal. Biotite, although mono clinic, can be considered as hexagonal to a good approximation for its elastic constants. Muscovite is strongly birefringent (anisotropy up to 70%) in directions normal to the c or [001] direction due to the phyllosilicate sheets, or (001) plane. On the other hand, directions of propagation close to the
c-axis are almost isotropie. For, S-waves propa gating at an angle of less than 45° to the cleavage
plane, the fast shear-waves (V.1) are always polar
ized parallel to the cleavage. Seismic waves have the highest velocities when their polarization and propagation directions are parallel to the cleav age, which corresponds to the plane of highest atomic packing. Note that biotite seismic proper ties can be completely described with only the c-axis orientation because of its transverse isotropy.
Elastic stiffness constants of a- and {3-quartz single crystal near the phase transition (510 and 600°C) were reported by Zubov and Firsova
(1962). Quartz S-wave properties in the a field (below 573°C at room pressure) reflect its trigonal
symmetry with highest anisotropies parallel to the a-axis and the c crystallographic direction corre sponding to a three-fold axis. In the {3-field, quartz is transversely isotropie, the c-axis is the symmetry axis and the minimum of anisotropy (Mainprice et al., 1990). The {3 quartz phase has considerably lower S-wave birefringence (16%) than a-quartz (36%).
3.2. S-wave properties of monocrystalline aggre gates
To derive realistic simple models of seismic properties of lower to middle crustal rocks, repre sentative LPOs and compositions of natural rocks have been selected. For LPO two main criteria have been used: (1) the general symmetry and the statistical orientation of crystallographic axes must be frequently reported in the literature; (2) the fabric intensity must be representative of corn mon rocks-very strong fabrics (e.g. mylonites) which are unlikely to be representative on the kilometre scale have been discarded.
Selected LPOs (Fig. 6) were mainly measured in Ivrea Zone (northern ltaly) samples (Barruol and Mainprice, 1993), except for quartz fabrics which have been measured in a gneiss sampled in the Saint Barthélémy Massif (northern Pyrénées, France) (Barruol et al., 1991). Lattice preferred orientations were measured using an optical mi croscope equipped with a universal stage, except for quartz for which a scanning electron
micro-1
scope (SEM) was used. Quartz is optically uniax ial, hence only the c-axis orientation can be ob tained using an optical microscope. This is not enough to calculate the seismic properties, which also depend on the a- and m-axes orientations, at least for the temperature range below the a-{3 quartz transition (about 573°C). The SEM was
used to investigate quartz crystallographic orien tation using the channelling method and indexing Selected Area Electron Channelling Patterns (SAECP) (Lloyd and Hall, 1981; Lloyd et al., 1987). This powerful method allows measure ments of the complete crystallographic orienta tion of individual grains. Crystallographic orienta tion determinations of monoclinic and triclinic minerais such as amphibole, pyroxene, plagio clase have been greatly simplified using micro computers programs (Benn and Mainprice, 1989).
From the preferred orientation of the three principal crystallographic axes for each minerai (Fig. 6, left) the birefringence anisotropies and the orientations of
V.
polarization planes of an ideal aggregate composed of 100% of a given minerai with the considered LPO was computed (Fig. 6, right).Plagioclase, orthopyroxene and clinopyroxene fabrics were measured in a gabbro sampled in the lowermost levels of the lvrea Zone, in the Val Sesia section (Barruol and Mainprice, 1993), a few hundreds of mhers east of the Balmuccia peridotites. This gabbro has been deformed un der granulite facies conditions and the minerai preferred orientations probably result from duc tile deformation.
Plagioclase exhibits a fabric typical of granulite facies metamorphic conditions (Ji et al., 1988; Siegesmund and Kruhl, 1991) that suggest activa tion of the (010)[100] sÙp system. Although pla gioclase fabric is relatively simple, the corre sponding S-wave anisotropy displays a complex pattern with numerous subsidiary maxima and minima, clearly due to the complexity of the single crystal properties. There is no clear rela tionship between the main structural axes and the maximum birefringence. The maximum birefrin gence anisotropy is also relatively low (5.1 %) compared with the single èrystal (32%) due to the diluting effect of the petrofabric. The
polariza-tion plane orientapolariza-tions (PPO) have a complex pattern.
Cpx (diopside/hedenbergite), seems to have been less ductile than plagioclase (some grains are fractured or kinked) but most grains are elongated and the crystallographic fabric shows a concentration of b-axes close to the foliation pole and c-axes close to the lineation. Such fabrics have been previously described in ultramafic rocks (Boudier, 1978; Mercier, 1985). The ideal Cpx aggregate has a relatively complex birefringence pattern, with low anisotropy values (maximum 4.7%). The maximum birefringence anisotropy is close to the X structural axis Oineation). The PPO are systematically normal to the foliation plane.
Opx (enstatite) exhibits a classic LPO with the a-axes close to the pole of the foliation and the c-axes forming a maximum close to the lineation (e.g. Mercier, 1985). An aggregate ideally com posed of 100% Opx with this fabric would display a low anisotropy (maximum birefringence anisotropy 2%). The minimum birefringence cor responds to the maximum c-axis concentration. The maximum is roughly between the b and a-axes. Furthermore, PPO for waves propagating in the principal structural directions (X, Y or Z) are always oblique to the main structural planes. Amphibole (hornblende) petrofabric bas been measured in a diorite, sampled in the upper part of a gabbro to diorite magmatic intrusion, at about 8 km east of the Balmuccia massif in the Val Mastallone. The rock is composed of plagio clase (65%), hornblende (10%), enstatite (7%), diopside (8%) and biotite (10%) and is totally free of plastic deformation microstructures. Pla gioclase grains show typical parallel-sided twins and elongated grains define a weak magmatic foliation. Hornblende a-axes are statistically ori ented close to the pole of the foliation whereas b and c-axes form a discontinuous girdle within the foliation plane (Fig. 6). Amphibole c-axes never theless show a maximum concentration close to the lineation. This kind of magmatic fabric is similar to those measured in metamorphic rocks (e.g. Siegesmund et al., 1989). The ideal aggre gate computed from this fabric has a relatively high anisotropy (maximum 6.1 %) despite the
complex fabrie with the numerous submaxima. High birefringence values define a girdle roughly parallel to the foliation plane with a maximum close to the lineation (due to the c-axes concen tration). Despite the complex fabric, the amphi bole aggregate polarization plane pattern is sim ple (Fig. 6). S-waves propagating parallel to the lineation are polarized parallel to the foliation and more generally, waves propagating parallel to the foliation plane generate a fast shear-wave polarized parallel to it. This aggregate shows clear relationships between the seismic velocities (and particularly the birefringence), the PPO and the structural fabric of the rock (particularly with the foliation).
Biotite LPO was measured in a kinzigite from the upper part of the Val Sesia section, about 10 km east from the Balmuccia Massif. This rock consists of feldspar (55%), quartz (20%), biotite (20%) and gamet (5%). The foliation is defined by the orientation of biotite crystals. Because the elastic constants of biotite have been calculated as pseudohexagonal, only the measurement of the c-axis orientation is required to calculate the elas tie constants of a polycrystalline aggregate. The c-axis has been determined as normal to the cleavage plane and the a and b-crystallographic orientations have been randomly generated in the plane normal to the c-axis. In this sample, c-axes are clearly grouped in a maximum normal to the foliation (Fig. 6). Biotite flakes are strongly aniso metric and develop strong preferred orientations with their cleavage planes parallel to the folia tion. An aggregate composed of 100% biotite with this fabrie exhibits a girdle of very high birefringence anisotropy (about 30%) within the foliation plane. The fast shear-wave PPO also displays a very simple pattern (Fig. 6); propaga tion directions contained within or close to the foliation are strongly birefringent and the fast shear-wave is polarized parallel to the foliation. Propagation directions at high angle to the folia tion plane (close to the Z-axis) are weakly anisotropie Oess than 5%). Biotite is clearly an important mineralogic phase for S-wave splitting studies in crustal rocks due to: (1) the strong intrinsic anisotropy of biotite single crystal (70% birefringence anisotropy); (2) the strong and
sim-pie preferred orientation; (3) the direct relation ship between structural reference frame, the ori entations of maximum birefringence and the ori entations of the polarization planes of the fast shear-wave (parallel to the phyllosilicate sheets, i.e. parallel to the foliation).
Quartz fabric was measured in a gneiss from the Saint Barthélémy Massif (Northem Pyrénées, France), deformed in the amphibolite facies. The tectonic context has been described by Saint Blanquat (1990) and the microstructure and com position of this rock have been already described by Barruol et al. (1992). The microstructure is typieal of rocks from the middle crust: ribbon quartz grains, feldspars with brittle features, some recrystallization and biotite with strong preferred orientation. The 6 measured quartz LPO is typi cal of the middle to lower crust (e.g. Bouchez, 1977; Schmid and Casey, 1986): the c-axes form a maximum close to the Y structural axis (normal to the lineation within the foliation plane), and the a-axes are concentrated near the lineation (Fig. 6). Despite this very simple LPO, an ideal aggregate of a-quartz exhibits a very complex birefringence pattern with two maxima with dif ferent orientations. A strong maximum of bire fringence anisotropy (8.1 %) occurs parallel to the lineation and a second at about 45° of the three
structural axes (Fig. 6). The distribution is also characterized by numerous orientations with low birefringence and by strong gradients between high and low birefringence values. The fast shear-wave PPO display strong spatial variations. The a-/3 phase transition completely changes the elastic properties of quartz from trigonal in the a field to transversely isotropie around the c-axis in the /3 field. This axis corresponds to the orientation of the minimum birefringence. Be cause c-axes are orientated parallel to the Y
structural direction, the quartz aggregate with this LPO shows a minimum anisotropy normal to the lineation within the foliation plane (i.e. close to the Y structural direction) and high birefrin gence values in the XZ plane. For S-waves prop agating in a direction close to the Z-axis, the anisotropy is strong (about 8%) and the fast shear-wave PPO is parallel to the lineation. Note that the maximum birefringence is greater in
/3-quartz aggregate (8.5%) than a-/3-quartz (8.1 %) due to the transversely isotropie seismic proper ties of /3-quartz compared with trigonal a-quartz.
3.3. Modelling 3-D birefringence of synthetic crustal rocks
Using typical LPO of the main crustal consti tutive mineralogic phases, described previously, we generate elastic properties of rocks with real istic modal compositions. By 'synthetic' we mean that the rock consists of minerais with LPO mea sured in different samples. The elastic properties of each rock result from the combination of the elastic stiffness matrix of each minerai phase, calculated from its LPO, in the modal propor tions of the rock and its density. Various kinds of
• Mu:2.4 'li, o MinO.O'll,
GABBRO
• 3.S 'li, 0 O.O'll, • 4.3 'li, 0 0.0 'li, BIREFRINGENCE VS1 ANISOTROPY ORIENTATIONlithologies representing large crustal volumes (at least 1 km3) have been modelled: a gabbro, an
anorthosite and an amphibolite representing mafic rocks and three kinds of gneiss and a schist to represent the felsic crust. in most cases the LPO has been used to compute the elastic prop erties of the component minerai. In a few cases the isotropie equivalents, using the Voigt average, have been used. For example, it was assumed that plagioclase and K-feldspars in the middle crust do not develop LPO as they do at deeper levels or higher metamorphic grades (e.g. Barruol et al., 1992); consequently, they have been considered as randomly oriented inducing isotropie elastic properties.
The shear-wave splitting properties have been computed for 10 synthetic rocks. The 3-D
varia-MODAL COMPOSITION O Pl.AGIO. OOPX SO'lli l,:l CPX DGARNET 0 Pl.AGIO. 0 OPX ·4o'lL OPLAGIO. EllAMPHIB.
A
B
C
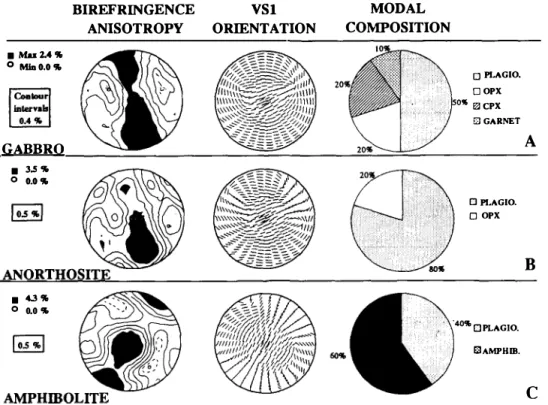
Fig. 7. Three-dimensional variations of the shear-wave properties of 10 synthetic aggregates. We have investigated various kinds of typical lithologies, from mafic (A), (B) and (C) to felsic compositions (D)-(J). For each synthetic crustal rock, the calculated birefringence anisotropies (left) and the orientations of the polarization planes of the fast split shear waves (middle) are shown in equal area projection, in the structural reference frame (foliation north-south and lineation north-south). The modal composition (on the right) is presented in a pie diagram. Mineralogic phases having the '.iso' name extension were considered as isotropie. Seismic properties of quartz-bearing rocks were determined above and below the a-/3 phase transition, at 600°C and 500°C,
BIREFRINGENCE ANISOTROPY VSl MODAL �Mu4.9'11, MinO.o-. � � 500°C 500°C �8.1% 0.3 % l1ui 600°C GNEISS! • 6.1% 0 0.0% 500°C 600°C GNEISS2 SCHIST
@
, , . . Fig. 7 (continued),tians of the birefringence anisotropy (Ieft), and the fast shear-wave polarization plane orienta tions (middle) are presented in Fig. 7, the corre sponding modal composition is shown on the
0 Pl.AGIO.
..
l!I QUARTZ•
BIOTITE E!I CPX • AMPHm. OIi ORTO.ISO. 0 PLAGIO, il QUARTZ • BIOTITE 1111 ORTO. ISO, D E F G 0 PLAGIO. ISO lâl QUARTZ • BIOTITE am ORTH. ISO, H I 0 PLAGIO. ISO 1,1 QUARTZ .ISO • BIOTITE am ORTH. ISO . Jright. For more details about this figure, see the figure caption. From these calculations we can discuss: (1) the influence of modal composition, (2) the influence of the LPO (which is responsible
for anisotropie properties) vs. the isotropie cases; (3) the effect of the temperature on the seismie properties of quartz-rieh rocks (a-(3) quartz tran sition).
Despite the fact that plagioclase represents a high volume fraction in the two mafic rocks (50% and 80% for the gabbro and the anorthosite, respectively), their maximum birefringence an isotropy is relatively low (2.4% and 3.5%) (see Fig. 7(A)). Plagioclase LPO alone does not gener ate strong shear-wave anisotropies (maximum 5.1 % ). The amphibolite is more birefringent (maximum anisotropy 4.3%).
Results from the gabbro illustrate the com bined effect of plagioclase and Cpx (Fig. 7(A)). The plagioclase fabrie generates a discontinuous zone of high birefringence values within the folia tion plane and Cpx LPO results in high values close to the lineation. The bulk 3-D birefringence pattern displays a continuous girdle of high val ues roughly parallel to the foliation. Opx does not generate a significant effect, because of its very low anisotropy. Fast shear-wave PPO for plagio clase and Cpx fabrics are very similar and the resulting PPO for the whole aggregate has the same trend as in both mineralogical components. For S-waves propagating parallel to the foliation plane (directions of high birefringence), the fast S-wave. splits with variable orientations. The ab sence of simple and homogeneous PPO trends enhances the difficulty in extracting structural information (i.e. orientation of the structure) us ing S-wave delay time and polarization orienta tions.
The anorthosite (Fig. 7(B)) birefringence pat tern is much more complex. The zones of high birefringence values are less continuous than for the gabbro and have no simple orientations rela tive to the structural reference frame, exactly like the plagioclase LPO which represents 80% of the rock. Highest birefringence is in the direction between X and Y in the foliation plane. The fast shear-waves' PPO are similar to those of the gabbro sample and the plagioclase single crystal. The birefringence pattern and the fast shear wave PPO of the amphibolite (Fig. 7(C)) are the most simple from the three mafic rocks. The relatively high birefringence anisotropy 4.3% and
the PPO are clearly controlled by the high amphi bole content (60% of the rock). Highly anisotropie directions correspond to the foliation plane. The slight obliquity to the foliation of this girdle of strong birefringence is related to the obliquity of the amphibole LPO. The directions of low bire fringence values are close to the pole of the foliation. The PPO of the fast S-waves propagat ing along directions of high birefringence (i.e. parallel to the foliation), are parallel to the folia tion.
The following rocks, referred to as Mean Crust, Gneissl, Gneiss2 and Schist, were computed to represent the felsic crust. Mean Crust has a min eralogical composition of the average crustal composition given by Anderson (1989). It is not a real rock but a hypothetical rock containing ail crustal components in realistic proportions. This kind of synthetic sample enables an evaluation of the effect of combining numerous fabrics to gether (five minerais with LPO and one isotropie phase). The Gneissl, Gneiss2 and Schist synthetic samples are combinations of four mineralogical phases (plagioclase, quartz, biotite and K-felds par), either with an LPO described in the previ ous section or as an isotropie equivalent. This allows a qualitative and quantitative evaluation of the effect of both composition and petrofabric. Furthermore, for rocks containing anisotropie quartz, the effect of the a-(3 quartz phase transi tion on seismic properties may be evaluated. From these four examples several conclusions may be drawn.
(1) Birefringence and the fast shear-wave PPO have very similar 3-D variations for the different synthetic samples even if the magnitude of anisotropy varies.
(2) Shear-wave splitting is systematieally maxi mum for waves propagating parallel or at a small angle to the foliation Oess than 30°). S-waves
propagating in these high birefringence directions split strongly and the fast shear-wave is systemati cally polarized parallel to the foliation plane. On the contrary, birefringence is extremely low (ani sotropy < 1 %) for shear-waves propagating in a direction normal to the foliation plane.
(3) lt seems, at least with the selected LPO, that the main crustal tectonic structure that can
be deduced from S-wave splitting measurements is the foliation plane. Lineation seems to be a second-order phenomenon.
(4) The spatial variations of the seismic prop erties are axially symmetric around the Z struc tural axis. This feature is Iess pronounced when numerous LPO are taken into account. For in stance, Mean crust (Fig. 7(0)) has no symmetry
(five LPO), whereas Schist (Fig. 7(J)) in which only the biotite LPO has been used is almost perfectly symmetric. For quartz-bearing rocks, the axial symmetry is also more visible in the f3 field due to the simple birefringence pattern of the quartz LPO above the a-{3 transition.
(5) Biotite is clearly the controlling factor for S-wave splitting. The rock Schist, in which only
the biotite LPO has been taken into account shows ail the features mentioned above and a quasi-transverse isotropie symmetry. On the other band, numerous LPO have been used for the Mean Crust and its transversely isotropie feature generated by biotite is greatly affected by the other minerais.
(6) The a-{3 quartz phase transition does not change the magnitude of shear-wave splitting of quartz-bearing rocks significantly. For a given hy pothetical rock, the maximum birefringence anisotropy is Iowered by only 0.5%. Furthermore, this phase transition has little influence on the polarization plane orientations. The only de tectable effect is that birefringence has a smoother pattern in the {3-quartz field (here at 600°C), than
0.25 0.20_
"'
Cl)E
••
>,. 0.10 ..2i!
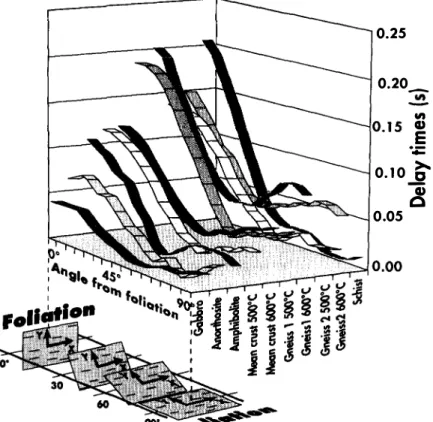
0.05Fig. 8. Influence of the structure orientation on the delay time. These diagrams show the variations of the delay time between the two split shear-waves propagating vertically and crossing a 10 km thick layer composed of each of the 10 synthetic samples for various incidence angles between the seismic wave and the structural directions. (A) Variations between the Y and Z structural directions (angles are 0° and 90°, respectively). Maximum splitting systematically occurs for S-waves propagating parallel to the Y-axis and there is almost no splitting for S-waves propagating normal to the foliation. (B) Variations between the Y and X structural directions (angle are 0° and 90°, respectively). For more explanation see the text.
Fig. 8 (continued).
in the a-quartz field. The transversely isotropie symmetry is higher in the /3-quartz field.
(7) These calculations are in complete agree ment with the birefringence obtained on similar rocks by direct laboratory velocity measurements: strong birefringence values are found for waves propagating parallel to the foliation and the fast shear wave are polarized parallel to the foliation. On the other hand, directions near the pole to the foliation are isotropie.
3.4. Influence of the structure on SWS in crustal rocks
From calculated crustal birefringences, the de Jay time between the two perpendicularly polar ized waves was calculated considering an S-wave propagating vertically toward the Earth's surface and crossing a 10 km thick anisotropie layer with the compositions of the 10 synthetic samples
cal-0.25 0.20 0.15
:3
E ·.;:: 0.10 � ai 0 0.05 0.00culated in the previous section. The variations of delay time for each layer composition as a func tion of the internai structure orientation (angle from the foliation or from the lineation) are pre sented in Fig. 8. For both diagrams, the vertical axis represents the delay time (in seconds) and each curve corresponds to a lithology. The hori zontal axis corresponds to the angle between a main structural axis and the vertical.
In Fig. 8(A), we consider the 10 km thick layer with a horizontal lineation and a foliation rotat ing around it. For an incidence of 0° the wave
propagates vertically, parallel to the foliation plane, along the Y structural direction. At an angle of 90°, the wave always propagates verti
cally but the foliation is horizontal. In this case, the wave path is parallel to the Z structural axis. Large variations of delay times have been calcu lated, with a similar trend for the different rock types; splitting is always high (in the range of
0.1-0.2 s) for waves propagating parallel to the foliation (i.e. when the foliation is vertical), whereas the delay time is very low (i.e.
<
0.05 s) for waves crossing the foliated structure at a high angle.Figure 8(B) shows delay time variations for the layers with the various synthetic rocks' composi tions, for waves with incidence between the Y
structural axis (angle of 0°) and the X-axis (angle
of 90°). The wave propagates vertically and al
ways parallel to the foliation but the orientation of the Iineation varies from the horizontal (0°) to
the vertical direction (90°). In this diagram, the
delay time is Jess affected by the structure orien tation than in Fig. 8(A) (i.e. the Iineation orienta tion has Jess influence on the splitting than the foliation orientation).
Both diagrams show that the main structure controlling the splitting is the foliation. One can expect strong splitting for every propagation di rection contained within the foliation plane and almost no splitting for S-waves propagating in directions normal to it. In other words, one can expect a significant crustal contribution to the shear-wave splitting of teleseismic S-waves above strongly dipping structures, especially above verti cal structures composed of felsic rocks such as Gneissl or Gneiss2.
4. Natural cases where crustal contribution to SWS may be signiticant
This section focuses on specific geological structures that may induce a crustal contribution to the splitting of vertically propagating S-waves. The most obvious example is Iithospheric strike slip fault rooting in the upper mande, along which vertical foliations are expected across most of the crustal thickness. A good example chosen is the San Andreas fault. The second tectonic process able to generate dipping structures on the whole crustal thickness could be the accretion. The se Iected example is Alaska.
4.1. The San Andreas fault
The San Andreas fault certainly extends down into the subcrustal Iithosphere. The uppermost part of this structure (15 km) is seismogenic and clearly has a brittle behaviour (Dewey et al., 1989). Further down, broader zones of deforma tion in a more ductile regime may be expected. Under middle to Iower crustal PT conditions and in a strike-slip regime, new minerai phases such as phyllosilicates may lcrystallize parallel to the vertical foliation. The depth at which petrofabrics will play an important raie for splitting is in fact
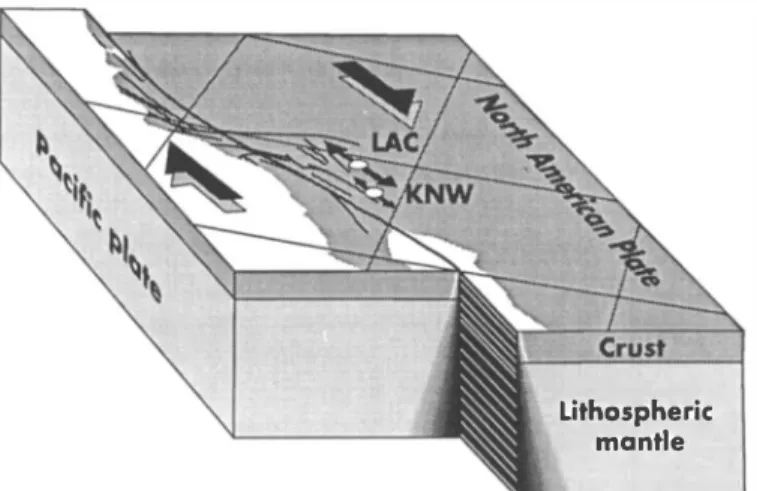
Lithospheric mantle
Fig. 9. Schematic block diagram of the San Andreas fault area showing the close relationship between the fault and the anisotropy orientation at the LAC and KNW seismic stations.
controlled by the temperature. The lowest tem perature for phyllosilicates to form occur at about 300°C. Within a strike-slip fault, they will grow
vertically and develop a foliation. For a normal geotherm, 300°C corresponds to about 10 km but
in active areas where the geotherm is higher, 300°C may be reached at shallower depths.
Several splitting measurements have been per formed on this strike-slip fault. Savage et al. (1990) measured a strong delay time (1.2 s) at the LAC station (see location on Fig. 9) using split ting of SKS-waves. The fast shear-wave was mea sured parallel to the strike of the fault (Fig. 9). Savage et al. relate this parallelism to the simple shear strain between the Pacifie and the North American plates. For this station LAC, the re sults cannot invalidate the hypothesis of a crustal contribution to the splitting.
Peacock et al. (1988) and Crampin et al. (1990) analysed shear-wave splitting from local events in the Anza seismic gap. Earthquakes take place in the crust at depths down to 17 km. Most of the stations clearly show fast shear-waves oriented north-south which are interpreted as resulting from microcracks parallel to the major in situ
horizontal stress (Zoback and Zoback, 1989). For one station (KNW), the fast shear wave was clearly oblique to the maximum horizontal stress (see Fig. 9) and had the same trend as the fault (N140°). This station is located on the Hot Spring
Fault where heat flow is particularly high. An alternative interpretation is to explain such observations in terms of structures. If heat flow is high enough, as for instance in the Hot Spring area, foliation within the fault may have devel oped in the uppermost crustal levels and LPO may have played a dominant role in S-wave split ting. For station KNW, the results may be inter preted in terms of a major LPO contribution to the delay time measured.
lt seems reasonable to assume that we can find rocks such as Mean Crust or Gneiss2 with gneis sic structure on the whole crustal scale along such strike-slip faults, except for the uppermost levels where the temperature is not high enough to allow the development of the foliation. Assuming that the crust is composed of such rocks and that the foliation is vertical on 20-30 km thickness, an S-wave crossing this structure will split. The delay time between the two perpendicularly polarized
shear waves could be in the range of 0.3-0.5 s. Such significant values represent about the third to the fifth of measured SKS-wave splitting.
4.2. The Alaskan accretion
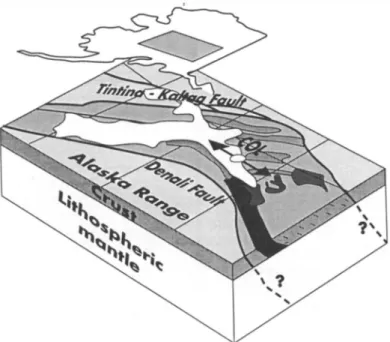
Alaska represents an active convergent plate boundary along which numerous terrains have been accreted (e.g. Coney and Jones, 1985). Two different modes of deformation have probably occurred. First, a simple orthogonal convergence: a block is dragged toward the continent by the subducting plate. Subsequently, when the system locks up the convergence is accommodated by Iateral movement along the block boundaries. Both kinds of mechanisms may generate dipping structures. In each block, the foliation is often steeply dipping (e.g. Page et al., 1986; Goodwin et al., 1989) and rocks have metasedimentary compositions with a high phyllosilicate content. Strike-slip faults separating blocks may also be expected to have at least a crustal extent and therefore vertical structures.
Splitting measurements of SKS-waves at COL station (Silver and Chan, 1991) are characterized by a strong delay time (1.55 s) and the fast shear-wave is orientated N098°. This station is
close to the Denalli strike-slip fault and the Alaska Range is to the south and the Tintina Kaltag strike-slip fault to the north (Fig. 10). The fast shear-wave is clearly orientated parallel to the strike of the faults. Silver and Chan inter preted this orientation as due to a subcontinental mantle deformation similar to the deformation of the crust. This is a typical case where mantle and crustal coupling may generate mantle and crustal structures having the same effect on S-wave split ting.
If we assume a crust 20-30 km thick composed by Gneissl, Gneiss2 or Schist rock types with a dipping foliation in the range 60-90°, the crustal
contribution at the COL station may be about 0.3-0.5 s, which represents a significant fraction of the total measured delay time (the fifth to the third of the total splitting).
In other places the fast shear-wave bas been measured parallel to the strike of the structure that crops out. For example, the station RSON
on the Canadian Shield (Silver and Chan, 1991) exhibits a very high delay time between the two shear-waves (1.7 s) and the fast shear-wave is orientated parallel to the regional foliation that crops out. lt could indicate a strong coupling between mantle and crust and a significant crustal contribution. In Shikoku Island (Japan) a high delay time bas also been observed (Kaneshima and Ando, 1989) with a fast wave orientated parallel to the strike of the Sanbagawa metamor phic zone (about N070°), which is composed of
strongly anisotropie schists. Because maximum horizontal compressive stress bas a more east west strike, it is suggested that minerai preferred orientations make a stronger contribution to the total splitting than microcracks. These are not exhaustive examples and one needs more detailed studies to better quantify the real crustal contri bution to the shear-wave splitting.
5. Conclusions
In this paper the shear-wave properties of 10 typical crustal rocks have been modelled. We have determined delay times between the two split shear-waves crossing a layer with the 10 different lithologies. We have shown that the crust may have a significant contribution to the total splitting of teleseismic S-waves in some cases, particularly where the foliation is expected to be steeply dipping.
Mafic rocks such as pyroxene-bearing gabbros or anorthosites are moderately anisotropie. They are not good candidates for generating strong delay times. Furthermore, both birefringence and fast shear-wave PPO have no clear and systematic relationships with the fabric and hence with the structure, consequently they can not be good tectonic indicators. However, amphibolites have higher anisotropies and the fast shear-wave dis plays a simple pattern easier to interpret in terms of structure.
Felsic rocks such as quartz and phyllosilicate bearing gneisses or schists are good structural indicators. They are highly anisotropie and ex hibit consistent relationships between structure and splitting. Time delay between the two split
shear-waves is very high in a direction parallel to the foliation plane whereas it is very low in direc tions normal to it. This is in complete agreement with the measurements of shear-wave birefrin gence performed in the laboratory on real sam ples.
Fast shear-wave polarization plane orientation is controlled by the orientation of the foliation plane; the fast shear-wave travels mainly parallel to it. This is also in complete agreement with the direct laboratory measurements. Lineation is more difficult to relate to shear-wave splitting measurements. lt is clearly a second-order fea ture compared with the foliation.
The time delay between the two split shear waves propagating in a given direction is mainly controlled by two factors: the biotite content in the rock which controls the intrinsic maximum anisotropy and the orientation of the foliation relative to the incident wave.
The number of mineralogical phases does not greatly influence the shape of the birefringence pattern but does influence the magnitude of anisotropy.
Birefringence depends strongly on phyllosili cate content. At high phyllosilicate content, the S-wave anisotropies exhibit strong transverse isotropie patterns around the Z structural axis (pole of the foliation).
In shear-wave splitting measurements above a horizontally foliated crust, a very small crustal contribution is expected, whereas above a zone of dipping foliation, the crustal contribution may reach 0.5 s assuming a steeply dipping foliation of felsic rocks through the entire thickness of the crust.
Acknowledgements
This study bas been supported by the Accom pagnement ECORS 90/91 programme and by the DBT programme Thème Géodynamique. Thanks to G. Lloyd for bis useful help and advice for the channelling measurements with the SEM undertaken at Leeds University (UK). Thanks to V. Babuska, D. Fountain, P. Silver and A Vauchez for their contructive comments.
References
Aleksandrov, K.S. and Ryzhova, T.V., 1961. The elastic prop erties of rock forming minerais II: Layered silicates. Izv. Acad. Sei. USSR, Geophys. Phys. Solid Earth, 1165-1168. Aleksandrov, K.S., Alchikov, U.V., Belikov, B.P., Zaslavskii, B.I. and Krupnyi, AI., 1974. Velocities of elastic waves in minerais at atmospheric pressure and increasing precision of elastic constants by means of EVM (in Russian). lzv. Acad. Sei. USSR, Geol. Ser., 10: 15-24.
Anderson, D.L., 1989. Theory of the Earth. Blackwell Scien· tific, Oxford, 366 pp.
Barruol, G. and Kern, H., 1993. P and S-waves velocities and shear-wave splitting in the lower crustaljupper mantle transition (Ivrea Zone). Experimental and calculated data. Geophys. J. Int., submitted:
Barruol, G. and Mainprice, D., 1993. 30 seismic velocities calculated from LPOs and reflectivity of a lower crustal section-Example of the Val Sesia Ovrea Zone, Northern Italy). Geophys. J. Int., in press.
Barruol, G., Mainprice, D. and Kern, H., 1991. Quantification of 30 seismic properties of amphibolitic facies lower crustal section transected by a ductile shear zone. The Saint Barthélémy massif (Northern Pyrénées, France). E.U.G VI, Strasbourg.
Barruol, G., Mainprice, D., Kern, H., Saint Blanquat, M. and Compte, P., 1992. 30 seismic study of a ductile shear zone from laboratory and petrofabric data (Saint Barthélémy Massif, Northern Pyrénées, France). Terra Nova, 4: 63-76. Benn, K. and Mainprice, D., 1989. An interactive program for determination of plagioclase crystal axes orientations from U-stage measurements: an aid for petrofabric study. Com put. Geosci., 15: 1127-1142.
Bouchez, J.L., 1977. Plastic deformation of quartzites at low temperatures in an area of natural strain gradient. Tectonophysics, 39: 25-50.
Boudier, F., 1978. Structure and petrology of the Lanzo massif (Piedmont Alps). Geol. Soc. Am. Bull., 89: 1574-1591.
Christensen, N.I., 1966. Shear wave velocities in metamorphic rocks at pressures to 10 Kilobars. J. Geophys. Res., 71: 3549-3556.
Coney, P.J. and Jones, D.L., 1985. Accretion tectonics and crustal structure in Alaska. Tectonophysics, 119: 265-283. Crampin, S., 1985. Evaluation of anisotropy by shear-wave
splitting. Geophysics, 50: 142-152.
Crampin, S., Booth, D.C., Evans, R., Peacock, S. and Fletcher, J.B., 1990. Changes in shear-wave splitting at Anza near the time of the North Palm Springs earthquake. J. Geo phys. Res., 95: 11 197-11 212.
Crosson, R.S. and Lin, J.W., 1971. Voigt and Reuss prediction of anisotropie elasticity of dunite. J. Geophys. Res., 76: 570-578.
Dewey, J.W., Hill, D.P., Ellsworth, W.L. and Engdahl, E.R., 1989. Earthquakes, faults, and the seismotectonic frame work of the contiguous United States. In: L. Pakister and W. Mooney (Editors), Geophysical Framework of the