HAL Id: hal-02637005
https://hal.inrae.fr/hal-02637005
Submitted on 27 May 2020
HAL is a multi-disciplinary open access
archive for the deposit and dissemination of sci-entific research documents, whether they are pub-lished or not. The documents may come from teaching and research institutions in France or abroad, or from public or private research centers.
L’archive ouverte pluridisciplinaire HAL, est destinée au dépôt et à la diffusion de documents scientifiques de niveau recherche, publiés ou non, émanant des établissements d’enseignement et de recherche français ou étrangers, des laboratoires publics ou privés.
Milk yield and modeling of lactation curves of Tunisian
she-camel
Borni Jemmali, Mohamed Amine Ferchichi, Bernard Faye, Mounir Kamoun
To cite this version:
Borni Jemmali, Mohamed Amine Ferchichi, Bernard Faye, Mounir Kamoun. Milk yield and modeling of lactation curves of Tunisian she-camel. Emirates Journal of Food and Agriculture, 2016, 28 (3), pp.208-211. �10.9755/ejfa.2015-07-505�. �hal-02637005�
Milk yield and modeling of lactation curves of Tunisian
she-camel
Borni Jemmali*1, Mohamed Amine Ferchichi1, Bernard Faye2, Mounir Kamoun1
1Laboratory of Improvement and Integrated Development of Animal Productivity and Food Resources, Higher School of Agriculture of Mateur,
University of Carthage, Tunisia; 2UMR SELMET, CIRAD-ES, Campus International de Baillarguet, TA-C/112A, 34398 Montpellier, France
INTRODUCTION
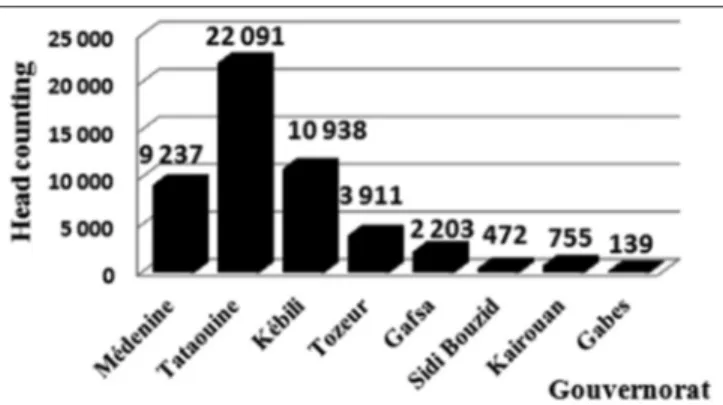
Camels continue to be the preferred livestock species for utilizing extreme dry land areas. Pastoralists are seeking new systems of using their animals by increasing sales of surplus rather than keeping them to accumulate wealth. African populations represent 80 % of world camels (Faye and Bonnet, 2012). The estimated number of camels in Tunisia (100,000 heads) was distributed especially in southern and center of Tunisia (Fig. 1). Despite this important number, there is a little information on genetic diversity of this population, but a recent classification was done (Chniter et al., 2013).
In previous studies achieved by Kamoun (1995 and 1998a) in Tunisia it has been demonstrated that the estimate milk potential of the Maghrebi Negga (Camelus dromedarius) depend
on many factors that can influence quantity and quality of
produced milk as the feed composition, the milking practices, the physiological and health status of the dairy animals. Increased milk production is possible and intensification can be a way to improve milk yield for Maghrebi Negga
(Kamoun 1998b). This breed has relatively high potential milk. To improve milk quantity and quality, Dag et al. (2005) reported that appropriate models for describing lactation curves provide useful information for breeding programs and management practices, especially for culling and in assessing the nutritional and health status of animals. In order to assess plausible forms of lactation curves, milk yield records collected throughout the whole lactation are required. The objective of our study was to investigate, for the first time, the use of four different mathematical models (Wood, Cobby and Le Du,Cappio-Borlinoand and Dhanoa) to describe camel milk lactation curves, to estimate the potential of dairy she-camels and to identify different
http://www.ejfa.me/
Modeling the lactation curve is an important step for assessing the true milk potential of dairy animals. The present study aims to investigate the use of four different mathematical models (Wood, Cobby and Le Du,Cappio-Borlinoand and Dhanoa) to describe camel milk lactation curves, to estimate the potential of dairy she-camels and to identify different factors that could influence produced milk quantity and quality of Maghrebi she-camel. A total of 813 records from one experimental farm were used. Data collections were daily made with three milking per day. The complete milking was performed on two quarters (one posterior and one anterior). The other two were reserved for the calf and the volume collected was doubled. Among the four used mathematical models, the Wood model appeared the most appropriate according to mean square prediction error (MSPE), coefficient of determination (R2= 83.56). The differences in estimated total milk yields between the models were not statistically significant. All models were adequate in describing total milk yield, although total milk yield estimated using the Wood model was very close to total milk yield. The quantities of daily produced milk differed among individuals. Milk production peaked approximately at 3rd months postpartum and then decreased. Daily production was 6.72 ± 2.46 L. Milk yield decreased with lactation. Daily milking order as well as stage of lactation affects milk yield and its composition. These constituents became concentrated as lactation proceeded, and protein was substituted by fat. Calving date had a similar concentrating effect on fat whereas it decreased protein. This study showed that among the population of camels in Tunisia, improving environment and management of camel can be a way to improve milk production.
Keywords: Camels; Lactation curves; Milk production and composition
A B S T R A C T
R E G U L A R A R T I C L E
*Corresponding author:
Borni Jemmali, Laboratory of Improvement and Integrated Development of Animal Productivity and Food Resources, Higher School of Agriculture of Mateur, University of Carthage, Tunisia. E-mail: bornijemali@yahoo.fr
Jemmali, et al.: Modelling camel lactation curve
factors that could influence produced milk quantity and quality of Maghrebi she-camel.
MATERIAL AND METHODS
Animal and locationThe study was conducted in the experimental Farm of Higher Education in Agriculture School (Mateur, Tunisia). Mating dates, calving and drying are recorded. Eight camels and 26 lactations were sampled during 5 years every ten days at the same time. Sampled she-camel had an average age of 9±3 years.
She Camels (Neggas) spend the night and part of the day
(12:00 to 14:00 h) in the stable where they have freely water and wheat straw and 4 kg of wheat bran per head per day. For the rest of the day the whole goes to pasture at 7:30 am just after the morning milking and at 14:00 pm after milking and returned in the evening, just before the evening milking, which occurs between 17:30 h and 18:30 h. A total of 813 records were used in the present analysis. Data collection was made daily during the milking which were achieved three times a day. The complete milking was performed on two quarters (one posterior and one anterior). The other two were reserved for the calf and the volume collected was doubled.
Milk sampling and analyses
Milk samples were collected aseptically during the routine milking in sterilized recipients and transported immediately to the laboratory for analysis. Milk samples were stored in sterile plastic container at 4°C.
Milk samples were analyzed to determine chemical composition and physical criteria (acidity, pH, density, dry matter, fat, protein, casein, lactose and ash) for each sampling day and each sampling time. Analyses were performed according to the official Tunisian methods resulting from those described by the International Dairy
Federation (IDF). The total nitrogen (TN), the non-casein nitrogen (NCN) and non-protein nitrogen (NPN) are determined by the Kjeldahl method, the TN was determined in milk without preparation, the NPN and NCN were determined in the soluble fraction after protein precipitation with TCA 12 % for the first and after selective precipitation of casein (pH = 4.6) with acetic acid and sodium acetate for the second. Nitrogen of whey proteins was calculated by difference: NCN minus NPN.
Models tested
The Gauss-Newton algorithm was used to fit lactation curve (SAS, 2009). Observed daily milk was presented as: Yt= a tb e-ct
Where:
Yt: is the observed milk yield at day t
a: is linked to milk yield at the beginning of lactation b: to the ascending phase before peak yield
c: to the decreasing phase after peak yield
Persistency, peak yield, and day in milk at peak yield, were calculated as: (b+1) Ln (c), a(b/c)b e-b, and (b/c), respectively.
RESULTS AND DISCUSSION
Milking practice could affect the amount of milk. Generally, in extensive systems the calf is allowed to suckle for a few minutes before hand milking. Milking must be done by a person who is well known to the camel. In the present study when the usual milker changed, significant milk retention was often observed. It also appears that milking frequency influences daily milk yield. In presence of his calf, milking duration can be more than 3 min.
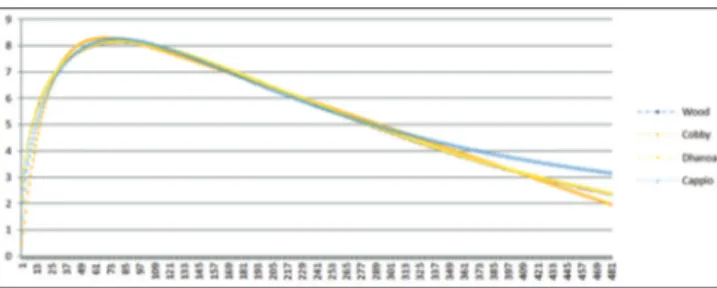
Quantities of produced milk increase with milking rank and changing with lactation number. Quality of produced milk was varied according to the milking order in the day and the lactation stage (P = 0.01). The quantities of daily produced milk differed among individuals. Average daily production was about 6.72 ± 2.46 L. The total milk production was on average 2642 ± 523 L for 390 days of lactation with a range between 972 and 3538 L. This result was similar to these recorded by Musaad et al. (2013a) and Gaili et al. (2000) on camel population in Saudi Arabia. Observed milk yield appeared lower than the values recorded by Aslam et al. (2002) and Ibnoaf (1987) in Kuwait. These differences could be partly attributed to the genetic performances. The Wood model is the more appropriate for describing milk production curves for she-camel in Tunisia (Fig. 2). Milk yield will rise during the first two to three months after calving, followed by a long period of continuous decline.
Fig 1. Number and location of camel population in Tunisia (Kamoun and Jemmali, 2014).
Peak milk yield is the point where the female reaches the highest production level. This result was similar to this founded by Kamoun (1998b). In our study, the peak occurred at the 3-4th month post-partum as reported by Kamoun (1995). Peak production in camel is less marked than in cow (Musaad et al., 2013a). In this former study, the peakin camel was reached in the 28th week of lactation. In Ethiopia, the peak was observed earlier, between 9 and 19 weeks (Bekele et al., 2002). In Pakistan, the peak was reached during the second and third months of lactation (Khan and Iqbal, 2001). In Ethiopian camels, no significant reduction in milk production was reported until the ninth month of lactation (Zeleke, 2007) due to the high persistency observed in camel. The average initial milk yield in our camels estimated by Wood, Cobby and Le Du, Dhanoa and Cappio models respectively was 2.19, 9.71, 2.19 and 1.5 L. Lactation curve parameter of ascending slope up to peak yield varied according used mathematical models. The descending slope parameter for different observed milk curves were 0.003, 0.005, 0.005 and 0.05 respectively for Cappio, Wood, Dhanoa and Cobby models (Table 1).
Estimation milk yield, for studied females, were determined by different mathematical models. Milk production peak was reached at the 80th, 79th, 81th and 68th test day respectively for Wood, Cobby and Le Du, Dhanoa and Cappio used models. Estimated milk yield was varied according mathematical used models (Table 2).
The persistency of lactation varied between 94% for Cappio and Cobby and 96% for Wood and Dhanoa model. The average persistency of milk production from thepeak to 390 days of lactation was 94.7% in the study of Musaad et al. (2013a) which was higher than the 87.3 % reported by Al-Mutairi et al. (2010) but a little lower than 97.1 % between 100 and200 days of lactation reported by Richard (Richard and Gérard 1989) in Danakil camels in Ethiopia. Among the four used mathematical models, the Wood model appeared the most appropriate according to mean square prediction error (MSPE) and the coefficient of determination (R2= 83.56%). The differences in estimated total milk yields between the models were not statistically significant (P > 0.05).
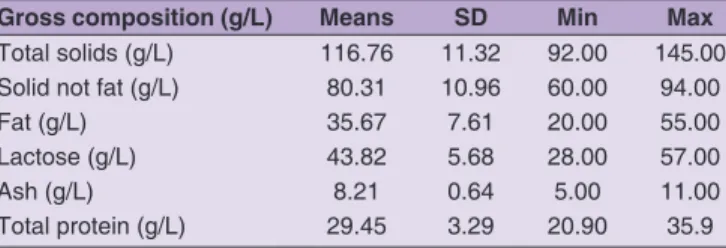
For fresh camel milk, pH was ranging from 6.17 to 6.95 with a mean value of 6.32 ± 0.20, titratable acidity was ranged from 13 to 18 °D with a mean value of 16.95±1.52 and density going from 1019 to 1032 with an average of 1025 ± 3. These values are lower than those of cow’s milk. The differences among the values in gross composition undoubtedly reflect differences in breed and stage of lactation of our Maghrabi
Negga sampled. But in all cases, we found that the milk is low
in cheesy components such as casein and fat (Table 3 and 4). In all cases daily milking orders affect milk yield and its composition (P<0.05). Stage of lactation affected fat (P<0.001), protein (P=0.002), and protein/fat (P<0.001). These constituents became concentrated as lactation proceeded, and protein was substituted by fat. Calving date had a similar concentrating effect on fat (P < 0.001) whereas it decreased protein (P = 0.002). These results were similar to these founded by Konuspayeva and Faye (2005) andAbdurahman (2006) and Musaad et al., (2013b). Konuspayeva et al. (2009) reported that the gross composition varied according to geographical location, and to year. Camel milk composition showed a wide variability in its constituents depending on the physiological, genetic and environmental factors (Abdelgadir et al., 2013). These authors reported that no significant effect of parity, gestation length, calf body weight at birth or adult weight in milk contents. Little correlation was observed between milk quantity and lactation stage. An important lactation-gestation recovery period was observed (283 +/- 93 day) which can have an effect on the lactation length as described recently by Nagy et al. (2014). Correlation coefficient between persistency indices and total day milk yield was indicated a good persistency value calculated for this breed. The high disparity between these various sets of data can probably be explained by differences in
Table 1: Lactation curve parameter of ascending slope up to peak yield according different mathematical models and mean square prediction error (MSPE)
Models a b c MSPE
(%) Means SD Means SD Means SD
Wood 2,19 0,15 0,4 0,15 0,005 0,003 61,71 Cappio 1,5 0,08 0,5 0,23 0,003 0,003 60 Cobby and Le Du 9,7 1,15 0,01 0,05 0,05 0,03 83,56 Dhanoa 2,2 0,2 80,6 12,23 0,005 0,004 61,71
a: is linked to milk yield at the beginning of lactation; b: is linked to the ascending phase before peak yield; c: is linked to the decreasing phase after peak yield; SD: Standard deviation; MSPE: Meansquare prediction error
Table 2: Estimated milk yield according mathematical used models
Models Total Means SD Min Max
Dhanoa 2778,54 5,52 1,75 1,50 8,27 Wood 2644,03 5,47 1,90 2,18 8,15 Cobby 2641,08 5,49 1,90 2,18 8,15 Cappio 2636,33 5,35 2,03 0,46 8,29
Fig 2. Lactation curve estimated for Magrebi she-camel milk yield (L/ day) estimated by Wood, Cobby and Le Du, Cappio-Borlinoand and Dhanoa models.
Jemmali, et al.: Modelling camel lactation curve
genetic potential, climate, feeding conditions and sampling techniques. Our result suggests that intensification can be a way to improve camel milk production.
CONCLUSION
Tunisian Maghrebi Negga had good potential for milk
production. The Wood model appearing the most appropriate among the four tested models, it could be used for estimating the dairy potential of camels.
The improvement of environment and management of camel signaling pathway illustrate the way in which discover can contribute to productive process, as well as providing benefits to agriculture. Genetic selection can be used to identify animal with a high genetic potential.
Author contributions
B.J. has achieved the analyses and wrote the paper; M.A.F. has collected the data; B.F. has participated to the writing and K.M. was the supervisor of the work.
REFERENCES
Abdurahman, O. A. S. 2006. Udder health and milk quality among camels in the Errer valley of eastern Ethiopia. Livest. Res. Rural Dev. 18: 8. Al-Mutairi, S. E., I. Boujenane, A. M. Musaad, and F. A. Acharari.
2010. Genetic and non genetic effects for milk yield and growth traits in Saudi camels. Trop. Anim. Health Prod. 42: 1845-1853. Aslam, M., M. Nawaz, M. Ali and M. A. Ziaur Rahman. 2002.
Determination of productive and reproductive traits in mountain camel. Appl. Livest. Prod. 30: 549-552.
Bekele, T., M. Zeleke and Baars, R. M. T. 2002. Milk production of the one humped camel under pastoral management in Semi-Arid Eastern Ethiopia. Livest. Prod. Sci. 76: 37-44.
Chniter, M., M. Hammadi, T. Khorchani, R. Krit, A. Benwahada. and M. Ben Hamouda. 2013. Classification of Maghrebi camels (Camelus dromedarius) according to their tribal affiliation and body traits in southern Tunisia. Emirates J. Food Agric. 25(8): 625-634. Dag, B., I. Keskin and F. Milkailsoy. 2005. Application of different
models to the lactation curves of unimproved Awassi ewes in Turkey. South Afr. J. Anim. Sci. 35: 238-243.
Faye, B. and P. Bonnet. 2012.Camel sciences and economy in the world: Current situation and perspectives. Proceeding 3rd ISOCARD Conference. Keynote Presentations. 29th January -1st February, 2012, Mascate (Sultanate of Oman), Pp. 2-15. Gaili, E. S. E., M. Al-Eknah and M. H. Sadek. 2000. Comparative
milking performance of three types of Saudi camels (Camelus
dromedarius). J. Camel Pract. Res. 7(1): 73-76.
Ibnoaf, M. 1987. Towards a Better Understanding of Our Domestic Livestock: Camels of Kuwait. Technical Report, Kuwait Institute for scientific Research, Safat, Kuwait.
Iqbal, A., M. Younas and B. B. Khan. 2009. Milk production potential of Pakistan camel under the dry condition of the Punjab. In: Khorchani, T., (Ed.), Proceedings of the 2nd ISOCARD Conference, Djerba, 2009, (Institut des Régions Arides Publication. Medenine, Tunisia), p. 4.
Kamoun, M. and B. Jemmali. 2014. Serum progesterone level of camel (Camelus dromedarius) according to the physiological status. J. New Sci. 3(2). Published March, 01, 2014.
Kamoun, M. 1995. Le lait de dromadaire: Production, aspects qualitatifs et aptitude à la transformation. Options Méditerranéennes. Séries Sémin. 13: 81-103.
Kamoun, M. 1998a. Evolution de la composition du lait de dromadaire durant la lactation: Conséquences technologiques. Dans Dromadaires et chameaux, animaux laitiers: Actes du colloque de Nouakchott, Mauritanie, 24-26 Octobre 1994, Collection Colloques, CIRAD, Montpellier, France, Pp. 167-171.
Kamoun, M. 1998B. Approche pratique des besoins énergétiques, azotés et hydriques des Negga (Camelus dromedarius) en lactation. Dans Dromadaires et chameaux, animaux laitiers: Actes du colloque de Nouakchott, Mauritanie, 24-26 Octobre 1994, Collection Colloques, CIRAD, Montpellier, France, Pp. 47-54.
Khan, B. B. and Iqbal, A. 2001. Production and composition of camel milk (review). Pak. J. Agric. Sci. 38(3-4): 64-67.
Konuspayeva, G. and Faye, B. 2005. A better knowledge of milk quality parameters: A preliminary step for improving the camel milk market opportunity in a transition economy – The case of Kazakhstan. In: Saving the Camel and Peoples’ Livelihoods Building a Multi-Stakeholder Platform for the Conservation of the Camel in Rajasthan. International Conference, 23-25 November, 2004. Pp. 28-36.
Konuspayeva, G., B. Faye and G. Loiseau. 2009. The composition of camel milk: A meta-analysis of the literature data. J. Food Compos. Anal. 22: 95-101.
Musaad, A., B. Faye and A. A. Abu-Nikhela. 2013A. Lactation curves of dairy camels in an intensive system. Trop. Anim. Health Prod. 4: 1039-1046.
Musaad, A., B. Faye and S. Al-Mutairi. 2013b.Seasonal and physiological variation of gross composition of camel milk in Saudi Arabia. Emirates J. Food Agric. 25(8): 618-624.
Nagy, P., V. Faigl, J. Reiczigel and J. Juhasz. 2014. Effect of pregnancy and embryonic mortality on milk production in dromedary camels (Camelus dromedarius). J. Dairy Sci. 98(2): 975-86.
Richard, D. and Gérard, D. 1989. Production laitière des dromadaires Dankali (Ethiopie) [Milk production of Dankalicamels (Ethiopia)]. Rev.’ Elevage. Méd. Vét. des Pays. Trop. 42(1): 97-103. SAS. 2009. User’s Guide, Version 6.10 for Windows. SAS Institute
Inc., Cary, NC.
Zeleke, Z. M. 2007. Non – genetic factors affecting milk yield andmilk composition of traditionally managed camels (Camelusdromedarius) in Eastern Ethiopia. Livest. Res. Rural Dev. 19(6): Article≠85. Available from: http://www.lrrd.org/ lrrd19/6/zele19085.htm.
Table 3: Gross composition of mixed samples of three milking Gross composition (g/L) Means SD Min Max
Total solids (g/L) 116.76 11.32 92.00 145.00 Solid not fat (g/L) 80.31 10.96 60.00 94.00 Fat (g/L) 35.67 7.61 20.00 55.00 Lactose (g/L) 43.82 5.68 28.00 57.00
Ash (g/L) 8.21 0.64 5.00 11.00
Total protein (g/L) 29.45 3.29 20.90 35.9
Table 4: Protein fraction of mixed samples of three milking
Protein fraction (g/L) Nb Means SD Min Max
Casein 128 23.37 2.60 17.9 29.2
Whey protein 161 5.10 1.17 2.60 9.60 Non Protein N 161 0.47 0.23 0.20 1.50