HAL Id: halshs-00597656
https://halshs.archives-ouvertes.fr/halshs-00597656
Preprint submitted on 1 Jun 2011
HAL is a multi-disciplinary open access archive for the deposit and dissemination of sci-entific research documents, whether they are pub-lished or not. The documents may come from teaching and research institutions in France or
L’archive ouverte pluridisciplinaire HAL, est destinée au dépôt et à la diffusion de documents scientifiques de niveau recherche, publiés ou non, émanant des établissements d’enseignement et de recherche français ou étrangers, des laboratoires
Indian Manufacturing: The Role of Infrastructure and
Information & Communication Technology
Arup Mitra, Chandan Sharma, Marie-Ange Véganzonès-Varoudakis
To cite this version:
Arup Mitra, Chandan Sharma, Marie-Ange Véganzonès-Varoudakis. Total Factor Productivity and Technical Efficiency of Indian Manufacturing: The Role of Infrastructure and Information & Commu-nication Technology. 2011. �halshs-00597656�
C E N T R E D'É T U D E S E T D E R E C H E R C H E S S U R L E D É V E L O P P E M E N T I N T E R N A T I O N A L
Document de travail de la série Etudes et Documents
E 2011.15
Total Factor Productivity and Technical Efficiency
of Indian Manufacturing:
The Role of Infrastructure and Information &
Communication Technology
Arup Mitra Chandan Sharma
Marie-Ange Véganzonès –Varoudakis
CERDI
65 BD.F. MITTERRAND
63000 CLERMONT FERRAND - FRANCE
TÉL.0473177400
FAX 0473177428
Les auteurs
Arup Mitra
Professor, Institute of Economic Growth, University of Delhi Enclave, Delhi, India Email: arupmitra7@gmail.com
Chandan Sharma
Assistant Professor, National Institute of Financial Management, Faridabad, India Email: chandanieg@gmail.com
Marie-Ange Véganzonès –Varoudakis
Clermont Université, Université d’Auvergne, CNRS, UMR 6587, Centre d’Etudes et de Recherches sur le Développement International (CERDI), F-63009 Clermont-Ferrand, France
Email: Veganzones@aol.com
La série des Etudes et Documents du CERDI est consultable sur le site : http://www.cerdi.org/ed
Directeur de la publication : Patrick Plane
Directeur de la rédaction : Catherine Araujo Bonjean Responsable d’édition : Annie Cohade
ISSN : 2114-7957
Avertissement :
Les commentaires et analyses développés n’engagent que leurs auteurs qui restent seuls responsables des erreurs et insuffisances.
Abstract
Drawing on a recent dataset of the Indian manufacturing industry for 1994 to 2008, this paper shows for eight sectors that core infrastructure and Information & Communication Technology (ICT) matter for Total Factor Productivity (TFP) and Technical Efficiency (TE).In the analysis, we use a range of advanced estimation techniques to overcome problems of non-stationary, omitted variables, endogeneity and reverse causality (such as System-GMM, panel cointegration and FMOLS). Estimation results suggest that the impact of core infrastructure is rather strong on TFP and TE (elasticity of 0.32 and 0.17 respectively), while the effect of ICT appears slightly smaller (0.12 and 0.08, respectively). This finding is of particular importance in the Indian context of infrastructure bottlenecks. It strongly supports the idea that a lack of infrastructure can hamper growth in developing countries. Our results also reveal that the impact of infrastructure and ICT varies among the industries. Interestingly, Transport Equipments, Metal & Metal Products and Textile, which are sectors relatively more exposed to foreign competition, are also found to be more sensitive to infrastructure endowment. This result can be extended to the Chemical industry for TE. This finding implies that improving core and ICT infrastructure would proportionally benefit more to these sectors, which could play a leading role in the competitiveness and the industrial growth of the Indian economy.
Keywords: India, Manufacturing Industry, Infrastructure, Information and Communication Technology, Total Factor Productivity, Technical Efficiency
1. Introduction
The importance of infrastructure in the context of growth has been felt intensely both, by the researchers and policy makers, as it is considered to be one of the prime productivity stimulators. The planning commission of India has recognized infrastructure inadequacies in both rural and urban areas as a major factor constraining country’s growth. The government decided to increase expenditure on infrastructure from 4.6% of GDP to a figure between 7 and 8% in the eleventh plan period (2007-08 to 2011-12) (Planning Commission 2006).
On the other hand, manufacturing is an important sector in the Indian economy, comprising about 31 percent of the non-agricultural GDP (Natarajan and Duraisamy 2008). This sector has gained in strength in many ways over the past twenty years, as a consequence of a liberalization of industrial controls and a gradual integration with the world economy. Important industries, for instance automobile components, pharmaceuticals, special chemicals, textiles are recording exceptional growth in terms of overall output, as well as in export in the reform period (since 1991). The average output growth rate of the manufacturing is around 8% in the last decade and now it is targeted to grow at around 12% in the eleventh plan (see Planning Commission 2006). However, despite a moderate increase in the last two decades, TFP growth of this sector declined to less than 2% in the 1990s, from above 5% in the 1980s (e.g., see Trivedi et al. 2000; Goldar and Kumari 2003). Recent estimates as well, found only a marginal improvement of TFP growth in the 2000s (Sharma and Sehgal 2010; Kathuria et. al 2010).1
Recent related research, as well as government institutions (Planning Commission 2006), recognizes the infrastructure deficit as the most critical short-term obstacle to growth of the manufacturing sector.
In the theoretical literature, public infrastructure is considered to be a crucial factor of productivity and efficiency enhancement through external economies (e.g. Romer 1986; Lucas 1988; Barro and Sala-i-Martin 1995; Anwar 1995). Empirical findings on this issue, however, are inconsistent and often contrary to each other. Over the last two decades a large number of studies have focused on this issue. Most have noted that public infrastructure positively and sizably affects economic performance (Aschauer 1989; Munnel 1990a and b; Eisner 1991; Ford and Poret 1991). Some others, for example Evans and Karras (1994) and Holtz-Eakin (1994), challenged these findings on methodological ground and showed insignificant or minimal impact
of public infrastructure. Nevertheless, with improvement in empirical methodologies, some recent studies again estimated large effects (Stephan 2003; Everaert and Heylen 2004; Kamps 2006). In the case of India, Mitra et al. (2002), Hulten et al. (2006) and Sharma and Sehgal (2010) found moderate to large impact of infrastructure on the manufacturing performance.2 This wide range of estimates made these findings almost unemployable in the policy formulation. In this backdrop, the present study attempts to answer this question by investigating the effect of core infrastructure and of Information & Communication Technology (ICT) on the performances of the Indian manufacturing.
In this paper, we introduce six main novelties from the empirical standpoint. First, while the previous studies in India mainly focused on the impact of infrastructure on Total Factor Productivity (TFP) growth or output, we move a step forward by analyzing the impact on another crucial indicator of industrial growth namely Technical Efficiency (TE). Second, the inclusion of too many infrastructure variables separately in a regression analysis may lead to multicollinearity problem. In order to avoid this, we construct two composite indicators of infrastructure (G) and Information & Communication Technology (ICT) by using Principal Component Analysis (PCA). Third, in most of the previous studies in this area, information was mainly taken from the annual survey of industry (ASI) database. We utilize a new manufacturing database, Prowess, which includes eight important industries and allows us to extend the time horizon of the study up to 2008. This dataset is rich and provides heterogeneity in terms of trade and R&D across industries and over time as well. Fourth, since in the recent years the ICT sector has grown at an unprecedented rate, we investigate the role of this sector separately on the performance of the Indian manufacturing sector. Fifth, most of the previous studies have directly applied OLS and have not paid serious attention to the stationarity of the variables. As it is a well-known fact that non-stationarity of data series causes various estimation problems, we utilize unit root test and cointegration techniques to test the integration between variables in the panel context. For the estimation, we use Fully Modified OLS (FMOLS) and System GMM, which are likely to produce better results than traditional estimators by taking care of endogeneity problem in the estimation analysis. It also allows us to use the variables at the level form in the analysis rather than their growth rates. This is important because some information is lost when first difference forms are used. Finally, the recent trends suggest that the government has been putting in some serious efforts to enhance the infrastructure services by liberalizing the related policies3,
encouraging and engaging the private sector in infrastructure projects through public private partnership (PPP), and directly also investing in the infrastructure sector. The ongoing economic crisis has also provided this opportunity incidentally by enhancing public capital expenditure as part of fiscal stimulus and by encouraging higher private sector participation. The negative effect of this expansion is in terms of higher fiscal deficit (e.g., see Narayan 2006) and therefore, it becomes extremely relevant to estimate the magnitude of the effects of infrastructure on the industrial performance.
The paper is organized as follows. The second section presents the data and its sources to be used in the empirical analysis. Section three discusses the methodological aspects linked to the computation of Total Factor Productivity (TFP) and Technical Efficiency (TE). The forth section describes our empirical models of investigation, as well as the econometric issues related to their estimation. The fifth section estimates these models and illustrates the impact of core infrastructure and ICT on TFP and TE. The last section concludes and presents some policy recommendations.
2. The Data on Infrastructure, ICT and the Manufacturing Sector
In this study, we have utilized data of two-digit industry groups in the Indian manufacturing sector. The data have been gathered from the Prowess database4 provided by the Center for Monitoring Indian Economy (CMIE). Annual financial statements of firms belonging to eight industry groups, namely Food and Beverages, Textiles, Chemicals, Non-metallic Minerals, Metal and Metal Products, Machinery, Transport Equipments and Miscellaneous Manufacturing, have been used. Subsequently, firm-level data are transformed into industry-level data by aggregation. This is done for each year over the sample period, 1994-2008. The prime reason for taking 1994 as the initial year is that the Indian economy underwent structural reforms in the early 1990s, which have subsequently brought in vast changes in the manufacturing sector. Another practical reason is that the data on price indices and deflators for all variables are available from this year onwards.
We use net sales and gross value added of the industries as the measures of nominal output which is deflated by industry specific wholesale price indices (WPI) to obtain output in real terms5. The deflator is obtained from the Office of the Economic Adviser (OEA), Ministry of Commerce & Industry, Government of India (http://eaindustry.nic.in/). The series on real
capital stock is constructed using the perpetual inventory capital adjustment Method. Specifically, we compute it as:
t t
t K I
K =(1−δ) −1 + ………….. (1)
where, K is the capital stock, I is deflated gross investment, δ is the rate of depreciation taken at 7%, consistent with similar studies for India (Unel 2003; Ghosh 2009) and t indicates the year. The initial capital stock equals the net book value of capital stock for the year 1994. Data on other control variables such as trade (export and import) and R&D have also been extracted from the same database. A summary statistics of the variables is reported in Table A.4. of Appendix 4.
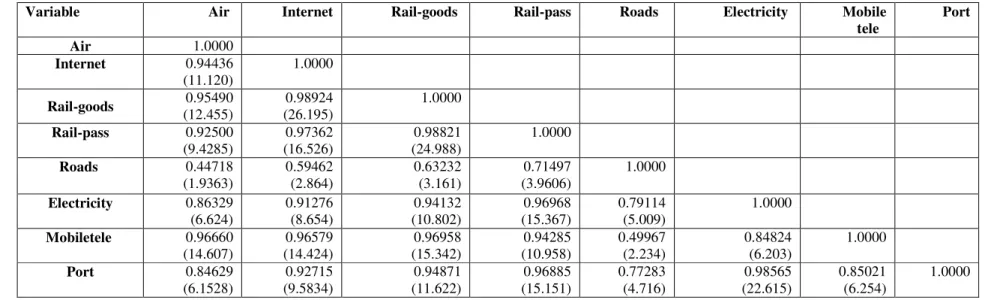
For infrastructure, this study considers physical infrastructure for the period 1994-2008. It covers transportation (road, rail and air), Information & Communication Technology (ICT) and energy sectors. The data sources for these variables are World Development Indicators (WDI) online (2011), and Infrastructure (2009) publications of CMIE. Instead of using all infrastructure variables separately, which is likely lead to multicollinearity (see correlation between infrastructure variables in Table A.2.3. of Appendix 2), we construct a core and an ICT infrastructure index for India by using Principal Component Analysis (PCA). For details of the indicators and methodologies of construction of both these indices see Appendix 3.
3- Measuring Total Factor Productivity (TFP) and Technical Efficiency (TE)
We start our empirical analysis by computing TFP for each industry. For this purpose, we follow a two-stage procedure. In the first stage, a panel of the eight industries is constructed and following Mitra et al. (2002), a basic production function in Cobb-Douglas form is specified:
where Q, K, and N are the value added, the capital input and the labor input, respectively for industry i for period t. Ti is the time trend specified for each industry i and α1 , α2 and α3 are the parameters to be estimated. The term ηt represents fixed time effects, while ln represents log of the variables.
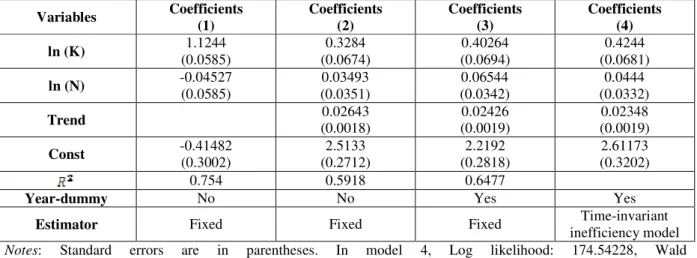
To check the robustness of the results, we have estimated equation 2 in four alternative ways and results are reported in columns 1 to 4 of Table 1. Column 1 of the table reports results in which trend and year-dummies are not included. Results of the estimation clearly suggest that
capital has become a major determinant of growth in industrial output in India, while contribution from the labor seems to be negligible. Column 2 of the table includes trend variable in the model, which moderates the magnitudes of the variables to a reasonable extent. Next we have included both trend and year dummies in the model and estimation results are reported in Column 3 of the Table 1. This result also confirms a significant role of capital and a small role that labor plays. We have utilized the results of column 3 for calculating TFP of the sample industries, which is computed as follows:
where αˆ1and αˆ2 are the estimated parameters of capital and labor, respectively.
To measure the Technical Efficiency (TE) of the Indian manufacturing sector, we utilize the Maximum Likelihood (ML) estimates of stochastic frontier production functions, developed by Battese and Coelli (1992) for panel data. In this model, industry effects are assumed to be distributed as a truncated normal variable, which allows it to vary systemically with time.6 Specifically, we employ time-varying efficiency model of the stochastic frontier as developed by Battese and Coelli (1992). The model may be specified as:
) ( it it
it it X V
Q =α + −µ ………. (4)
where Q and it X are output and inputs in log-form of i-th industry at time t. it
Disturbance term is composed of independent elements, Vitandµit. The former is
assumed to be independently and identically distributed as (0, 2 )
v
N σ . The element µit is a nonnegative random variable, associated with technical inefficiency in production, assumed to be independent and identically distributed with truncation (at zero) of the distribution ( , 2 )
µ
σ µit
N .
The parameters αs can be obtained by estimating the stochastic production function (4) using a ML technique.
Coelli (1996) utilizes the parameterization of Battese and Corra (1977) to replace
v
2
σ and σ2µwith σ2=σ2v+σ2µand
µ µ σ σ σ γ 2 2 2 + = v
in the context of ML estimation. The termγ
maximization process. Subsequently, the relative Technical Efficiencies of each industry can be predicated from the production frontier as follows:
) exp( )) ; ( ( exp it it it X f Q TE µ α = − = ………(5)
Since µitis, by definition, a nonnegative random variable, TE is bounded between zero and unity, where unity indicates that the industry is technically most efficient. Our model measuring the efficiency is:
) ( ln , 0 1 , 2 , it it t t t t i t i t i LnK LnN D v u Q =α +α +α +
∑
λ + − ………(6)Here Dtis a dummy variable having a value of one for tthtime period and zero otherwise and λts are parameters to be estimated. The dummy variable is introduced in the model for the
technical change; this is in line with the general index approach of Baltagi and Griffin (1988). The change in λt between successive periods becomes a measure of rate of technical change.
t t t t
TC,+1 =λ+1 −λ …… …………(7)
This implies that the hypothesis of no technical change is:λt =k∀t . Using the above model, we estimate the TE of the industries. Our dataset for the panel of industries is same as that used earlier for TFP estimation.
Finally, as discussed above, a Cobb-Douglas production is postulated for the purpose of TE estimation. The results are presented in column 4 of Table 1. The estimated coefficients of capital and labour are very similar to the results of column 3 and both variables are positive and statistically significant at the conventional level. On the basis of these results, TE of the industries is estimated for further analysis.
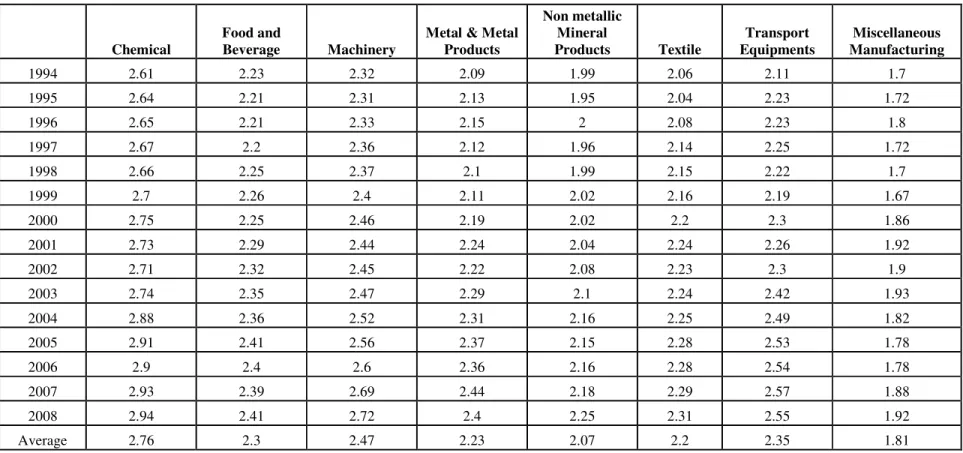
Results of TFP and TE calculations clearly indicate substantial differences across industries (see Tables A.1.1 and A.1.2 of Annex 1). It is the most productive industries in terms of TFP: Chemical, Transport Equipments and Machinery, which also show the fastest rate of TFP growth. Among the less productive are Textile and Non Metal products, which TFP growth is comparatively less satisfactory. As for TE, Transport Equipments and Chemical industries are still the most efficient, with a substantial rate of improvement of their efficiency over the period studied.
Table 1. Cobb- Douglas Production Function Estimation, 1994-2008 (Dependent Variable: ln(GVA))
Variables Coefficients (1) Coefficients (2) Coefficients (3) Coefficients (4) ln (K) (0.0585) 1.1244 (0.0674) 0.3284 (0.0694) 0.40264 (0.0681) 0.4244 ln (N) -0.04527 (0.0585) 0.03493 (0.0351) 0.06544 (0.0342) 0.0444 (0.0332) Trend (0.0018) 0.02643 (0.0019) 0.02426 (0.0019) 0.02348 Const -0.41482 (0.3002) (0.2712) 2.5133 (0.2818) 2.2192 (0.3202) 2.61173 0.754 0.5918 0.6477
Year-dummy No No Yes Yes
Estimator Fixed Fixed Fixed inefficiency model Time-invariant
Notes: Standard errors are in parentheses. In model 4, Log likelihood: 174.54228, Wald
:1296.01, Number of observations (panel):120(8). TFP computed on the basis of results of column (3). TE computed on the basis of results of column (4).
4. The Empirical Models of Manufacturing Performance and Estimation Issues
After estimating the TFP and TE of industries, we turn to assessing the impact of core infrastructure (G) and of Information & Communication Technology (ICT) on the performance indicators of the industries. For this purpose, we specify four models as follows:
it it it it X e TFP) =α+βln(G) +δ + ln( …… …… (8) it it it it X e TFP) =α +βln(ICT) +δ + ln( … ……. (9) it it it it X e TE) =α+βln(G) +δ + ln( …… ………. (10) it it it it X e TE) =α +βln(ICT) +δ + ln( … ……… (11)
where TFP, TE, G and ICT are estimated Total Factor Productivity, Technical Efficiency, Core Infrastructure index and ICT index of industry i at period t in the models. Further, we also include a set of additional control variables (X) which may affect productivity. The set of additional control variables include R&D intensity7, trade intensity8 and the size of the industry (Size).9
In the related literature a number of issues arise relating to application of estimators. These include spurious correlation due to non-stationary data, omitted variables, endogeneity and reverse causality, which may lead to biased estimation of coefficients. Therefore, we attempt to
overcome these problems. To tackle the issue of non-stationary, Hulten and Schwab (1991) estimate the inter-relation between TFP and infrastructure using first differences. However, using the first difference of the series could be costly as this may remove the long-run characteristics of the variables of interest. Moreover, it is highly likely that the short-term properties are quite different from the long-term ones.
Some researchers, for example Holtz-Eakin (1994), have used the Fixed-effects (FE) estimator for the analysis. The advantage of the FE estimator is that it can handle the issue of omitted variables that may be correlated with infrastructure. Somewhat FE also helps in alleviating the adverse consequences of endogeneity bias. Furthermore, to some extent, this estimation method addresses non-stationarity as well because in the ‘within form’, deviations from the mean are used in the estimation. Another method which could be useful in the presence of heterogeneity and contemporaneous correlation is system GMM (henceforth Sys-GMM). This estimator uses appropriate lags of variables in level form as instruments for equations in first difference form and conversely for equations in level form, all of which are combined into a system of equations with options to treat any of the variables in the system as endogenous. Blundell and Bond (1998) proposed the use of extra moment conditions that rely on certain stationarity conditions of the initial observation, as suggested by Arellano and Bover (1995). When these conditions are satisfied, the resulting system sys- Sys-GMM estimator has been shown in Monte Carlo studies by Blundell and Bond (1998) and Blundell, Bond and Windmeijer (2000) to have much better finite sample properties in terms of bias and root mean squared error. Another option is to retain the long-run properties of the series, which is to follow Canning and Pedroni (2008), Fedderke and Bogetić (2009) and Sharma and Sehgal (2010), which apply panel co-integration techniques and establish a long-run relation between infrastructure and industrial performance. We are, therefore, set to apply aforementioned methodologies in this study alternatively for checking consistency and robustness of the estimates.
A preliminary step in our approach involves the testing for the stationarity of the series used in equations 8, 9, 10 and 11. This has been done using the cross-sectional Im–Pesaran–Shin (CIPS) panel unit-root test, which is based on the simple averages of the individual cross-sectional augmented Dickey–Fuller statistics. The main advantages of this approach are that it incorporates potential cross-sectional dependence and it does not pool directly the autoregressive parameter in the unit root regression; thus it allows for the possibility of heterogeneous
coefficients of the autoregressive parameters under the alternative hypothesis that the process does not contain a unit root. The results of the unit root test are reported in Table 2. For all individual series the hypothesis of unit root cannot be rejected at the level form; however it is rejected convincingly in the first difference form.
Table 2. Test for panel unit root applying Im, Pesaran and Shin W- statistics
Variables At Level At 1st Difference
Ln (TFP) 0.12202 -3.04503**
Ln (TE) 1.92950 -4.91739**
Ln (R&D intensity) 1.01247 -2.39198**
Size ln (K) -1.22424 -2.73512**
Ln (Trade intensity) 2.14169 -2.45611**
Core Infra Index ln (G) 1.54134 -5.63417**
ICT Infra Index ln (ICT) 4.44407 -5.10710**
Notes: ** denotes significance at 5%
If the data generating process for the variables is characterized by panel unit roots, it is crucial to test for cointegration in a panel perspective. We apply Pedroni's (1999) test, an extension of the Engle-Granger construction to test the existing cointegration relationship. Two types of tests have been suggested by Pedroni. The first is based on the ‘within dimension’ approach, which includes four statistics: panel
ν
-statistic, panel ρstatistic, panel PP-statistic,and panel ADF-statistic. These statistics pool the autoregressive coefficients across different members for the unit root tests on the estimated residuals. The second test is based on the ‘between-dimension’ approach, which includes three statistics: group ρ -statistic, group PP-statistic, and group ADF-statistic. These statistics are based on estimators that simply average the individually estimated coefficients for each member. We calculate heterogeneous panel cointegration as well as heterogeneous group mean panel cointegration statistics and results are reported in Table.A.5 of the Appendix 5. The rows labeled ‘within-dimension’ approach contain the computed value of the statistics based on estimators that pool the autoregressive coefficient across different industries for the unit root tests on the estimated residuals. The rows labeled between-dimension report the computed value of the statistics based on estimators which average individually the estimated coefficients for each industry. Overall these results provide support for cointegrating relationship for all our models.
5. Estimating the Effects of Infrastructure and ICT on the Manufacturing Performance Having established that there is a linear combination between variables that keeps the pooled variables in proportion to one another in the long run, we set to generate individual long-run estimates for all the models. Considering that the OLS estimators are biased and inconsistent when applied to cointegrated panels, we utilize the “group-mean” panel Fully Modified OLS (FMOLS) estimator developed by Pedroni (1999, 2001).10
We first estimate equation 8, in which the impact of core infrastructure (G) on TFP is tested for the eight industries. Results are reported in Table 3. Surprisingly, estimated coefficients of the core infrastructure variable are found to be sizably large in several sectors, as well as on the overall manufacturing. The estimated effect indicates that infrastructure explains 65% of TFP growth in Transport Equipments, 32% in Metal & Metal Products and 30% in Textile. In other industries, it varies from being large to moderate (except in the case of Chemical, where it is found to be statistically insignificant11). In average, results suggest that the impact on overall manufacturing is around 0.32, which means that 1% increase in infrastructure leads to a 0.32% TFP growth.
Table 3. FMOLS Result: Effects of Core Infrastructure on ln (TFP), 1994-2008
Industry Core Infra
Index ln (G) Ln (Trade intensity) Ln (R&D intensity) Size ln (K)
Chemical (-0.572) -0.0787 (0.083) 0.0018 0.0629** (3.825) (-0.6395) -0.0144
Food and Beverage 0.2423** (3.259) (1.021) 0.0413 (1.2705) 0.006 (0.19668) 0.0056
Machinery 0.1779** (2.049) 0.0402 (0.976) 0.0492** (2.055) 0.0219 (0.4401)
Metal & metal products 0.3291** (6.727) 0.1015** (4.467) (0.423) 0.0045 (-3.003) -0.0931 Non metallic mineral
products 0.2622** (3.668) 0.0552** (2.725) 0.0058** (2.725) 0.0129 (0.5726) Textile 0.3079** (11.382) (-1.215) -0.0371 0.0023** (0.629) (0.2081) 0.00432 Transport equipments 0.6544** (11.478) 0.0913** (6.337) (-1.547) -0.0114 -0.1031** (-14.778) Miscellaneous manufacturing 0.56603* (1.909) -0.1239* (-1.744) -0.0061 (-0.1531) -0.0329 (-0.2839) Overall (14.108) 0.315** 0.0214** (4.4727) 0.0142** (2.9503) -0.0248** (-6.1121)
Notes: ** and * denote significant at 5% and 10% critical level respectively. t-statistics are in parentheses. Results regarding other control variables are rather mixed. Trade intensity is found to be positive and significant in Metal & Metal Products, Non Metallic Mineral Products, and
Transport Equipments, which are sectors relatively exposed to foreign competition. The impact is estimated to be 5%-10% on these industries12. However the effect on the overall manufacturing is found to be around 2%, which is lower than expected. Furthermore, the R&D variable explains only 1.4% of TFP growth, which is not very surprising as Indian manufacturing is known for its low R&D intensity. Nonetheless, in research intensive industries, i.e. Chemical and Machinery, effect is found to be 6% and 5% respectively, which is quite encouraging, knowing that these sectors are also the most productive of our sample (see section 3). As for the size, impact is noticeable in Food & Beverage and Non Metallic Mineral Products, which are sectors characterized by small low productive firms. This result means that a policy of concentration would generate high productivity gains in these sectors.
Table 4. FMOLS Result: Effects of ICT Infrastructure on TFP, 1994-2008
Industry
Core Infra Index ln (ICT)
ln (Trade intensity) ln (R&D intensity) Size ln (K)
Chemical -0.0111 (-0.265) -0.0067 (-0.346) 0.0678** (7.891) 0.0063 (0.348)
Food and Beverage 0.0781** (1.7958) (1.7467) 0.0794* (0.989) 0.0059 0.0515** (2.003) Machinery (0.205) 0.0095 0.065225* (1.777) 0.0708** (3.413) (1.060855) 0.051530 Metal & metal products 0.1778**
(4.014) 0.1341** (4.434) 0.0074 (0.4867) -0.0832** (-1.9258)
Non metallic mineral products 0.05662** (1.7452) 0.1037** (7.069) 0.0031 (1.0361) 0.0372** (1.7921) Textile 0.2237** (26.435) (0.1311) 0.0017 (0.60934) 0.0011 (-0.087) -0.0008 Transport equipments 0.2174** (3.603) 0.0681* (1.761) 0.0194 (1.252) -0.0963** (-4.976) Miscellaneous manufacturing 0.2032 (1.217) -0.0759 (-1.112) 0.0209 (0.565) 0.0222* (0.189) Overall 0.1244** (12.941) 0.0462** (5.431) 0.0245** (5.743) -0.001482 (-0.584)
Notes: ** and * denote significant at 5% and 10% critical level respectively. t-statistics are in parentheses. Keeping in mind the dramatic development of the ICT sector in the recent years in India, we separately examine the effect of this sector on TFP growth by estimating equation 9. Results indicate that ICT is closely linked to manufacturing productivity as well. Its impact for some industries is substantially large too (see Table 4). In Textile, Transport Equipments, and Metal & Metal Products industry, it has a positive and statistically significant effect of 18% to 22% on
TFP. The effect on the overall manufacturing is also estimated to be positive and sizable (12%). Results regarding other control variables are not found to be very diverse from that in equation 8.
Next, we shift to the impact of infrastructure on Technical Efficiency (TE). We first estimate equation 10 and test the effect of core infrastructure by industry (see Table 5). The overall results for TE are not very different from those for TFP. Interestingly, it is still Transport Equipments (which is also the most efficient industry of our sample, see table A.1.2 in Annex 1), which appears more dependent on infrastructure endowment (elasticity of 0.40). In the other industries, the estimated elasticity varies from 0.13 to 0.20 in Chemical and Textile products.13
The estimated effect regarding the overall manufacturing (0.17) also confirm that TE is closely related to core infrastructure. Results regarding other control variables suggest that trade and research related activities do not have a really sizable impact on the efficiency of industries, contrarily to results for TFP 14, while the variable Size appears as a more constant factor of
efficiency growth, especially in Food and Non Metallic Mineral Products.
Table 5: FMOLS Result: Effects of Core Infrastructure on Ln (TE), 1994-2008
Industry Core Infra
Index ln (G) ln (Trade intensity) ln (R&D intensity) Size ln (K) Chemical 0.1974** (9.146)
0.0183**
(5.1496) (-0.8359) -0.00216 (0.0136) 0.0136
Food and Beverage 0.1518**
(4.808) 0.0148 (0.863) 0.0002 (0.0912) 0.0471** (3.874) Machinery 0.14989** (10.441) (1.491) 0.0101 0.0111** (2.799) 0.0163** (1.979) Metal & metal products 0.1514** (21.081) 0.0178** (5.341) (1.584) 0.0025 0.0188** (4.149)
Non metallic mineral products 0.1391** (13.042) 0.02353** (7.686) -0.0005 (-1.204) 0.0195** (5.799) Textile 0.2033** (26.155) 0.0211** (2.406) 0.004** (3.687) 0.0162** (2.721) Transport equipments 0.4056** (15.049) -0.0183** (7.783) -0.0183** (-6.841) 0.0191** (7.563) Miscellaneous manufacturing 0.1673** (6.383) (1.0028) 0.0053 (1.226) 0.0036 0.0331** (3.851) Overall 0.1757** (37.514) 0.0189** (11.215) 0.00004 (0.179) 0.0231** (11.945)
Notes: ** and * denote significant at 5% and 10% critical level respectively. t-statistics are in parentheses. Next, we test the effect of ICT on TE by estimating equation 11. Estimation results suggest that ICT has positive, statistically significant and sizable impact on all industries (see Table 6). The impact still varies among the sectors. It is still Transport Equipments, followed by
Textile, which show the highest sensibility to ICT limitations (with an elasticity of 0.16 and 0.12 respectively). The overall elasticity is also estimated to be 0.08. As for the size, it still plays a role in the efficiency of the Food industry in particular, as seen previously15.
Table 6. FMOLS Result: Effects of ICT Infrastructure on ln (TE), 1994-2008
Industry Core Infra
Index ln (ICT) ln (Trade intensity) ln (R&D intensity) Size ln (K)
Chemical 0.0781** (4.106) 0.0161** (2.118) 0.0098** (2.944) 0.0176** (2.511)
Food and Beverage 0.0662** (3.074) (1.143) 0.0257 (0.147) 0.0004 0.0691** (5.603)
Machinery 0.0763** (5.484) (0.794) 0.0115 0.0204** (3.289) (0.794) 0.0115
Metal & metal products 0.0941** (9.287) 0.0301** (4.351) (0.568) 0.0019 0.0223** (2.263) Non metallic mineral
products 0.0786** (15.769) 0.0364** (17.141) -0.0016** (-3.712) 0.0192** (6.167) Textile 0.1241** (10.789) 0.0547** (2.731) (0.722) 0.0018 (1.329) 0.0189 Transport equipments 0.1641** (4.133) 0.0318** (1.935) (-0.705) -0.0047 0.0213** (2.557) Miscellaneous manufacturing 0.0886** (6.439) 0.0166** (3.241) 0.0088** (3.1911) 0.0353** (4.012) Overall 0.0827** (20.889) 0.0046** (2.278) 0.0289** (12.176) 0.0269** (8.923)
Notes: ** and * denote significant at 5% and 10% critical level respectively. t-statistics are in parentheses. On the whole, while the coefficients estimated vary, both in terms of magnitude and statistical significance, various constant effects are perceivable across the industries. Transport Equipments, Metal & Metal products and Textile are found to be highly associated with infrastructure provisions, including ICT, as far as their productive performances are concerned. This is also the case of the Chemical industry (which is the most productive sector in India, both in terms of TFP and TE, along with Transport and Machinery) for Technical Efficiency. This may be due to the fact that these sectors are relatively more exposed to foreign competition and need a more supportive environment in terms of infrastructure to be able to compete efficiently. This fragility justify that a special attention needs to be paid when taking decisions that may affect the quality and availability of infrastructure needed by these sectors. This also means that the pay off of an improvement of core and ICT infrastructure would be more substantial in these industries, which could play a leading role in the industrial development and the export capacity of the country. This conclusion is all the more important in the Indian context of infrastructure bottlenecks and economic reforms. It may also explain why some industries (Textile and Metal)
have register less satisfying performance in term of TFP and TE. This could be the case of more productive ones (Chemical, Machinery) in the future, if infrastructure is not adequately improved in India.
Another finding relates to the ICT, which is pertinent, as earlier studies generally could not acknowledge its role in enhancing productivity gains. Launder (1995) and Hu and Plant (2001), for instance, found little evidence in favor of ICT contributing to productivity in the USA. Parham et al. (2001) showed that the adoption of ICT only contributed to a 1.1% improvement in productivity surge in the 1990s in the case of Australia. In the recent years, it seems that the Indian manufacturing has gained considerably from ICT, not only in terms of production of equipments, but more because of the use of ICT in the production process. This has perhaps generated substantial technological advances for the Indian industry and we believe it is widely reflected in our results.
Our findings relating to core and ICT infrastructure are estimated to be pretty large in magnitude and therefore, we intend to examine the consistency of the results by an alternative estimator of GMM of Blundell and Bond (1998). The Blundell and Bond estimator, also called Sys-GMM estimator, combines the regression expressed in first difference forms (lagged values of the variables in the level forms are used as instruments) with the original equation expressed in level forms (this equation is instrumented with lagged differences of the variables) and allows to include some additional instrumental variables. We prefer this option to a fixed-effect estimator for two reasons. First, it allows us to take into account the unobserved time-invariant bilateral specific effects. Second, it can deal with the potential endogeneity arising from the inclusion of the lagged dependent variables and other potentially endogenous variables.
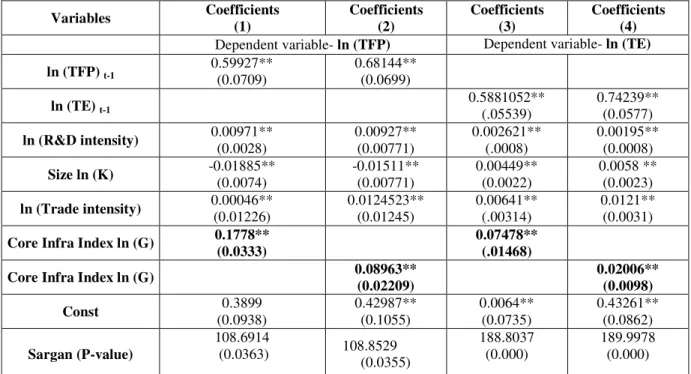
Results of the analysis using Sys-GMM are presented in Table 7. In column 1, findings pertaining to equation 8 validate that core infrastructure has been an important source of TFP growth in the Indian manufacturing. The estimated elasticity (around 0.18) is substantially large, however, lower than in the case of the FMOLS estimate (0.315). Results for equations 9, 10 and 11 show similarities in this respect (see columns 2, 3 and 4 of the table). The elasticity of TFP regarding ICT (0.09) is found to be also relatively lower than that provided by FMOLS (0.12). The elasticity of TE with respect to core infrastructure and ICT (0.07 and 0.02 respectively) is even below half of the estimate of FMOLS (0.18 and 0.08). Findings regarding R&D and Trade
intensity on both TFP and TE also show a smaller magnitude, below 1% impact on the productivity and efficiency of the Indian manufacturing sector.
Table 7: Sys-GMM Results: Determinants of ln (TFP) and ln (TE), 1994-2008
Variables Coefficients (1) Coefficients (2) Coefficients (3) Coefficients (4)
Dependent variable- ln (TFP) Dependent variable- ln (TE)
ln (TFP) t-1 0.59927** (0.0709) 0.68144** (0.0699) ln (TE) t-1 0.5881052** (.05539) 0.74239** (0.0577) ln (R&D intensity) 0.00971** (0.0028) 0.00927** (0.00771) 0.002621** (.0008) 0.00195** (0.0008) Size ln (K) -0.01885** (0.0074) -0.01511** (0.00771) 0.00449** (0.0022) 0.0058 ** (0.0023) ln (Trade intensity) 0.00046** (0.01226) 0.0124523** (0.01245) 0.00641** (.00314) 0.0121** (0.0031)
Core Infra Index ln (G) 0.1778**
(0.0333)
0.07478** (.01468)
Core Infra Index ln (G) 0.08963**
(0.02209) 0.02006** (0.0098) Const 0.3899 (0.0938) 0.42987** (0.1055) 0.0064** (0.0735) 0.43261** (0.0862) Sargan (P-value) 108.6914 (0.0363) 108.8529 (0.0355) 188.8037 (0.000) 189.9978 (0.000)
Notes: Standard errors are in parentheses. *, ** indicate statistical significance at the 10% and 5%, respectively.
Sargan is the Sargan (1958) test of over-identifying restrictions.
Our results advocate that the selection of estimator is crucial in this field of research, as the magnitude of elasticity varies drastically from one estimator to another. Keeping in mind the complications relating to the endogeneity of the infrastructure variable, this study therefore goes to considerable lengths to address identification and spurious correlation problems, by using FMOLS and Sys-GMM techniques.
Our results however still support the earlier findings of Mitra et al. (2002), Hulten et al. (2006) and Sharma and Sehgal (2010), which found that infrastructure is an important channel of productivity growth in the Indian manufacturing sector. It seems, though, that over the period the role of public infrastructure has been increasing, as the magnitude of the TFP elasticity in this study is higher than that of the others. Nonetheless, if we compare our results with important international studies, it is somewhat the same: for instance, Aschauer (1989a), Munnell (1990a,b), Eisner (1991) and Duggall et al. (1999) for USA, Everaert and Heylen (2004) for Belgian regions, Kamps (2006) for 22 OECD countries, Stephan (2003) for West German
regions and Demetriades and Mamuneas (2000) for 12 OECD countries found the output elasticity with respect to infrastructure to be much higher (up to around 60 per cent).16 It is noteworthy that the above mentioned previous studies have not necessarily tested the impact on TFP and TE specifically.
In contrast, results regarding other control variables are more mitigated. It seems that increased globalization and higher level of trade intensity has still not become an important source of productivity growth, except for a few sectors more exposed to foreign competition. Perhaps, the learning by trade process is relatively slow in India, due to a long period of industrial protection and a high number of SMEs in the economy: therefore, it might take some more time in realizing its impact on productivity. Also, the size of the firms don’t seem to be a significant source of productivity and efficiency in the Indian manufacturing, although concentration could play a certain role in some industries, such as Food,. As for R&D, low intensity remains a serious concern in India and requires the attention of the policy makers, as our results show that research intensive industries, such as Chemical and Machinery, tend to be more productive than other.
6. Conclusion and Policy recommendations
Using a recent dataset on the Indian manufacturing industry for 1994 to 2008, this paper presents evidence on the impact of core infrastructure (G) and of Information & Communication Technology (ICT) on the Total Factor Productivity (TFP) and Technical Efficiency (TE) of eight manufacturing industries in India. In the literature, a number of issues arise relating to application of estimators. These include spurious correlation due to non-stationary data, omitted variables, endogeneity and reverse causality, which may lead to biased estimation of coefficients. In this study, we overcome these problems by utilizing a range of advanced estimation techniques, such as Sys-GMM, panel cointegration and FMOLS. Furthermore, the inclusion of too many infrastructure variables separately in a regression analysis often leads to serious multicollinearity problem. In order to avoid this, we construct composite indices for infrastructure and ICT by using the Principal Component Analysis (PCA) methodology.
Estimation results clearly bring out the key role played by core and ICT infrastructure in the context of the Indian manufacturing. Findings suggest an elasticity with respect to core infrastructure of around 0.32 for TFP, what is pretty high. Our results regarding TE are smaller,
at around 0.12, but still sizeable. The evidence also highlights that the dramatic growth of ICT in India had a significant effect on the manufacturing productive performance, both at the TFP and TE level. This constitutes an interesting result still not acknowledged by the literature. Considering the fact that our estimates with respect to infrastructure are pretty large in magnitude, we have examined the consistency of the results by an alternative estimator of Sys-GMM. The estimated elasticity using this estimator, although smaller, turned out to be still large.
Our results show as well that some industries, such as Transport Equipments, Metal & Metal Products and Textile for TFP and TE, and Chemical products for TE display a higher sensitivity to infrastructure endowment. Interestingly, these industries are somewhat more exposed to international competition. These results are of particular importance in the Indian context of infrastructure bottlenecks. It means that improving infrastructure and ICT endowment would particularly help these sectors to resist the strong international competition and reinforce the industrial export capacity of the country. This result constitutes an important mean of appreciation of the positive impact of a policy in favor of core and ICT infrastructure, since India manufacturing suffers from a deficient integration into the world economy, as well as a high competition in the world market.
In the analysis, we have also used three important control variables namely, trade and R&D intensity, as well as the size of the firms. The findings are mitigated and suggest a weak impact of these variables on the Indian manufacturing performance. Low in-house R&D remains a serious concern in India and requires a special attention of the policy makers. Actually, our estimations show that it is in Chemical and Machinery, which are more research intensive industries, that the impact of R&D is sizeable. Interestingly, these two industries are also the most productive ones, what constitutes an encouraging result. As for Trade intensity, our findings exhibit a higher sensitivity to this variables of sectors more exposed to international competition (Textile, Transport, and Metal, as well as Chemical in the case of TE), what means that trade liberalization have more impact in terms of productivity gains in these sectors. As for the size, a policy of concentration of firms would be advisable in sectors like Food and Non Metal products, which are characterized by a higher elasticity and a lower productivity of firms.
Results of this study are somewhat in the line of earlier findings of Mitra et al. (2002), Hulten et al. (2006) and Sharma and Sehgal (2010). However, it seems that over the period the role of public infrastructure has been increasing as the magnitude of the TFP elasticity in this
study is estimated to be comparatively larger than that in others. In the light of the above findings, this study further supports the argument of Mitra et al. (2002) that lack of infrastructure can bring a halt to growth in developing economies. As per our results, enhancing core and ICT infrastructures, especially in the sectors more sensitive to infrastructure deficiency, can constitute a powerful engine of competitiveness and industrial growth, with these sectors playing a leading role in India. Actually, like other developing countries, India is also increasingly concerned about improving productivity, as the country face the intensifying pressure of globalization. In this context, infrastructure deficiencies have to be taken into consideration, if the country wants to further diversify in an increasing competitive world.
Appendix 1
Table A.1.1. Estimated TFP of the Indian Manufacturing Industries, 1994-2008
Chemical
Food and
Beverage Machinery
Metal & Metal Products Non metallic Mineral Products Textile Transport Equipments Miscellaneous Manufacturing 1994 2.61 2.23 2.32 2.09 1.99 2.06 2.11 1.7 1995 2.64 2.21 2.31 2.13 1.95 2.04 2.23 1.72 1996 2.65 2.21 2.33 2.15 2 2.08 2.23 1.8 1997 2.67 2.2 2.36 2.12 1.96 2.14 2.25 1.72 1998 2.66 2.25 2.37 2.1 1.99 2.15 2.22 1.7 1999 2.7 2.26 2.4 2.11 2.02 2.16 2.19 1.67 2000 2.75 2.25 2.46 2.19 2.02 2.2 2.3 1.86 2001 2.73 2.29 2.44 2.24 2.04 2.24 2.26 1.92 2002 2.71 2.32 2.45 2.22 2.08 2.23 2.3 1.9 2003 2.74 2.35 2.47 2.29 2.1 2.24 2.42 1.93 2004 2.88 2.36 2.52 2.31 2.16 2.25 2.49 1.82 2005 2.91 2.41 2.56 2.37 2.15 2.28 2.53 1.78 2006 2.9 2.4 2.6 2.36 2.16 2.28 2.54 1.78 2007 2.93 2.39 2.69 2.44 2.18 2.29 2.57 1.88 2008 2.94 2.41 2.72 2.4 2.25 2.31 2.55 1.92 Average 2.76 2.3 2.47 2.23 2.07 2.2 2.35 1.81
Table A.1.2. Estimated TE of the Indian Manufacturing Industries, 1994-2008
Chemical Food and
Beverage
Machinery Metal & metal
products Non metallic mineral products Textile Transport equipments Miscellaneous manufacturing 1994 87.55 87.55 87.55 87.55 87.55 87.55 87.55 87.55 1995 88.68 88.73 88.42 88.23 88.74 88.91 88.37 88.79 1996 90.03 89.63 89.65 89.17 89.96 90.22 89.95 90.38 1997 90.95 89.96 90.33 89.82 90.75 90.86 91.38 91.1 1998 91.34 89.93 90.28 89.7 91 90.89 91.72 91.05 1999 91.98 90.61 90.62 90.03 91.41 91.24 92.81 91.55 2000 93.37 92.09 91.95 91.18 92.67 92.24 94.66 93.53 2001 93.81 92.47 92.33 91.47 93.08 92.55 94.89 94.01 2002 93.87 92.41 92.34 91.29 92.89 92.42 94.55 93.91 2003 94.7 93.73 93.39 92.13 93.78 93.35 95.17 94.73 2004 94.76 94.29 93.59 92.38 94.63 93.5 95.82 95.06 2005 95.38 94.77 93.98 92.94 95.1 94.04 96.34 95.92 2006 96.21 95.65 94.79 93.81 95.6 94.78 97.15 96.58 2007 96.99 96.66 95.46 94.46 96.13 96.17 98.78 97.29 2008 97.55 97.4 96.1 95.28 97 96.94 100 98.18
Appendix 2
Table A.2.1 Infrastructure and ICT Variables: Sources of Data
Variable Sector Indicator Data sources
Air Transportation Air transport, passengers carried WDI
Electricity Electricity Electricity production (kWh/per-capita) WDI
Internet Information and Communication Internet users (per 100 people) WDI
Mobile Information and Communication Mobile cellular subscriptions (per 100 people) WDI
Mobile_Tele Information and Communication Mobile and fixed-line telephone subscribers (per 100 people) WDI
Port Transportation port(commodity wise traffic ,000 tones) CMIE
Rail_goods Transportation Railways, goods transported (million ton-km) WDI
Rail_pass Transportation Railways, passengers carried (million passenger-km) WDI
Roads Transportation Roads, total network (km/1000people) WDI
Tele Information and Communication Telephone lines (per 100 people) WDI
Table A.2.2. Correlation between Infrastructure Variables
Variable Air Internet Rail-goods Rail-pass Roads Electricity Mobile
tele Port Air 1.0000 Internet 0.94436 (11.120) 1.0000 Rail-goods (12.455) 0.95490 (26.195) 0.98924 1.0000 Rail-pass 0.92500 (9.4285) 0.97362 (16.526) 0.98821 (24.988) 1.0000 Roads 0.44718 (1.9363) 0.59462 (2.864) 0.63232 (3.161) 0.71497 (3.9606) 1.0000 Electricity 0.86329 (6.624) 0.91276 (8.654) (10.802) 0.94132 (15.367) 0.96968 0.79114 (5.009) 1.0000 Mobiletele 0.96660 (14.607) 0.96579 (14.424) 0.96958 (15.342) 0.94285 (10.958) 0.49967 (2.234) 0.84824 (6.203) 1.0000 Port 0.84629 (6.1528) 0.92715 (9.5834) 0.94871 (11.622) 0.96885 (15.151) 0.77283 (4.716) 0.98565 (22.615) 0.85021 (6.254) 1.0000
Appendix 3 Composite Infrastructure and ICT indicators
In order to construct a composite core infrastructure index for India, we apply Principal Component Analysis (PCA). In this exercise, normalized values of nine important infrastructure indicators are used. The results bring out one significant component and this component explains 90% of variance in the underlying individual indicators. In the next stage, on the basis of the results of PCA, factor loadings of variables are used as weights of respective variables in constructing the composite infrastructure index.
Table A.3.1. Principle Component Analysis: Core Infrastructure (G) (1994 to 2008)
Eigenvalue Proportion P1 7.25486** 0.9069 P2 0.561524 0.0702 P3 0.128091 0.0160 P4 0.03333 0.0042 P5 0.009241 0.0012 P6 0.007714 0.0010 P7 0.004457 0.0006
Table A.3.2. Factor loadings: Core Infrastructure (G) (Eigenvectors)
P1 Air 0.3391 Internet 0.3454 Rail-goods 0.3587 Rail-pass 0.3688 Roads 0.3063 Electricity 0.3694 Mobiletele 0.3679 Port 0.3681
Using the same methodology as for the composite infrastructure index, an ICT index (ICT) is also constructed in this study. The result of PCA for this sector suggests the presence of one significant component, which explains 94% variations (see Table 4.A). On the basis of the factor loadings the weights are assigned to the respective variables for constructing the ICT index (see Table-5.A).
Table A.3.3. Principle Component Analysis: ICT Infrastructure (ICT) (1994 to 2008)
Eigenvalue Proportion
P1 2.8351** 0.9451
P2 0.15522 0.0517
P3 0.00959 0.0032
Table A.3.4. Factor loadings: ICT Infrastructure (ICT) (Eigenvectors)
P1
Internet 0.5908
Mobile 0.5762
Tele 0.5647
Appendix 4
Table A.4. Summary statistics ICT Infra Index ln (ICT) Core Infra Index ln (G) ln (TE) ln (K) ln (R&D intensity) ln (Trade intensity) ln (N) ln (Q) (GV A) ln (TFP) ln (Q) (real output) ln (M) ln (F) Mean 2.89 2.71 2.02 4.33 1.93 0.3 3.8 5 4.28 2.03 4.64 4.29 3.2 2 Media n 2.94 2.74 2.02 4.23 1.81 0.27 3.9 4 4.25 2.03 4.65 4.30 3.16 Maxim um 3.01 2.82 2.06 5.15 3.29 0.77 4.3 5 5.34 2.08 5.65 5.32 3.79 Minim um 2.15 2.23 2 3.58 0.69 0.14 3.0 2 3.35 1.99 3.76 3.43 2.6 4 Std. Dev. 0.21 0.14 0.01 0.35 0.65 0.11 0.2 9 0.41 0.02 0.39 0.04 0.3 5 Skewn ess -2.96 -2.87 -0.02 0.56 0.25 1.76 -0.9 0.33 0.36 0.11 0.03 -1.5 2 Kurtos is 10.8 10.47 2.23 2.66 2.01 6.62 3.2 8 3.29 2.21 0.22 0.15 0.2 2
Appendix 5
Table A.5. Pedroni (1999) Panel Cointegration Test Results
Statistics ln (TFP), ln (K), ln (Trade intensity), ln (R&D intensity), ln (G) (1) ln (TFP), ln (K), ln (Trade intensity), ln (R&D intensity), ln (ICT) (2) ln (TE), ln (K), ln (Trade intensity), ln (R&D intensity), ln(G) (3) ln (TE), ln (K), ln (Trade intensity), ln (R&D intensity), ln (ICT) (4) Within dimension Panel v 0.673340 1.028951 -275.3083 -578.5434 Panel _
ρ
-1.171354 -1.382245* -2.636909** -1.015245 Panel PP -8.588976** -6.646745** -6.783835** -4.528324** Panel ADF -10.96266** -7.042465** 2.326346 1.720540 Between-dimension’ Panel _ρ
-0.100532 -0.360805 -1.722097** -0.433731 Panel PP -9.912829** -7.565237** -7.671325** -5.287092** Panel ADF -11.99638** -6.434163** 3.636288 2.135979Notes: ** denotes significance at 5%. * denotes significance at 10%
References
Aaron, HJ (1990) Discussion, in: A.H.Munnell (ed.), Is There a Shortfall in Public Capital Investment? Federal Reserve Bank of Boston, Boston, USA.
Ahluwalia I J (1991) Productivity and Growth in Indian Manufacturing. Oxford University Press, New Delhi.
Anwar S (1995) An impure public input as a determinant of trade. Finnish Economic Papers 8: 91-5.
Arellano M, Bover O (1995) Another look at the instrumental variable estimation of error-components models. Journal of Econometrics 68 (1): 29-51.
Aschauer D A (1989) Is public expenditure productive. Journal of Monetary Economics. 23:177-200.
Balakrishnan P, Pushpangadan K. (1994) Total factor-productivity growth in manufacturing industry: a fresh look. Economic and Political Weekly 29(31): 2028-35.
Barro RJ, Sala-i-Martin X (1995) Economic Growth, International Editions. McGraw-Hill,New York, NY.
Basher, SA, Mohsin M (2004) PPP tests in cointegrated panels: evidence from Asian developing countries. Applied Economics Letters, 11 (3), 163-6.
Battese GE, Coelli TJ (1992) Frontier production functions, technical efficiency and panel data: with application to paddy farmers in India. Journal of Productivity Analysis 3: 153-69.
Battese GE, Corra G S (1977) Estimation of a production frontier model: with application to the Pastoral zone of Eastern Australia. Australian Journal of Agricultural Economics 21 (3): 169-79. Ben-David D (1993) Equalizing exchange: trade liberalization and income convergence. Quarterly Journal of Economics 108 (3): 653-79.
Blundell R, Bond S (1998) Initial conditions and moment restrictions in dynamic panel data models. Journal of Econometrics 87 (1): 115-43.
Blundell, R.W., S.R. Bond and F. Windmeijer (2000) Estimation in Dynamic Panel Data Models: Improving on the Performance of the Standard GMM Estimator’, in B. Baltagi (ed.), Nonstationary Panels, Panel Cointegration, and Dynamic Panels, Advances in Econometrics 15, JAI Press, Elsevier Science.
Canning D, Pedroni P (2008). Infrastructure, Long-Run Economic Growth And Causality Tests For Cointegrated Panels. Manchester School, University of Manchester 76(5): 504-527.
Demetriades PO, Mamuneas T P (2000). Intertemporal Output and Employment Effects of Public Infrastructure Capital: Evidence from12 OECD Economies. Economic Journal 110, 687– 712.
Cuneo P, Mairesse J (1984) Productivity and R&D at the firm level in French manufacturing, in Z. Griliches (ed.), R&D, Patents and Productivity, Chicago, University of Chicago Press, 375-92. Duggal, VG, Saltzman C, Klein L R (1999) Infrastructure and Productivity: A Nonlinear Approach. Journal of Econometrics 92: 47–74.
Everaert G F Heylen (2004) Public Capital and Long-Term Labour Market Performance in Belgium. Journal of Policy Modelling 26: 95–112.
Fedderke J W, Bogetic Z (2009) Infrastructure and growth in South Africa : direct and indirect productivity impacts of 19 infrastructure measures. World Development 37( 9): 1522-39.
Garcia-Mila T, McGuire TJ, Porter RH (1996) The effect of public capital in state-level production functions reconsidered. Review of Economics and Statistics 75 (1): 177-80.
Ghosh S (2009) Do productivity and ownership really matter for growth? Firm-level evidence. Economic Modelling 26(6):1403-1413.
Goldar, BN (2004) Indian manufacturing: productivity trends in pre- and post-reform periods. Economic and Political Weekly 37 (46/47): 4966-68.
Goldar BN, Kumari A (2003) Import liberalization and productivity growth in Indian manufacturing industries in the 1990s. The Developing Economies XLI-4: 436-60.
Griliches Z (1979) Issues in Assessing the Contribution of R&D to Productivity. Bell Journal of Economics 10: 92–116.
Hall BH, Mairesse J (1995) Exploring the relationship between R&D and productivity in French manufacturing firms. Journal of Econometrics 65(1): 263-293.
Holtz-Eakin D (1992) Private sector productivity and the productivity puzzle. NBER Working Paper 412.
Holtz-Eakin D (1994), Public-Sector Capital and the Productivity Puzzle, Review of Economics and Statistics 76: 12–21.
Hossain MA, Karunaratne ND (2004) Trade liberalization and technical efficiency: evidence from Bangladesh manufacturing industries. The Journal of Development Studies 40 (3): 87-114. Hu Q, Plant R (2001) An Empirical Study of the Causal Relationship between IT Investment and Firm Performance. Information Resource Management Journal 14 (3): 15-26.
Hulten CR, Schwab RM (1991) Public capital formation and the growth of regional manufacturing industries. National Tax Journal 44 (4): 121-34.
Hulten CR, Bennathan E, Srinivasan S (2006) ‘Infrastructure, externalities, and economic development: a study of the Indian manufacturing industry. The World Bank Economic Review 20 (2): 291-308.
Jorgenson D (1991) Fragile Statistical Foundations: The Macroeconomics Of Public Infrastructure Investment. American Enterprises Institute Discussion Paper, Feb.
Kathuria V, Raj R S N, Sen K, (2010) Organised versus Unorganised Manufacturing Performance in the Post-Reform Period, Economic and Political Weekly 45: 55-64.
Kamps C (2006) New Estimates of Government Net Capital Stocks for 22 OECD Countries 1960–2001. IMF Staff Papers 53: 120–150.
Kumar S (2006) A decomposition of total productivity growth: a regional analysis of Indian industrial manufacturing growth. International Journal of Productivity and Performance Management 55 3/4:311-31.
Lichtenberg FR, Siegal D (1989) The Impact of R&D Investment on Productivity. New Evidence using linked R&D-LR&D Data, NBER Working Paper 2901.
Lucas RE (1988) On the mechanics of economic development planning. Journal of Monetary Economics 22(1): 3-42.
Mitra A, Varoudakis A, Ve ´ganzone `s-Varoudakis MA (2002) Productivity and technical efficiency in Indian States’ manufacturing: the role of infrastructure, Economic Development and Cultural Change 50: 395-426.
Munnell AH (1990a) Why Has Productivity Growth Declined? Productivity and Public Investment. New England Economic Review (January/February), 2–22.
Munnell AH (1990b) How Does Public Infrastructure Affect Regional Economic Performance? New England Economic Review (September/October), 11–32.
Narayan S (2006) Trade-Off Between Government Deficit and Expenditure on Social Infrastructure. ISAS Insights No. 13, Institute of South Asian Studies, National University of Singapore.
Natarajan R, Duraisamy M (2008) Efficiency and productivity in the Indian unorganized manufacturing sector: did reforms matter? International Review of Economics 55(4): 373-399. Parham D, Roberts P, Sun H (2001) Information Technology and Australia's Productivity Surge. Productivity Commission staff research paper, Canberra, Australia, 2001.
Pedroni P (1999) Critical values for cointegration tests in heterogeneous panels with multiple regressors. Oxford Bulletin of Economics and Statistics S1 (61): 653-70.
Pedroni P (2000) Fully modified OLS for heterogeneous cointegrated panels, in B. Baltagi and C.D. Kao (Eds), Advances in Econometrics, Nonstationary Panels, Panel Cointegration and Dynamic Panels, Elsevier Science, New York, NY: 93-130.
Pedroni P (2001) Purchasing power parity in cointegrated panels. The Review of Economicsand Statistics 83: 727-31.
Planning Commission (2006) Towards Faster and More Inclusive Growth, An Approach to the 11th Five Year Plan, Planning Commission, Government of India.(downloaded from http://planningcommission.nic.in/plans/planrel/apppap_11.pdf).
Romer PM (1986) Increasing returns and long-run growth. Journal of Political Economy 94 (5): 1002-37.
Sachs J, Warner A (1995) Economic Reform and the Process of Global Integration. Brookings Papers on Economic Activity 1, 1-95, Washington. DC.