Lire
la seconde partie
de la thèse
Chapter 7
Chapter
7
Characterization of
Scaffolds for Calcified
Tissue Engineering
In this chapter, we discuss on different fillers and adjuvant to be used to produce scaffold for bone regeneration. The purpose of the fillers is to increase the mechnical properties of the scaffold, while adjuvant will be used to facilitate foaming process. We present the results obtained with systems consisting of different composite constituted by polylactides and Sr-tricalcium phosphates. The preparation and characterization of fillers and adjuvant is described in detail. The objectives of this chapter are to precise the influence of incorporating a mineral phase or/and wax as porogen agent by either simple mixing or co-grinding, on the distribution of pores processed by scCO2, to characterize foaming properties. The
percentage of mineral phase and co-grinding time influence on the scaffold will be elaborated step wise. The morphologies of the porous scaffold are also analyzed in detail.
1 Characterization of Composites
1.1 Fillers and Adjuvant
In medical applications, bone graft substitutes include metals, ceramics, polymers and composites. Each of these has its own advantages and pitfalls. Ceramics are commonly used for specific application where minimum load bearing strength is needed while metals are used in load-bearing applications. Among ceramics, calcium phosphate is extensively used as bone fillers to heal small defects and these materials are also of prime choice as scaffold for bone tissue engineering for their known osteo-inductive capacity in ectopic sites and possess good cell adhesion properties [Yuan et al., 2001]. Normally the percentage of fillers in polymer matrix is limited depending upon the required properties of the end products and its applications in the body. In our study, we have used amorphous tri-calcium phosphate and -tricalcium phosphate as fillers. The purpose of using these fillers is to enhance the structural properties of the scaffold. Both amorphous tricalcium phosphate and -tricalcium phosphate will be used with variable percentages so that optimal properties of the composite scaffold can be achieved for bone regeneration.
Chapter 7. Characterization of Scaffolds for Calcified Tissue Engineering
1.1.1 Sr Calcium Phosphate
1.1.1.1 Synthesis and Characterization of Calcium Phophates
The synthesis of amorphous tri calcium phosphate(ATCP) results of a double decomposition reactionbetween calcium nitrate and ammonium phosphate:
9 Ca(NO3)2.4H2O + 6 (NH4)2HPO4 + 6 NH4(OH) → 3Ca3(PO4)2 + 18 NH4NO3 + 42 H2O (7.1)
This reaction takes place in conditions of high basicity avoiding the presence of metal pollutants such as Mg+2 and Cl−. The steps taken to optimize the precipitation of amorphous calcium phosphate powders until finals are as follows.
To prepare solution A, we have put Ca(NO3)2 calcium nitrate (41.3 grams) and Sr(NO3)2
strontium nitrate (4.14 grams) into a one liter Erlenmeyer and added water (550 ml) to dissolve them. For solution B, we have weighted NH4(H2PO4) di-ammonium phosphate (27.3 grams) in a three liters
Erlenmeyer and added water (1300 ml).
For the filtration system, we have prepared three Büchner funnels connected to vacuum vials and vacuum system. Just before precipitating, we have added concentrated NH4(OH) ammonia solution (40 ml)
in each vial. Rapidly we have poured solution A into solution B and agitated, filtered immediately and distributed the suspension evenly in the three filtration systems. We have washed the precipitate on each system with 2 liters of water containing 5 ml of concentrated ammonia solution per liter. At the end, we have added 250 ml of distilled water to remove the ammonia solution. The precipitate was immediately Lyophilized for 2 days at following conditions: T < − 50°C and P < 0.120 mbar.
With this procedure, we prepared two samples because the tri-calcium phosphate (TCP) commercial sales were not pure enough for our application and did not contain any Sr+2 ions. So we decided to synthesize our own TCP from the ATCP. About 22 g were obtained for each product. For the sample of the ATCP, a small fraction (1 g) was calcined at 900°C in order to analyze the composition and crystallinity by FTIR. The second sample was completely burned at 900°C. In a first test, calcination was carried out overnight and the result was a powder composed of relatively large particles, which highlights the sintering of particles during calcination. To avoid sintering and obtain a finer powder easier to disperse in our polymer matrix, a second test was performed. This time, calcination was performed for 1 h and it was checked by FTIR that the conversion of amorphous calcium triphosphate to the beta phase was complete. The powder was stored in a freezer until use.
1.1.1.2 Calcium Phosphate Characterization
The samples have been checked by X-ray diffraction (for the Ca/P determination, and after heating the samples at 900°C for 2 hours) and by FTIR (for verifying the presence of P2O7
-4
pyrophosphate groups). In our case, all samples are amorphous strontium tri-calcium phosphate (ATCP)Sr (cf. Figure 7.1
and Figure 7.2).The peak positions obtained in the FTIR analysis of two samples of amorphous tricalcium phosphate are reported in Table 7.1. The broad lines at 1650 and around 3400 can be assigned to water molecules attached to the amorphous phase.
Table 7.1: Position of resulting bands in the FTIR analysis.
Position Peak Position Peak
1 559.5 2 1039.3 3 1652.8 4 3396.0
Chapter 7. Characterization of Scaffolds for Calcified Tissue Engineering
Figure 7.1: IR absorption spectrum of amorphous tricalcium phosphate (ATCP) doped with 10% Sr.
In the literature [Elliott, 1994], we can find for the family of phosphates the characteristic wavelength or place where the peaks are as follows (cf. Table 7.2).
Table 7.2: Position of bands in FTIR for amorphous calcium phosphate (ACP).
Vibration modes of PO4 Group (cm
-1
)
ν1 ν2 ν3 ν4
966 475 1020-1120 609-574
Thermal treatment of the low-temperature phases (ATCP)Sr in air at 900°C for several (24) hours
does indeed lead to the formation of -(TCP)Sr and this is a way to prepare this phase with high purity. When
TCP’s Ca/P atomic ratio is not exactly 1.5, impurities appear. The main impurities, hydroxyapatite (Ca/P atomic ratio above 1.5) and -calcium pyrophosphate (corresponding to a Ca/P atomic ratio under 1.5), can be detected, by XRD and FTIR spectroscopy respectively (cf. Figure 7.2).
Figure 7.2: IR absorption spectrum of amorphous calcium phosphate (ACP) doped with 10% Sr after
Chapter 7. Characterization of Scaffolds for Calcified Tissue Engineering
In addition to the peaks of phosphate ions in, un-calcined samples’ peaks can be found resulting from carbonate and nitrate ions even in the case where the washing of the precipitate is inadequate. These peaks would appear at a wavelength between the values given in Table 7.3. The absence of the peaks,OH and water, in our spectra testifies for the purity of our sample.
Table 7.3: Position of bands in FTIR for other groups.
Position of bands in FTIR
Carbonate 1660 Nitrate 1320 1480
Figure 7.3: IR absorption spectrum of tricalcium phosphate doped with 10% Sr after 2 hours of calcination.
We have checked on X-ray diffraction patterns that no lines due to hydroxy apatite were found. The FTIR spectrum (cf. Figure 7.2 and Figure 7.3) is characteristic of -Tricalcium phosphate and no pyrophosphate impurities were detected.
Table 7.4: Position of bands in FTIR for pyrophosphate.
Pyrophosphates P2O7-4 vibration modes (cm-1)
Stretching (PO3) asymetric 1121−1141
Stretching (POP) asymetric 725−728
If we compare our experimental data with the literature [Combes and Rey, 2010], we can conclude the samples prepared, correspond to pure amorphous stroncium calcium phosphate with a (Ca+Sr)/P ratio of 1.5 (cf. Table 7.4)
1.1.1.3 Calcium Phosphate Granulometry
Size distributions of amorphous (ATCP) tricalcium phosphate doped with 10% Sr before and after calcination (TCP) are presented in Figure 7.4. A very large distribution is observed for TCP(sr) ranging
from 1 to 800 µm. Two peaks are visible for crystallized TCP(sr) depicting two types of particles ranging
Chapter 7. Characterization of Scaffolds for Calcified Tissue Engineering
Calcium Phosphate : Granulometry
Particle Size(m) 0.01 0.1 1 10 100 1000 10000 Volume (%) 0 2 4 6 8 TCP(sr) ATCP(Sr)
Figure 7.4: Particles size of two different tricalcium phosphates analyzed by granulometry.
1.2 Adjuvant: Porogen Agent
Addition of calcium phosphate as filler in polymer matrix reduces the sorption of CO2 in the
polymer during the foaming process. To try and increase the solubility of CO2 in the polymer matrix and
making it more plasticize to facilitate pore generation wax has been added as foaming agents. It is expected that wax will be evacuated during the foaming process.
1.2.1 Industrial Waxes
Three samples have been used in the formulation as a pore foaming agent. The first wax (sample labeled A), was graciously given by Esprit composite® (reference TERHELL 907) and the two others furnished by Sasol Wax® (C8007 P606 and H106 1036 referenced in this work as C80 and H1). They have been first analyzed by DSC and Thermogravimetry. As example we present on Figure 7.5, the thermograms and the degradation curve corresponding to the sample TERHELL 907. Other DSC and thermogravimetric curves have been reported in Annex A-3 (cf. Figure A-3.1 and Figure A-3.2)
Chapter 7. Characterization of Scaffolds for Calcified Tissue Engineering
The thermodynamic transitions and thermal properties of three waxes are reported on Table 7.5.
Table 7.5: Thermodynamics transitions and thermal properties of the waxes. Wax Type 1st Scan 2nd Scan degradation onset (°C) Mass Loss (%) During Degradation Tonset (°C) TMax (°C) HM (J.g-1) Tonset (°C) TMax (°C) HM (J.g-1) A TERHELL (907) 38.2 42.0 57.2 57.6 186.1 192.1 34.7 49.2 57.2 54.5 187.8 146.3 143 99.81 B (C80) 93.0 96.7 242.8 72.2 87.6 235.4 208 99.41 C (H1) 104.7 111.7 279.0 72.4 92.5 259.1 211 100 1.2.2 Thermal Degradation
As shown on the Figure 7.6, the degradation of the waxes is complex and curves present generally in two steps. Moreover, the melting transitions are always preceded by a departure of small molecules around 100°C.
Figure 7.6: TGA curve of the wax-A (907).
2 Experiments on Polylactides/Tri-calcium Phosphate Scaffolds
2.2 Experiments on Polylactides/Tri-calcium Phosphate
First foaming experiments have been performed on three different polylactides: PLGA85:15 (PLG
8531), PLGA50:50 (PLG 8523), which are semi crystalline and PL,DLA (PABR-L 68) which is amorphous.
The conditions for the Taguchi’ experimental design, are reported on the Table 7.6. It was developed 3 sets of 9 samples of 200 mg each. In this case, only the saturation pressure was changed and three levels of pressure were considered for each sample. As the Tg of PLGA85:15 and PL,DLA is ~55
o
C and that of, PLGA50:50 ~ 47
o
C, so it was decided to adopt a temperature of 50oC for foaming.
PLGA85:15 was ground in the knife cutter grinder and final powder obtained passed through a 500
µm mesh sieve. The pellets were made as per prescribed conditions. However, after making pellets, they were still erosive on handling. Pellets 1- 3 were again prepared by wet method using acetone. While samples 4-9 were used as solid pellets. The ratio of ATCP(sr) and βTCP(sr) in the composite blend was 5 or 10 %.
Chapter 7. Characterization of Scaffolds for Calcified Tissue Engineering
Table 7.6: Levels selected for each parameter of the scaffold and foaming process with supercritical CO2 at
(Tsat = 50°C, dP/dt = 3 bar/min and tsat = 20 min).
Polymer Type Sample Polylactide βTCP(sr) ATCP(sr) Psat (bars)
PLGA85:15 (PDLG 8531) P1~3 90 0 10 100,200,300 P4~6 90 5 5 100,200,300 P7~9 90 10 0 100,200,300 PLGA50:50 (PLG 8523) P10~12 90 0 10 100,200,300 P13~15 90 5 5 100,200,300 P16~18 90 10 0 100,200,300 PL,DLA (PABR L 68) P19~21 90 0 10 100,200,300 P22~24 90 5 5 100,200,300 P25~27 90 10 0 100,200,300
The geometric porosity of the resulting foams was deduced from the procedure given in chapter 4. SEM micrographs were obtained for the foams of the three copolymers at each condition to analyze the pore size. Micrographs of PLGA50:50 and PL,DLA (PABR L 68) are presented in Figure 7.7 and Figure 7.8
respectively. As PLGA85:15 (PLG 8531) is highly crystalline, we did not succeed in producing foams. After
foaming process pellets of PLGA85:15 (PLG 8531) were turned into powder like material. Pellet was changed
into tiny spherical balls and was difficult to handle for SEM micrograph analysis.
PLGA50:50 +10% ATCP(sr) PLGA50:50 +5% ATCP(sr)+5% TCP(sr) PLGA50:50 + 10% TCP(sr)
Psat = 100 bars (100×) Psat = 100 bars 250×) Psat = 100 bars (250×)
Psat = 200 bars (250×) Psat = 200 bars (250×) Psat = 200 bars (250×)
Psat = 300 bars (250×) Psat = 300 bars (250×) Psat = 300 bars (250)
Figure 7.7: Micrographs of PLGA85:15 (8523) + tricalcium phosphate processed at scCO2 conditions-
Tsat 50°C, tsat 20 min, dP/dt 3bar/s and varying Psat.
The reason that PLGA
85:15 (PLG 8531) did not produced foam is because if its high crystallinityChapter 7. Characterization of Scaffolds for Calcified Tissue Engineering
PL,DLA + 10% ATCP(sr) PL,DLA + 5% ATCP(sr)+ 5% TCP(sr) PL,DLA + 10% TCP(sr)
Psat = 100 bars (100×) Psat = 100 bars 250×) Psat = 100 bars (250×)
Psat = 200 bars (250×) Psat = 200 bars (250×) Psat = 200 bars (250×)
Psat = 300 bars (250×) Psat = 300 bars (250×) Psat = 300 bars (250)
Figure 7.8: Micrographs of PL,DLA+ tricalcium phosphate processed at scCO2 conditions-
Tsat 50°C, tsat 20 min, dP/dt 3bar/s and varying Psat.
2.3 Analysis of Experiments on Polylactides/Tri-calcium Phosphate
Experiments were done by changing the percentages of the tricalcium phosphate in the polymer matrix. ATCP and TCP were varied from 0 to 10 % to see the effect on the scaffold. Equivalent pore diameter obtained by SCION® image analysis and geometric porosities only for PLGA50:50 and PL,DLA
polymer wax blend are reported on Table 7.7.
Table 7.7: PLGA50:50 and PL,DLA Foams pore data with different % of tricalcium phosphate.
Foam No. ScCO2Condition Polymer with Composite Composition PLGA50:50 PL,DLA
[Tsat-Psat-tsat-dP/dt]
Pore Diameter de(m) Geometric Porosity (%)) Pore Diameter de(m) Geometric Porosity (%) 1 [50-100-20-3] 10% ATCP(sr) 100 87.9 40 60.6 2 [50-200-20-3] 10% ATCP(sr) 60 75.3 30 44.8 3 [50-300-20-3] 10% ATCP(sr) 50 81.3 80 53.2 4 [50-100-20-3] 5% ATCP(sr)+5% TCP(sr) 20 88.3 50 68.2 5 [50-200-20-3] 5% ATCP(sr)+5% TCP(sr) 15 87.1 30 38.0 6 [50-300-20-3] 5% ATCP(sr)+5% TCP(sr) 10 88.3 40 57.8 7 [50-100-20-3] +5% TCP(sr) 100 87.8 60 77.3 8 [50-200-20-3] +5% TCP(sr) 20 98.4 20 50.1 9 [50-300-20-3] +5% TCP(sr) 10 90.3 10 56.7
A comparison of pore diameter for each polymer shows that as the saturation pressure increases, micro pores gradually decrease. The results obtained show that the pore size decreases with increasing saturation pressure; macrospores were only obtained for a pressure of 100 bars. According to Tai et al.
Chapter 7. Characterization of Scaffolds for Calcified Tissue Engineering
[2007] the diffusion coefficients and equilibrium concentration of CO2 in PLGA increases with pressure in a
nearly linear relationship. In addition, greater pressure can cause increment of the dissolution of CO2 and
consequently the glass transition temperature decreases. For these reasons, at higher pressures, the amount of CO2 incorporated into the polymer increases and yet the material is supersaturated when depressurizing the
system. The result is then a nucleation density of larger pore size is low.
The crystallinity of PLGA85:15 (8531) and PLGA50:50 (8523) is respectively 26.8% and 18.4% while
PL,DLA is amorphous. The porosity obtained for PLGA85:15 8531 is the lowest and apparently no pores were
produced in the foams. As for PLGA50:50 8523 which is less crystalline the porosity is higher than for
PLGA85:15 8531. The two poly(L-lactide-co-glycolide) which contains only L-lactide behaves like
semi-crystalline material, thus due to the presence of crystal lattice sorption of CO2 is less, leading to low
solubility and swelling hence producing foams with less pore size. While in PL,DLA contain both L and D
lactide with the ratio of 88:12. In PL,DLA polymer due to more D-lactide as compared to PLGA85:15, the
sorption and swelling of CO2 in polymer is more so the porosity and pore diameter should be more than the
two Poly(L-lactide-co-glycolide) as also investigated by Pini et al. [2008], Liu and Tomasko [2007],
Oliveira et al. [2006]. The results obtained by these authors indicate that, CO2 is slightly more soluble in
polylactide containing less percentage of L-lactide in the polymer. In our case PL,DLA possesses 88% of
L-Lactide ratio as compared to Poly(L-lactide-co-glycolide). In addition, if one compares the porosity as a function of the filler ratio 0-10% (ATCPsr / TCPsr), it is obvious that the highest porosities were obtained
for the Sr-tricalcium phosphate. The behaviour of the filler composed by tricalcium phosphate and amorphous presents an intermediate behaviour.
3 Foams of Polylactides/Calcium Phosphates Blends and Composites
3.2 Experiments on PLA/Waxes Scaffolds
3.2.1 Preliminary Experimentation with Wax as Porogen Agent
The aim of these studies was to try and increase the pore diameter of PL,DLLA foams by adding a
porogen agent in the formulation. Indeed, in previous studies, dry and wet methods were used to produce PL,DLLA foams with larger pore diameter and porosity but results were not still appropriate. A porogen agent
(wax), being apolar in nature, has been added to the polymer to facilitate CO2 sorption thus trying to increase
the possibility of pore generation. In that way, 36 pellets containing wax manually blended with polymer were manufactured with the manual press, as described by the procedure in chapter 4, at following process conditions: T = 60°C, P = 150 bars and t = 20 min. Blends of PLD,LLA polymer and different waxes (A, B or
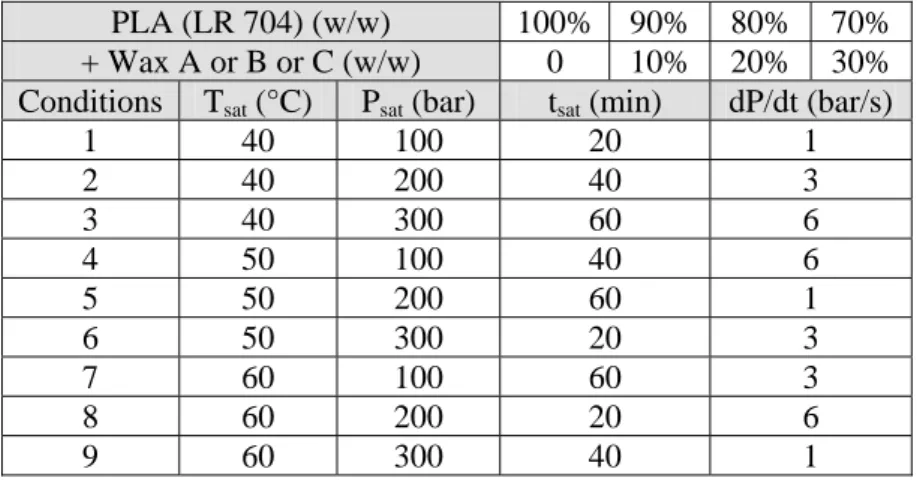
C) with the four mass ratios and were foamed with conditions as reported in Table 7.8.
Table 7.8: Mass ratio of polymer and different waxes and Taguchi’ plan (L9) for polymer-wax blend foams.
PLA (LR 704) (w/w) 100% 90% 80% 70% + Wax A or B or C (w/w) 0 10% 20% 30% Conditions Tsat (°C) Psat (bar) tsat (min) dP/dt (bar/s)
1 40 100 20 1 2 40 200 40 3 3 40 300 60 6 4 50 100 40 6 5 50 200 60 1 6 50 300 20 3 7 60 100 60 3 8 60 200 20 6 9 60 300 40 1
Chapter 7. Characterization of Scaffolds for Calcified Tissue Engineering
3.2.2 SEM Analysis of Foams
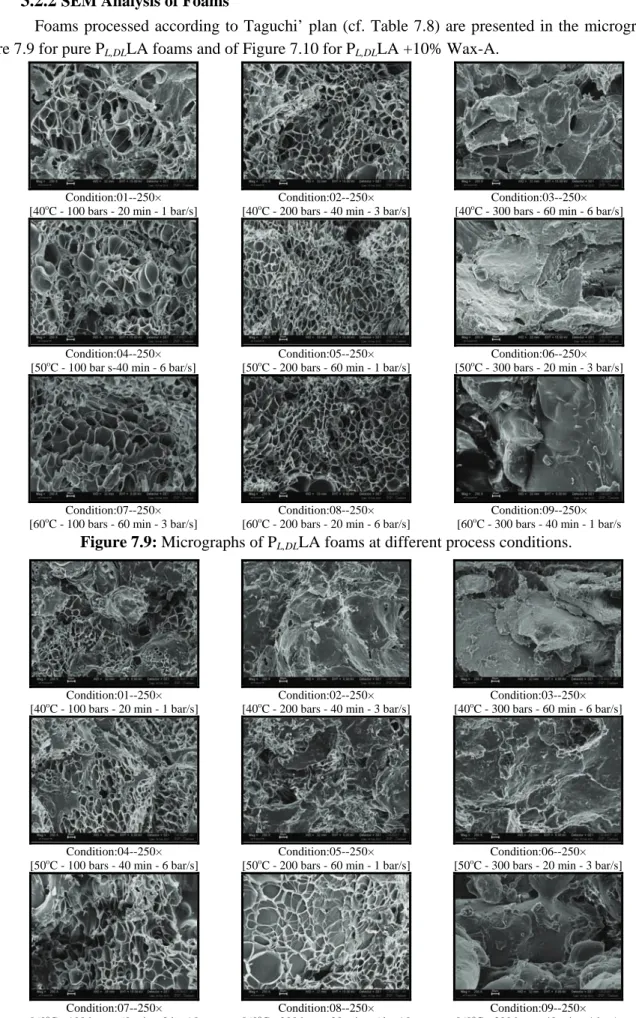
Foams processed according to Taguchi’ plan (cf. Table 7.8) are presented in the micrographs of Figure 7.9 for pure PL,DLLA foams and of Figure 7.10 for PL,DLLA +10% Wax-A.
Condition:01--250× [40oC - 100 bars - 20 min - 1 bar/s]
Condition:02--250× [40oC - 200 bars - 40 min - 3 bar/s]
Condition:03--250× [40oC - 300 bars - 60 min - 6 bar/s]
Condition:04--250× [50oC - 100 bar s-40 min - 6 bar/s]
Condition:05--250× [50oC - 200 bars - 60 min - 1 bar/s]
Condition:06--250× [50oC - 300 bars - 20 min - 3 bar/s]
Condition:07--250×
[60oC - 100 bars - 60 min - 3 bar/s] [60oC - 200 bars - 20 min - 6 bar/s] Condition:08--250× [60oC - 300 bars - 40 min - 1 bar/s Condition:09--250×
Figure 7.9: Micrographs of PL,DLLA foams at different process conditions.
Condition:01--250×
[40oC - 100 bars - 20 min - 1 bar/s] [40oC - 200 bars - 40 min - 3 bar/s] Condition:02--250× [40oC - 300 bars - 60 min - 6 bar/s] Condition:03--250×
Condition:04--250× [50oC - 100 bars - 40 min - 6 bar/s]
Condition:05--250× [50oC - 200 bars - 60 min - 1 bar/s]
Condition:06--250× [50oC - 300 bars - 20 min - 3 bar/s]
Condition:07--250×
[60oC - 100 bars - 60 min - 3 bar/s] [60oC - 200 bars - 20 min - 6 bar/s] Condition:08--250× [60oC - 300 bars - 40 min - 1 bar/s Condition:09--250×
Chapter 7. Characterization of Scaffolds for Calcified Tissue Engineering
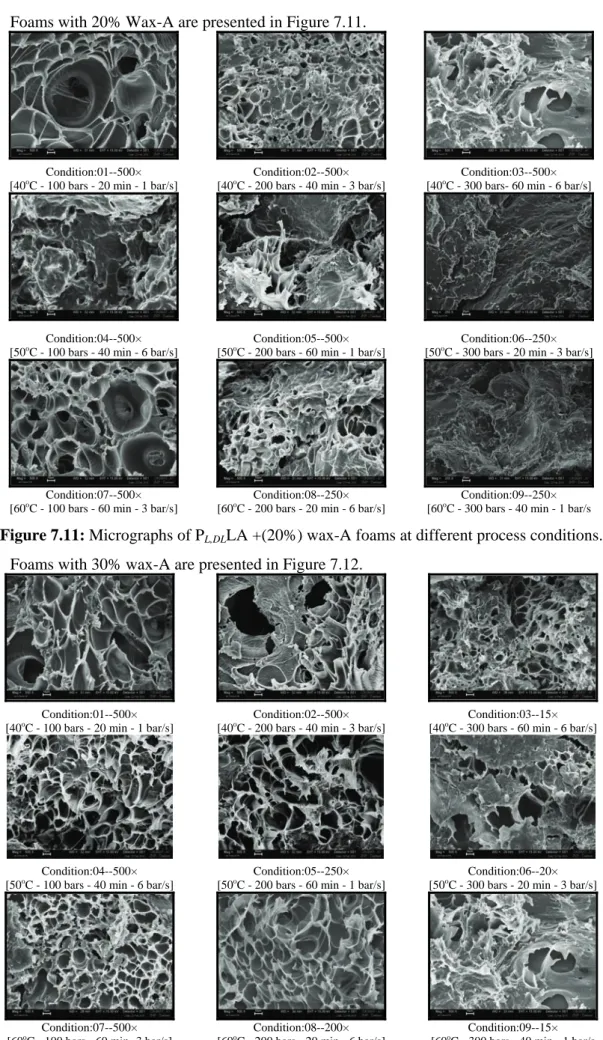
Foams with 20% Wax-A are presented in Figure 7.11.
Condition:01--500× [40oC - 100 bars - 20 min - 1 bar/s]
Condition:02--500× [40oC - 200 bars - 40 min - 3 bar/s]
Condition:03--500× [40oC - 300 bars- 60 min - 6 bar/s]
Condition:04--500×
[50oC - 100 bars - 40 min - 6 bar/s] [50oC - 200 bars - 60 min - 1 bar/s] Condition:05--500× [50oC - 300 bars - 20 min - 3 bar/s] Condition:06--250×
Condition:07--500× [60oC - 100 bars - 60 min - 3 bar/s]
Condition:08--250× [60oC - 200 bars - 20 min - 6 bar/s]
Condition:09--250× [60oC - 300 bars - 40 min - 1 bar/s
Figure 7.11: Micrographs of PL,DLLA +(20%) wax-A foams at different process conditions.
Foams with 30% wax-A are presented in Figure 7.12.
Condition:01--500× [40oC - 100 bars - 20 min - 1 bar/s]
Condition:02--500× [40oC - 200 bars - 40 min - 3 bar/s]
Condition:03--15× [40oC - 300 bars - 60 min - 6 bar/s]
Condition:04--500× [50oC - 100 bars - 40 min - 6 bar/s]
Condition:05--250× [50oC - 200 bars - 60 min - 1 bar/s]
Condition:06--20× [50oC - 300 bars - 20 min - 3 bar/s]
Condition:07--500× [60oC - 100 bars - 60 min -3 bar/s]
Condition:08--200× [60oC - 200 bars - 20 min - 6 bar/s]
Condition:09--15× [60oC - 300 bars - 40 min - 1 bar/s
Chapter 7. Characterization of Scaffolds for Calcified Tissue Engineering
There was not an effective change in pore size by increasing the percentage of wax. All these foams were processed according to Taguchi’ plan. In Majority of the foams the pore size was 5 to 25m and were elongated, hetrogeneous and irregular in shape. Micrographs of foams PL,DLLA +30% wax-B and PL,DLLA
+20% wax-C are presented in Annex-A-3, (cf. Figure A-3.3 and Figure A-3.4)
3.2.3 Effect of Wax on the Equivalent Pore Size and Geometric Porosity
The equivalent pore diameter and geometric porosity of the polymer and polymer blend foams are presented in Table 7.9 and Table 7.10 respectively. The values highlighted and underlined represent the maximum values for the respective foaming conditions.
Table 7.9: Equivalent pore diameter of pure PL,DLLA and polymer-wax blend foams.
Foam Nr.
Pure
PL,DLLA
PL,DLLA + 10% Wax PL,DLLA + 20% Wax PL,DLLA + 30% Wax
A B C A B C A B C m) m) m) m) m) m) m) m) m) m) 1 45 15 15 15 15 10 7 10 7 10 2 35 25 7 10 10 7 10 25 20 15 3 15 10 5 7 15 15 15 25 30 35 4 35 10 7 3 20 15 10 15 5 7 5 30 20 15 10 15 20 10 25 25 25 6 15 15 10 15 15 25 25 30 30 20 7 5 5 5 5 15 15 10 10 7 10 8 20 15 20 10 5 5 7 5 35 20 9 40 20 25 20 15 10 20 15 30 25
Table 7.10: Geometric porosity of pure PL,DLLA and polymer-wax blend foams.
Foam Nr.
Pure
PL,DLLA
PL,DLLA + 10% Wax PL,DLLA + 20% Wax PL,DLLA + 30% Wax
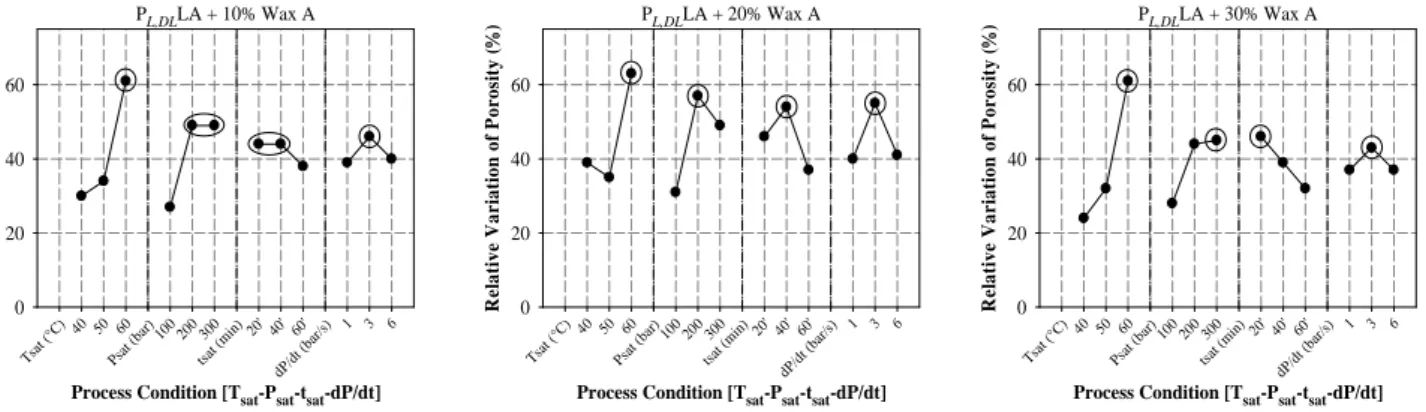
A B C A B C A B C (%) (%) (%) (%) (%) (%) (%) (%) (%) (%) 1 28.1 14.8 22.4 14.1 19.0 11.3 14.3 18.1 12.0 15.2 2 69.3 44.2 48.7 63.5 67.8 29.3 50.6 33.1 37.0 45.4 3 47.7 32.0 33.5 19.8 29.2 27.9 35.6 21.4 27.1 33.9 4 25.4 19.5 12.8 45.7 23.8 31.1 12.8 18.8 18.2 14.3 5 51.1 34.2 37.5 54.8 31.3 31.5 43.3 27.3 34.5 37.2 6 62.5 48.0 56.1 54.0 48.9 41.0 42.6 49.8 40.2 41.8 7 44.0 46.5 51.1 46.1 49.6 49.6 41.9 47.2 50.1 30.0 8 67.0 69.3 69.7 65.1 70.8 66.5 61.1 70.9 63.4 62.5 9 68.6 67.0 72.8 72.4 69.5 71.0 68.0 64.2 69.0 64.0 In all the polymer wax blend foams, equivalent pore diameter did not exceed 35m and maximum porosity was ~70%. Effect of each process parameter on equivalent pore diameter and porosity for polymer wax-A blend are presented in Figure 7.13 and Figure 7.14 respectively. Compairing the porosities of polymer/wax blend foams with pure PL,DLLA foams, in blend foam the values was always less. However in
condition 8 and 9, the porosities for all percentages of polymer/wax blends and pure polymer were almost same. The equivalent pore diameter for these two conditions was not same for pure polymer and polymer wax blend foams.
Examining Figure 7.13, one can observe that as the percentage of wax-A increases from 10% to 30% there is slight increase in the pore diameter of the polymer wax blend. Similar trend is seen for wax-B and wax-C blend. The decrease in trend of pore diameter for three types of wax is as follows.
Chapter 7. Characterization of Scaffolds for Calcified Tissue Engineering
The possible reason for this trend is due to the fact that melting point of wax-A < wax-B < wax-C. If the foam processing temperature is increased making it more closer to the melting point of the wax pore diameter can be increased.
PL,DLLA + 10% Wax A
Process Condition [Tsat-Psat-tsat-dP/dt]
Tsat (°C ) 40 50 60 Psat (b ar)100 200 300 tsat (m in) 20' 40' 60' dP/ dt (ba r/s) 1 3 6 E q ui val en t D iam et er de (m) 0 5 10 15 20 PL,DLLA + 20% Wax A
Process Condition [Tsat-Psat-tsat-dP/dt]
Tsat (°C ) 40 50 60 Psat (b ar)100 200 300 tsat (m in) 20' 40' 60' dP/ dt (ba r/s) 1 3 6 E q ui val en t D iam et er de (m) 0 5 10 15 20 PL,DLLA + 30% Wax A
Process Condition [Tsat-Psat-tsat-dP/dt]
Tsat (°C ) 40 50 60 Psat (b ar)100 200 300 tsat (m in) 20' 40' 60' dP/ dt (ba r/s) 1 3 6 E q ui val en t D iam et er de ( m) 0 5 10 15 20 25
Figure 7.13: Average effect of wax-A on the equivalent pore diameter for polymer wax blends.
PL,DLLA + 10% Wax A
Process Condition [Tsat-Psat-tsat-dP/dt] Tsa t (°C) 40 50 60 Psat (bar ) 100200300 tsat (min) 20' 40' 60' dP/d t (bar /s) 1 3 6 R el a ti ve V a ri ati o n of P o rosi ty ( ) 0 20 40 60 PL,DLLA + 20% Wax A
Process Condition [Tsat-Psat-tsat-dP/dt] Tsa t (°C) 40 50 60 Psat (bar ) 100200300 tsat (min) 20' 40' 60' dP/d t (bar /s) 1 3 6 R el a ti ve V a ri ati o n of P o rosi ty ( ) 0 20 40 60 PL,DLLA + 30% Wax A
Process Condition [Tsat-Psat-tsat-dP/dt] Tsa t (°C) 40 50 60 Psat (bar ) 100200300 tsat (min) 20' 40' 60' dP/d t (bar /s) 1 3 6 R el a ti ve V a ri ati o n of P o rosi ty ( ) 0 20 40 60
Figure 7.14: Average effect of wax-A on the geometric porosity for polymer wax blends.
Average effect of wax-B and wax-C on the equivalent pore diameter and porosity variation are presented in Annex A-3, Figure A-3.5 and Figure A-3.6. Optimum values of equivalent pore diameter and geometric porosity of the pure polymer and polymer-wax blend foams are summerized in Table 7.11.
Table 7.11: Pure PL,DLLA and polymer-wax blend equivalent pore diameter and porosity results.
Equivalent Pore Diameter (m) Geometric Porosity P(%)
Pure PL,DLLA [40
o
C-100 bars-20 min-1 bar/s] 45 [40oC-200 bars-40 min-3 bar/s] 69.3 10% wax-A [40oC-200 bars-40 min-3 bar/s] 25 [60oC-200 bars-20 min-6 bar/s] 69.3 10% wax-B [60oC-300 bars-40 min-1 bar/s] 25 [60oC-300 bars-40 min-1 bar/s] 72.8 10% wax-C [60oC-300 bars-40 min-1 bar/s] 20 [60oC-300 bars-40 min-1 bar/s] 72.4 20% wax-A [50oC-100 bars-40 min-6 bar/s] 20 [60oC-200 bars-20 min-6 bar/s] 70.8 20% wax-B [60oC-300 bars-20 min-3 bar/s] 25 [60oC-300 bars-40 min-1 bar/s] 71.0 20% wax-C [60oC-300 bars-20 min-3 bar/s] 25 [60oC-300 bars-40 min-1 bar/s] 68.0 30% wax-A [60oC-300 bars-20 min-3 bar/s] 30 [60oC-200 bars-20 min-6 bar/s] 70.9 30% wax-B [60oC-200 bars-20 min-6 bar/s] 35 [60oC-300 bars-40 min-1 bar/s] 69.0 30% wax-C [40oC-300 bars-60 min-6 bar/s] 35 [60oC-300 bars-40 min-1 bar/s] 64.0
Chapter 7. Characterization of Scaffolds for Calcified Tissue Engineering
For pure PL,DLLA, we can see that at lower pressure and saturation temperature, the pore size and
porosity obtained is comparitively high. Results from PL,DLLA +10% wax-A, 20% wax-C and 30% wax-B
produces foams of low porosity and pore diameter. Considering all the graphs in Figure 7.13 it can be deduced that the equivalent pore diameters for each polymer wax blend does not exceed ~35m.
The maximum values for all the polymer wax blends are obtained at the highest process temperature, 60oC. Values encircled in each graph present the optimum process parameter condition. The three tpyes of wax produced foams of proisity ranging from ~ 10 % to 70%. It was expected that wax being apolar in nature and is more inclined for solubility of scCO2 will improve the pore structure and
morphology. The three types of waxes used at low process temperatures produced pores with low diameter. However at higher temperatures, improvements in porosity and pore diameter were found. At higher temperature, the pore size was increased but not to a great extent. wax-A, wax-B and wax-C have melting temperature ~40, 93 and 104oC respectively. Forwax-A at higher temperature due to the melting of wax, the pore generation phenomenon was slightly increased hence pore diameter was slightly higher. Similarly at higher dP/dt, the pore diameter and porosity observed was also at minimum.
The possible reason for low pore size in the polymer –wax blend can be due to certain reasons. First of all, the polymer used was semi crystalline which itself produces low porosity and pore diameters as experimented earlier. Then the wax-B and C used had melting point ~100oC, which was not converted into semi molten state at 60oC hence there is less possibility of CO2 absorption at this temperature, minimizing
the chances of pore generation in the blend. Wax has affinity to absorb CO2 but as it does not have elastic
property so there are less chances of pore generation. The pore structure and morphology in all the foams obtained were heterogeneous. The pores were irregular, heterogeneous in size and mostly elongated.
3.3 Experiments on Polylactides/Tri-Calcium Phosphate/Wax Scaffolds
3.3.1 Effect of the Ratio of Wax on the Geometric Porosity and Equivalent Pore Size
Inspite of adding a porogen agent in PL,DLLA, there was not an appreciable increase in the pore
diameter. As PL,DLLA is semi-crystalline so it was replaced with an amorphous polymer poly(DL-lactic
co-glycolide). In the experiments with PL,DLLA/wax blend foams were processed at higher temperature 50 and
60oC. The melting point of wax is located between 40 and 100°C and as wax-A has lowest melting point so maximum pore diameter obtained was ~ 30 m. Hence to process foams with PLGA85:15/wax blends
process temperature was kept 45oC close to the melting temnperature of wax-A, secondly the Tg of
PLGA85:15, 43oC.
PLGA85:15 (RG-858 S) fine fibres were obtained by using the knife mill. These fine fibres were
then ground alone in the tumbling ball mill for 30 minutes. White flakes were obtained which were again ground in the knife mill to get powder. The filler rates (5% TCP and 5% amorphous ATCP dopped with Sr) have been maintained constant. As for wax, its ratio has been chosen as follows: 0, 1.5, 3, 5, 7 and 10%, the polymer serving as complement. However, two pressure values were implied. The two process conditions with their results are reported on Table 7.12. The conditions selected are Tsat 45°C, tsat 20 min,
dP/dt 3bar/s while Psat 100 and 120 bars. In most of the experimentations the optimized conditions for a
polymer in our system is Psat 120 bars, tsat 20 min, dP/dt 3bar/s and Tsat close to the value of polymer
Tg. We varied only one parameter to see its effect on the pore morphology.
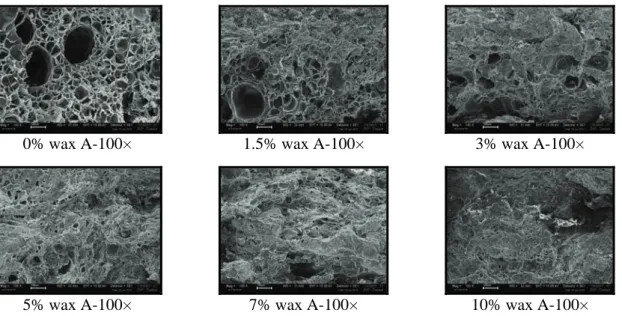
The micrographs of PLGA85:15+ 5% ATCP(sr) + 5% TCP(sr) co-ground and with differentratios of
Chapter 7. Characterization of Scaffolds for Calcified Tissue Engineering
0% wax A-100× 1.5% wax A-100× 3% wax A-100×
5% wax A-100× 7% wax A-100× 10% wax A-100×
Figure 7.15: Micrographs of foams obtained by simple mixing of polymer and wax and processed -
at [Tsat 45°C, Psat 120 bars, tsat 20 min, dP/dt 3bar/s].
0% wax A-100× 1.5% wax-100× 3% wax-100×
5% wax-100× 7% wax-100× 10% wax-100×
Figure 7.16: Micrographs of foams obtained by simple mixing of polymer and wax and processed
at [Tsat 45°C, Psat 100 bars tsat 20 min, dP/dt 3bar/s].
Table 7.12: Equivalent pore diameter and geometric porosity of foams of composite plus wax by simple
mixing processed at Tsat 45°C, tsat 20 min, and dP/dt 3bar/s. Foam
No.
5%ACP(sr) +5%TCP(sr) Psat 120 bars Psat 100 bars
+ Complement PLGA85:15 + % Wax A Pore Diameter de (m) Geometric Porosity (%) Pore Diameter de (m Geometric Porosity (%) 1 Pure PLGA 95 71.4 135 72.1 2 1.5% wax A 145 81.4 170 86.1 3 3% wax A 65 75.3 90 83.1 4 5% wax A 45 70.7 50 82.4 5 7% wax A 20 67.2 20 80.3 6 10% wax A 15 77.1 5 68.6
Chapter 7. Characterization of Scaffolds for Calcified Tissue Engineering
Changing the polymer from PL,DLLA to PLGA85:15 and reducing the percentage of porogen wax
improved the pore diameter and porosity of the composite scaffold. Reducing the pressure from 120 bars to 100 bars gives even better results. Pore diameter decreased as the percentage of wax increased. Maximum pore diameter was attained at 1.5% of wax with a porosity of 86%. From these results, it is obvious that increasing the amount of wax in the polymer blend decreases the pore growth thus forming foams of smaller diameter and less porosity. However only at 1.5% wax ratio in the blend produced higher pore diameter and higher porosity in comparison to polymer compsite blend without wax. Thus minor percentage of wax facilitates the pore generation phenomenon during foaming. With larger percentages of wax in the blend, no doubt the sorption of CO2 in the blend is increased but presence of wax in the blend do not faciliatate pore
generation.
3.3.2
Effect of Co-grinding Filler and PLGA on the Pore MorphologyTo achieve scaffold of higher mechanical properties, co-grinding is an effective phenomenon as it improves the properties of the product attained, discussed earlier in bibliography. Purpose of this study was to analyze the effect of co-grinding polymer with filler and see its effect on the processed foam. Wax was again added separately by simple mixing as a progen. PLGA85:15 + 5% ACP(sr) and 5% TCP(sr) were
co-ground in the tumbling ball mill for 30 minutes. Off white flakes were obtained which were further co-ground in knife mill for 30 sec to obtain powder of polymer matrix. This powder was passed through 800 mesh screen to separate larger particles and agglomerates. After adding additional amount of wax, 15 minutes of magnetic mixing was done. As for wax, its ratio has been chosen as follows: 0,1.5, 3, 5, 7 and 10%, the polymer serving as complement. The two process conditions with their results are reported on Table 7.13.
The micrographs of PLGA85:15+ 5% ATCP(sr) + 5% TCP(sr) co-ground and with differentratios of
wax for the two process conditions are presented in Figure 7.17 and Figure 7.18 respectively.
0% wax A-100× 1.5% wax A-100× 3% wax A-100×
5% wax A-100× 7% wax A-100× 10% wax A-100×
Figure 7.17: Micrographs of foams obtained by co-grinding polylactide and fillers processed at Tsat
45°C, Psat 120 bars, tsat 20 min and dP/dt 3 bar/s.
Compairing the results of foams produced at 120 bras and 100 bars , it can be seen that with higher percentages of wax (above 5%) there were not appreciable pores. With 1.5% of wax there were pores but not in appreciable size and quantity as in pure polymer foam.
Chapter 7. Characterization of Scaffolds for Calcified Tissue Engineering
0% wax A-100× 1.5% wax A-100× 3% wax A-100×
5% wax A-100× 7% wax A-100× 10% wax A-100×
Figure 7.18: Micrographs of foams obtained by co-grinding polylactide and fillers processed at
Tsat 45°C, Psat 100 bars, tsat 20 min and, dP/dt 3bar/s.
Table 7.13: Equivalent pore diameter and geometric porosity of foams of composite plus wax by
co-grinding processed at two saturation presures.
Foam No.
5%ACP(sr) +5%TCP(sr)
Tsat 45°C, Psat 120 bars
tsat 20 min, dP/dt 3bar/s
Tsat 45°C, Psat 100 bars
tsat 20 min, dP/dt 3bar/s
+ Complement PLGA85:15 + % wax A Pore Diameter de (m) Geometric Porosity (%) Pore Diameter de (m) Geometric Porosity (%) 1 0% wax A 25 68.4 40 74.7 2 1.5% wax A 40 72.2 50 77.2 3 3% wax A 25 64.5 30 66.1 4 5% wax A 20 56.4 10 62.7 5 7% wax A 5 52.3 5 61.4 6 10% wax A Nil 54.3 5 54.3
Purpose of cogrinding the polymer and filler was to elevate the mechanical properties of composite. Comaparing the results reported on Table 7.13, one can find that again foam generated without porogen produced pores with small diameter and less porosity as compared to 1.5% of wax-A blend. By adding wax-A till 1.5%, it facilitates pore generation but increasing the amount in blend decreases pore generation leading to reduced pore diameter and less porosity. Also there was decrease in the pore diameter and porosity as compared to the foams with similar composition but with simple mixing. Maximum pore diameter and porosity was obtained at Psat = 100 bars. Thus higher percentage of wax and co-grinding
phenomenon reduce the pore generation in a foam.
3.4 Complementary Experiments on PLGA
85:15/Tri-calcium Phosphate/Wax
Scaffolds
Previous results obtained from semi-crystalline poly(L-lactide-co-glycolide) composite produced foams with high porosity but low pore size compel us to use an amorphous poly(D,L-actides-co-glycolide)
PLGA85:15 (LG 858 S). The objective was to generate scaffold of higher porosity and large pore diameter so
an amorphous Poly(D,L-actides-co-glycolide) was replaced with semicrystalline one. PLGA85:15 is in fibrous
foam and before using it for further processing, it is knife milled and turned into fine fibres and then these fine fibres are ground in ball mill. From the ball mill, we get flakes which are finally knife milled again to
Chapter 7. Characterization of Scaffolds for Calcified Tissue Engineering
transfoam them into powder. The powder obtained is passed though series of sieves 250,400,500 and 600 mesh. Thus we get particles of polymers in 4 different ranges/category described as follows.
[PLGA85:15 particles< 250m] [250 < PLGA85:15 particles < 400m],
[400 < PLGA85:15 particles < 600 m] and [PLGA85:15 particles > 600 m]
Polymer blend will be made from these four categories of particles with 5 % ATCP(sr) and 5 %
TCP(sr). In our previous results co-grinding of the polymer and filler blend showed results wih lower values
of porosity and pore diameter, hence now simple mixing of polymer filler blend will be done. Higher percentage of wax also hinders generation of pores during foaming, so wax-A will be added with different ratios (0, 0.5 and 1 %). Blends of all the components, polymer particles+5 % ATCP(sr) and 5 % TCP(sr).+
wax were done for 15 minutes in a jar with a magnetic stirrer.
The detailed compositions of pellets are given in Table 7.14. For category [PLGA85:15 < 250m]
four pellets were processed to test them at different plates in the chamber. Similarly pellets were processed for category [250 < PLGA85:15 < 400m], [400 < PLGA85:15 < 600 m] and [PLGA85:15 > 600 m].
Table 7.14: Composition of pellets of different polymer particle size and with variable % of wax.
Powder Category 5 % ATCP(sr) + 5 % βTCP(sr) + Complement % PLGA85:15
Type < 250 μm [250 – 400 μm] [400 – 600 μm] 600 μm 1 90 90 90 90 % wax A 0 0 0 0 2 89.5 89.5 89.5 89.5 % wax A 0.5 0.5 0.5 0.5 3 89 89 89 89 % wax A 1 1 1 1
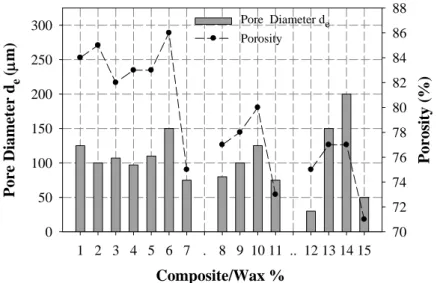
By using the hydraulic press with conditions P = 150 bars, T= 47oC, t = 20 min, 255 mg of powder was used to make each pellet and processed 15 pellets. The pore diameter and geometric porosity of the generated foams are tabulated in Table 7.15.
Table 7.15: Pore diameter of foams with different particle size and with variable % of wax. Foam No. 5%TCP(sr)+5%ATCP(sr) + % Wax A + Complement PLGA85:15 Pore Diameter de (m) Porosity (%) 1-4 0% wax A [PLGA85:15 < 250μm] 125, 100, 107, 97 84.2, 85.4, 81.8, 82.7 5 [250 < PLGA85:15 < 400μm] 125 83.2 6 [400 < PLGA85:15< 600μm] 150 85.7 7 [600 μm < PLGA85:15] 125 74.9 8 0.5% wax A [PLGA85:15 < 250 μm] 80 77.2 9 [250 < PLGA85:15 < 400μm] 100 78.4 10 [400 < PLGA85:15< 600 μm] 125 80.3 11 [600 μm < PLGA85:15] 75 72.8 12 1% wax A [PLGA85:15 < 250 μm] 30 75.2 13 [250 < PLGA85:15 < 400 μm] 150 77.1 14 [400 < PLGA85:15< 600 μm] 200 77.0 15 [600 μm < PLGA85:15] 125 71.4
Chapter 7. Characterization of Scaffolds for Calcified Tissue Engineering
1–PLGA85:15 < 250μm 2–PLGA85:15 < 250μm 3–PLGA85:15 < 250μm 4–PLGA85:15 < 250μm
5–250 μm < PLGA85:15 < 400μm 6–400 μm < PLGA85:15< 600μm 7–600 μm <PLGA85:15 8–PLGA85:15 < 250μm 9–250 μm < PLGA85:15 < 400μm 10–400 μm < PLGA85:15< 600μm 11–600 μm <PLGA85:15 12–PLGA85:15 < 250μm 13–250 μm < PLGA85:15 < 400μm –50× 14–400 μm < PLGA85:15< 600μm – 50× 15– [600 μm < PLGA85:15] Figure 7.19: Micrographs of foams containing different percentages of wax A.
From Figure 7.20 and the SEM micrographs (cf. Figure 7.19), one can find that by using polymer particles less than 250m the pore size generated in the foam is ~100m also for the particles>600m produced foam of low pore diameter. Particles between 400 and 600m generated comparatively larger pores. The porosity was ~ 84% except the last category fell to 75%. By adding 0.5% wax in the polymer matrix, there was apparently not much difference in the pore diameter however, the porosity was reduced for each category. By adding 1% wax increased the pore diameter in the category (250 < PLGA85:15 < 400μm)
and (400 < PLGA85:15< 600 μm) with reduction in porosity. Further investigation is required to study the
behaviour of particles and their effects on foaming. Thus, fine particles less than 250m and larger particles greater than 600m are not suitable for generating a scaffold of higher porosity and pore diameter neither with nor without wax. To study the effect of particle size of polymer on pore morphology further investigation can be done.
Chapter 7. Characterization of Scaffolds for Calcified Tissue Engineering
[90% PLGA85:15+ 5% TCP(sr)+5 %ACP(sr)+(x)% Paraffin ]
Composite/Wax % 1 2 3 4 5 6 7 . 8 9 10 11 .. 12 13 14 15 Pore Diameter d e ( m) 0 50 100 150 200 250 300 Porosity (%) 70 72 74 76 78 80 82 84 86 88 Pore Diameter de Porosity
Figure 7.20: Effect of particle size of polymer and different % of wax on foam pore diameter and porosity.
4 Conclusion
After characterizing fillers and adjuvant, foams were made by PL,DLLA mixed with three different
types of waxes. Due to higher percentages of waxes, results were not very appreciable. By altering the percentage of amorphous and TCP composites were made by using three different polymers. Then foams of PLGA85:15+ 5%ACP(sr) +5%TCP(sr) with variable percentages of wax (1 to 10%) by simple mixing and by
co-grinding were produced. As the melting point of wax-A is very low and it creates hindrance in producing pores in the polymer blend so its percentage in composite was reduced to 1.0 %. Finally, it was concluded that adding wax in composite blend did not facilitate pore generation in scCO2 foaming technique.
Chapter 8
Chapter
8
Optimization of Pore
Morphology of
Scaffolds for Calcified
Tissue Engineering
The purpose is to produce industrially applicable scaffolds for bone replacement. To produce a scaffold with optimum porosity, equivalent pore diameter and mechanical properties, PLGA and Sr-calcium phosphates blends will be used. Semi-industrial fabrication of porous composite scaffolds involves scale up production and we have studied the capability of the process to produce foams. Therefore, a major challenge for scaffold fabrication is to maintain mechanical strength with vital porous structure in addition to a specified composition. The objectives of this chapter are to precise the influence of incorporating a mineral phase by either simple mixing or co-grinding, on the distribution of pores processed by scCO2, to
characterize foaming properties and the mechanical properties of the resulting scaffolds.
1 Semi-industrial Production of Bone Scaffolds
The purpose for the following experiments was to produce industrially scaffolds for application in bone regeneration. In bone engineering, earlier studies by Hulbert et al., [1970] showed that a minimum pore size of 100 m was required to allow bone tissue ingrowth in ceramic scaffolds. Further investigations were carried out to understand the pore size requirement for bone tissue engineering. Although the optimal pore size varied with scaffold material and other parameters, such as tortuosity, the general consensus is that pore sizes (e.g., 100 m) may favour higher alkaline phosphatase activity and more bone formation [Karageorgiou and Kaplan, 2005b; Tsuruga et al., 1997b].
Cell transport and vascularization because of scaffold pore size can also affect the tissue types and tissue formation process in scaffolds. When bone morphogenetic proteins were loaded into honeycomb-shaped hydroxyapatite scaffolds to induce osteogenesis, it was found that smaller diameters (90–120 μm) induced cartilage formation followed by bone formation, whereas those with larger diameters (350 μm) induced bone formation directly [Kuboki et al., 2001]. The difference was likely caused by the different onset time of vascularization and cell differentiation.
Chapter 8. Optimization of Pore Morphology of Scaffoldss for Calcified Tissue Engineering
1.1 Matrix: Polylactides
1.1.1 Experiments with Different Polylactides
The aim of this design of experiments was to compare the effect of the nature and composition of polylactide on the porosity, pore size and pores size distribution of foams manufactured by scCO2 process.
Before further experimentations, we will test different polylactides of various glass transition temperature and LA/GA ratios. Also the effect of fillers will be taken into account. The polymers used for testing are stated as under in Table 8.1.
Table 8.1: Polymers with different Tg’s and LA/GA ratios.
S/N Polymer LA/GA Tg (
o
C) Degree of Crystallinity c Mvis
A PLGA85:15 (DL PLG)
Poly (D,L-lactide-co-glycolide) 85/15 50−55 Amorphous 18 943
B PLGA50:50 (RG 504)
Poly (D,L-lactide-co-glycolide) 50/50 46−50 Amorphous 14 756
C PLGA85:15 (LG 857 S)
Poly (L-lactide-co-glycolide) 85/15 57−63 Amorphous 396 495
Fillers were mixed manually to make a homogeneous blend. Pellets of pure polymers blend with 5% ATCP(sr) + 5% β TCP(sr) were processed by compression (P 150 bars,T 60°C, t 20 min,). Foams
for the pure polylactide and composite biomaterial were manufactured at Psat 100 bars, Tsat 50°C, tsat 20
min and dP/dt 3bar/s. The SEM images of foams obtained are presented in Figure 8.1. The micrographs are of different magnification because pore size varies largely. The equivalent pore size of pure Poly (lactide-co-glycolide) foams and composite foams are reported on Table 8.2.
Pure Polymer A-PLGA85:15 (DL PLG) (50×) Polymer A + 5% ATCP(sr) + 5% βTCP(sr) (250×)
Pure Polymer B-PLGA50:50 (RG 504) (25×) Polymer B + 5% ATCP(sr) + 5% βTCP(sr) (100×)
Pure Polymer C-PLGA85:15 (LG 857 S) (30×) Polymer C + 5% ATCP(sr) +5% βTCP(sr) (25×)
Figure 8.1:
Micrographs of pure polymer and polymer with filler foams processed at scCO
2 conditionTsat = 50 o
Chapter 8. Optimization of Pore Morphology of Scaffoldss for Calcified Tissue Engineering
Table 8.2: Pore size of polymers and polymer plus filler.
Polymer Pure Polymer Composite
de P (%) de P (%)
PLGA85:15 (DL PLG) 350 91% 60 81%
PLGA50:50 (RG 504) 260 88% 150 and 20 84%
PLGA85:15 (LG 857 S) No pore 44% No pore 32%
The SEM images reveal that the equivalent pore size of PLGA85:15 (DL PLG) is higher than with
PLGA50:50 (RG-504). No pore was observed in PLGA85:15 (LG 857S), It is probably linked to its higher value
of molecular mass and higher glass transition temperature (cf. Table 8.1). The two other polymers at Tsat =
50oC are in rubbery state while the third one is in a glassy state indicating that CO2 cannot penetrate and
consequently pores cannot be formed. All these reasons created hindrance to make a scaffold of negligible porosity and pore diameter at possessing conditions of Tsat = 50oC and tsat = 20 min.Adding a mineral phase
in each polymer, we observed a relative decrease in pore size and geometric porosity. By adding filler in the polymer, modification of polymer surface implies variation in the CO2 solubility. Addition of fillers also
stiffens the polymer and blocks the penetration of CO2. PLGA85:15 (LG 857S) having the maximum
molecular weight did not produce pores neither in pure state nor by adding mineral phase. It seems more easy to make foams with copolymers containing D,L-lactide than with copolymers containing only L-lactide as shown by Tai et al. [2007]. In the above two polymers where pores were formed, it was observed that in both cases they were open and closed and heterogeneous in size. Pores observed in the composite (PLGA50:50
(RG-504) + 5% ATCP(sr) + 5% TCP(sr)) were quite heterogeneous as compared to composite (PLGA85:15
(DL PLG) + 5% ATCP(sr) + 5% TCP(sr)). A decrease in the geometric porosity and equivalent pore size by
adding fillers can be attributed to the hindrance of CO2 sorption in the composite. 1.1.2 Polylactide with Higher D,L Contents
As previous results of different poly(lactide-co-glycolide) foams showed heterogeneous pore size another type of polymer (PLGA85:15 RG 858 S) was tried. It is a poly(D, L-lactide-co-glycolide) with 85% of
D,L lactide and low Tg. Initially it was in a fibrous form, so we changed its physical shape as the ultimate
goal was to mix the fillers with polymer and that is only possible if polymer is in powder or fine fibres form. To study the effect on pore size and porosity, 4 pellets for each fibrous and fine-fibrous were manufactured.
The grinding of fibres was done in the knife mill for 20 sec on/off mode and pellets were made as per procedure described earlier in chapter 4. The Tg of polymer PLGA85:15 (RG 858 S) is ~ 43oC so we
manipulated the foaming process above and below the Tg. The aim of these experimentations was to prove
that when a polymer is in a rubbery state, the solubility of supercritical CO2 increases and consequently so
do the pore size and the porosity. Keeping the temperature 5oC above the Tg of polymer produces optimum
porosity and pore diameter, inference draw from previous experimentations, four different saturation temperatures were selected. The optimized conditions obtained by previous experimentation for majority of poly (lactide-co-glycolides) were followed. The scCO2 conditions at which the foams were processed are Tsat
= 40/43/46/49oC, Psat = 100 bars, tsat =20 min, dP/dt =3 bar/s. We changed only the temperature keeping
other process parameters constant. Data of the pellets and foams obtained are presented in (c.f Table 8.3).
Table 8.3: Effect of polymer and process temperature on equivalent pore diameter and geometric porosity. Tsat (°C)
Fibre (few cm) Fine Fibres (2 − 4 mm)
de (m) P (%) de (m) P (%)
40 197 80.2 211 90.1
43 202. 84.3 234 91.4
46 216 88.9 249 92.7
Chapter 8. Optimization of Pore Morphology of Scaffoldss for Calcified Tissue Engineering
The micrographs of foams of non-ground fibres and ground fine fibres are presented in Figure 8.2. It is evident that in fine fibre polymer foams, there are more meso and macro pores compared to fibre polymer foam. It has been observed that there is gradual increase in the pore diameter and porosity in both cases, as the saturation temperature increases (cf. Table 8.3).
Fibre Foams Tsat=40 o C--(50×) Tsat=43 o C--(50×) Tsat=46 o C--(50×) Tsat=49 o C--(50×)
Fine Fibre Foam
Tsat=40 o C--(50×) Tsat=43 o C--(50×) Tsat=46 o C--(50×) Tsat=49 o C--(50×)
Figure 8.2: Micrographs of PLGA85:15 (RG 858 S) processed at Psat=100 bars, tsat =20 min and dP/dt =3 bar/s.
The pore diameter of fibre and fine fibre foams increased gradually as the temperature was increased. The effect to grind fibres is not significant for the geometric porosity and sligthly influent on the equivalent pore size. Compairing equivalent pore diameter for fine fibre polymer, it has highest values at 49oC operated temperature. The first three polymers used for the processing of foams had Tg ≥ 46
o
C, that is why at Tsat = 50
o
C PLGA85:15 (DL PLG) foam produced foam of maximum diameter and porosity. Adding
fillers reduced the pore diameter and porosity in polymer A and B because filler stiffen the polymer. The results obtained with PLGA85:15 (RG 858 S) were also appreciable because this polymer has the lowest Tg
value. So this polymer was preferred to be used for future experiments.
1.2 Effect of Polymer Particle Size on Foaming
After the fibres were ground in the ball mill, they turned into flakes, which were again ground in the knife mill to make fine powder with different particle size. The size distributions of all the samples are presented in Figure 8.3 and the mean particle diameter in each range is given in Table 8.4.
PLGA85:15 RG 858 S : Granulometry Particle Size(m) 0.01 0.1 1 10 100 1000 10000 Vo lume (%) 0 2 4 6 8 10 12 14 PLGA85:15< 125 m 125m < PLGA85:15 < 250m 250m < PLGA85:15 < 400m PLGA85:15 RG 858 S : Granulometry Particle Size(m) 0.01 0.1 1 10 100 1000 10000 Vo lume (%) 0 2 4 6 8 10 12 14 400m < PLGA85:15 < 500m 500m < PLGA85:15 < 600m 600m < PLGA85:15 < 800m
Chapter 8. Optimization of Pore Morphology of Scaffoldss for Calcified Tissue Engineering
A plan was made to do an extensive study to investigate the effect of the particle size of the ground polymer powder on the pore size of foams. The powder was passed through a set of six sieves (800, 600, 500, 400, 250 and 125 m). These sieves were placed on a vibrating stand for 5 minutes for complete screening. Powder collected from each sieve was utilized to make foam by scCO2 foaming. It can be seen
that the mean particle size increases gradually on each screen. The elongated particles in the mixture affect the mean particle size and the value is more than the larger sieve in a range.
Table 8.4:
Mean particles sizes of PLGA samples.
Mean Particle Size
PLGA85:15 Particle Ranges
1 2 3 4 5 6 Sieve Range < 125 μm [125-250μm] [250-400μm] [400-500μm] [500 600μm] [600-800μm] d50 99.7 207.7 425.1 557.0 702.8 868.1
1.2.1 Foaming of PLGA85:15 with Different Particle Size
Foams of pure PLGA85:15 were made with different particle sizes at two different conditions. SEM
images for both conditions [Tsat 48°C, Psat 100/120 bars, tsat 20 min, dP/dt 3bar/s] are presented in
Figure 8.4.
Foam--Psat=120 bars Foam--Psat=100 bars Foam--Psat=120 bars Foam--Psat=100 bars
Foam--Psat=120 bars Foam--Psat=100 bars Foam--Psat=120 bars Foam--Psat=100 bars
Foam--Psat=120 bars Foam--Psat=100 bars Foam--Psat=120 bars Foam--Psat=100 bars
Foam--Psat=120 bars Foam--Psat=100 bars
Figure 8.4: Comparison of micrographs of foams with different polymer particle size range processed at
Chapter 8. Optimization of Pore Morphology of Scaffoldss for Calcified Tissue Engineering
From the previous experiment, Tsat was increased from 45o to 48oC, so the first process condition
was Tsat 48°C, Psat 120 bars, tsat 20 min, dP/dt 3 bar/s and in the second condition, pressure was
reduced to 100 bars while the other operating conditions were kept constant.
Table 8.5: Pore size and porosity of PLGA foams with different particle size range for two scCO2
-conditions with different Psat 120 bars, or Psat 100 bars. Foam
No. Polymer Particle Size Range
Tsat48°C, tsat 20 min, dP/dt 3 bar/s
Psat 120 bars Psat 100 bars
de (m) P (%) de (m) P (%) 1 PLGA85:15< 125 μm 100 71.6 50 87.0 2 125 μm < PLGA85:15 < 250μm 150 83.2 150 91.4 3 250 μm < PLGA85:15 < 400μm 100 85.9 225 92.3 4 400 μm < PLGA85:15 < 500μm 75 84.2 200 91.6 5 500 μm < PLGA85:15 < 600μm 75 82.1 225 97.2 6 600 μm < PLGA85:15 < 800μm 50 77.1 150 89.4 7 800 μm < PLGA85:15 75 75.8 125 86.0
PLGA85:15 of Different Particle Size Range
PLGA 85:15 Foam 1 2 3 4 5 6 7 de ( m) 0 50 100 150 200 P o rosity (%) 70 72 74 76 78 80 82 84 86 88
PLGA85:15 of Different Particle Size Range
PLGA 85:15 Foam 1 2 3 4 5 6 7 de ( m) 0 50 100 150 200 250 300 Poros ity (%) 84 86 88 90 92 94 96 98
(A): P
sat 120 bars(B): P
sat 100 barsFigure 8.5: Effect of particle size on equivalent pore size and geometric porosity of PLGA85:15 foams
processed at Tsat 48°C, tsat 20 min and dP/dt 3bar/s
From Figure 8.5 A and B, it is evident that in the condition Psat = 120 bars the pore size is low
(from 50 to 150 m) as compared to the second condition Psat = 100 bars. Moreover almost in all cases, most
of the pores are closed. At this lower pressure, pores in foams No. 2, 3, 4, 5 are open and mostly in homogeneous shape and the pore diameter is maximum. On the contrary, in foams 1, 6 and 7 most of the pores are closed and the pore diameter range is also low.
Compairing the porosities of the foams produced in both conditions, we can see that when pressure was 120 bars, the porosity varied between 72% and 86%. Especially for foams with minimum particle size and with maximum particle size porosity was almost at the lowest value. When the pressure was 100 bars, all the foams had porosity above 86%. Thus it is concluded that for future experimentation polymer after grinding in the ball mill particle between 125 − 600 m will be utilized.
2 Filler: Tri-calcium phosphate Doped by Sr
2.1 Experimentation on Blends and Composite Foams
Conclusions after first experiments are the following: from a point of view of the geometic porosity and the equivalent pore size, a blend containing the two fillers (ATCP(sr) and TCP(sr),) produced
Chapter 8. Optimization of Pore Morphology of Scaffoldss for Calcified Tissue Engineering
ATCP(sr)+ 5% TCP(sr)and95% PLGA85:15 (858-S) + 2.5% ATCP(sr) + 2.5% TCP(sr). The purpose was to
analyze difference in porosity and pore size and the impact of the filler ratio on mechanical properties.
2.1.1 Experimentation on Composite Foaming with Different Co-grinding Times
The purpose was to produce different scaffolds with an objective of an industrial production. First, long PLGA85:15 (RG 858-S) fibres were reduced into small fibres using the knife mill. It was decided to test
five different co-grinding times. Mixture of 90% PLGA85:15 + 5% ATCP(sr) + 5% TCP(sr) were co-ground in
the ball mill for 15 to 135 minutes to obtain fine blends. A constant mass (255 mg) of blend powder was taken for each pellet. The granulometry after 15, 30, 45, 90 and 135 minutes co-grinding is shown in Figure 8.6 and the mean particle size is tabulated in Table 8.6. The pellets were pressed at P 150 bars, T 50o
C and t 20 min. Diameter of the pellets was 13 0.15 mm and thickness 1.5 0.05 mm.
90%PLGA 85:15 + 5%ATCP(sr) + 5%TCP(sr) Particle Size(m) 0.01 0.1 1 10 100 1000 10000 Vo lu m e ( % ) 0 2 4 6 8 10 15' Cogrinding 30' Cogrinding 45' Cogrinding 90%PLGA 85:15 + 5%ATCP(sr) + 5%TCP(sr) Particle Size(m) 0.01 0.1 1 10 100 1000 10000 Vo lu m e ( % ) 0 2 4 6 8 10 12 90' Cogrinding 135' Cogrinding
Figure 8.6: Size distribution of composite formulation at different co-grinding time. Table 8.6: Mean particle size of composite matrix after different co-grinding time.
Mean Particle Size Co-grinding Time (min)
15 30 45 90 135
d50 (m) 245.0 316.9 538.1 796.6 977.0
As the co-grinding time increases, it is observed that the particle size increases which indicates that agglomeration phenomenon is taking place during co-grinding. Foams of polymer composite with 5% ATCP(sr) and 5% TCP(sr) are presented in Figure 8.7 and their porosities and pore equivalent sizes are
presented in Table 8.7.
tco-grinding = 135 min tco grinding = 90 min tco grinding = 45 min
tco grinding = 30 min tco grinding = 15 min
Figure 8.7: Micrographs of PLGA85:15 composites foams processed at Tsat = 50
o
C, Psat = 100 bars, tsat = 20 min,
Chapter 8. Optimization of Pore Morphology of Scaffoldss for Calcified Tissue Engineering
An effort was made to produce pores with co-ground composite but we obtained foams with very low geometric porosities and equivalent pore size. The foams obtained were very hard, indicatiing that their mechanical properties are very high. However, as the co-grinding time decreased the geometric porosity and equivalent pore size increased gradually. Such foams can be used where low pore diameter and high mechanical properties are required. Our requirement was to obtain foams with pore diameter above 250 m. Hence for future experiments, co-grinding will not be preferred and composite blend will be made by simple mixing.
Table 8.7: Equivalent pore diameter and porosity of foams processed at different co-grinding time at Tsat =
50oC, Psat = 100 bars, tsat = 20 min, and dP/dt = 3 bar/s.
Pore Data Co-grinding Time (min)
15 30 45 90 135
Equivalent pore size de 58 45 27 19 5
Geometric porosity P (%) 75.8 65.7 56.4 49.3 42.5
One can find that there is direct effect of co-grinding on the equivalent pore diameter and porosity of foams. As the co-grinding time was reduced, there was an increase in pore diameter and porosity. Co-grinding of filler with polymer decreases the sorption of CO2 in the polymer matric thus leading to less
swelling and low pore diameter and poristy.
2.1.2 Foaming of Fine Powder and Filler Blend by Simple Mixing
As co-grinding of polymer with filler compelled us to adapt simple mixing so we opted for two different filler ratios and different process temperatures. Foaming of the pellets was done in SEPAREX® SFC6 sc-CO2 6L laboratory plant. Perforated plates were used for foaming. Process conditions for scCO2
and ratios of fillers in polymer matrix foam with equivalent pore diameter and porosity are stated in Table 8.8. Foams micrographs are shown in Figure 8.8.
Table 8.8: Pores diameter and porosity of selected [PLGA85:15+ATCP(sr)+ TCP(sr)] foams.
N° Tsat (°C) Psat (Bar) tsa (min) dP/dt (bar/s) 90%PLGA+5%ATCP(sr) +5% TCP(sr) 95%PLGA+2.5%ATCP(sr) +2.5% TCP(sr) de (m) P (%) de (m) P (%) 1 40 120 20 3 80 69.4 97 72.5 2 45 120 20 3 95 71.4 123 74.4 3 45 100 20 3 135 72.1 130 77.9 4 50 120 20 3 147 76.3 164 80.1 5 50 100 20 3 237 88.3 252 90.4
The results obtained show that at higher temperature, we get maximum value of geometric porosity and equivalent pore size. From 40oC to 50oC, there was gradual increase in pore diameter. At Tsat =
50oC and Psat = 120 bars, equivalent pore size and geometric porosity was less when the Tsat = 50 o
C and Psat =
100 bars. There was not large difference between the equivalent pore diameter and porosity of foams with different filler ratios so 10% polymer filler composite will be preferred over 5% for higher modulus. The compression test comparison will be elaborated later on. Hence for future formulations, 10% fillers will be used to optimize the scCO2 process conditions for higher geometric porosity and, equivalent pore size.
Chapter 8. Optimization of Pore Morphology of Scaffoldss for Calcified Tissue Engineering
(90%+5%+5%) (95%+2.5%+2.5%)
1-Tsat 40°C, Psat 120 bars, tsat 20 min, dP/dt 3bar/s
(90%+5%+5%) (95%+2.5%+2.5%) (90%+5%+5%) (95%+2.5%+2.5%)
2-Tsat 45°C, Psat 120 bars, tsat 20 min, dP/dt 3bar/s 3-Tsat 45°C, Psat 100 bars, tsat 20 min, dP/dt 3bar/s
(90%+5%+5%) (95%+2.5%+2.5%) (90%+5%+5%) (95%+2.5%+2.5%)
4-Tsat 50°C, Psat 120 bars, tsat 20 min, dP/dt 3bar/s 5-Tsat 50°C, Psat 100 bars, tsat 20 min, dP/dt 3bar/s
Figure 8.8: Micrographs of foams with different filler ratio processed at five different scCO2 conditions.
2.1.3 Mixing Experimentation on Composite Foaming with Different Polymer Particle Size
Pure PLGA85:15 fibres after grinding in ball mill and then in knife milling collected from each
sieve was mixed simply with 5% ATCP(sr) + 5% TCP(sr) and then pellets were made and further tested for
foaming. The blend components were mixed by using magnetic stirrer for 15 minutes. Hydraulic press was used for pellets with conditions P = 150 bars, T = 47oC, t = 20 min. A constant mass (255 mg) of composite powder with 90% PLGA85:15, 5% ATCP (sr) and 5% βTCP (sr) was used to make each pellet. Foaming
conditions Tsat 45°C, Psat 100 bars, tsat 20 min and dP/dt 3bar/s were selected. Indeed adapting the
temperature close to Tg permits to have pores with larger diameter. The micrographs of the foams obtained
![Figure 7.15: Micrographs of foams obtained by simple mixing of polymer and wax and processed - at [T sat 45°C, P sat 120 bars, t sat 20 min, dP/dt 3bar/s]](https://thumb-eu.123doks.com/thumbv2/123doknet/3661642.108221/16.892.131.751.103.418/figure-micrographs-foams-obtained-simple-mixing-polymer-processed.webp)