HAL Id: tel-02186350
https://tel.archives-ouvertes.fr/tel-02186350
Submitted on 17 Jul 2019
HAL is a multi-disciplinary open access archive for the deposit and dissemination of sci-entific research documents, whether they are pub-lished or not. The documents may come from teaching and research institutions in France or abroad, or from public or private research centers.
L’archive ouverte pluridisciplinaire HAL, est destinée au dépôt et à la diffusion de documents scientifiques de niveau recherche, publiés ou non, émanant des établissements d’enseignement et de recherche français ou étrangers, des laboratoires publics ou privés.
hematopoietic development of the embryo : Focus on
yolk sac macrophages and hematopoietic stem cells
Deshan Ren
To cite this version:
Deshan Ren. Functions of the transcription factor Lyl-1 in the hematopoietic development of the em-bryo : Focus on yolk sac macrophages and hematopoietic stem cells. Emem-bryology and Organogenesis. Université Paris Saclay (COmUE), 2019. English. �NNT : 2019SACLS189�. �tel-02186350�
Functions of the transcription factor Lyl-1 in the
hematopoietic development of the embryo:
Focus on yolk sac macrophages
and hematopoietic stem cells
Thèse de doctorat de l'Université Paris-Saclay préparée à l'Université Paris-Sud
École doctorale n°577: Structure et Dynamique des Systèmes Vivants (SDSV) Spécialité:Sciences de la vie et de la santé Thèse présentée et soutenue à Villejuif, le 8 juillet 2019 par
Deshan REN
Composition du Jury : Dr. Pierre BOBE Président Université Paris‐Sud Dr. Julien Y. BERTRAND Rapporteur Université de Genève Dr. Charles DURAND Rapporteur Sorbonne Université Dr. Thomas MERCHER Examinateur Institut Gustave Roussy Dr. Rachel GOLUB Examinatrice Institut Pasteur Dr. Isabelle GODIN Directrice de thèse Université Paris‐Sud N N T :2019S A C LS 189UNIVERSITE PARIS-SUD
École doctorale n°577 "Structure et Dynamique des Systèmes Vivants"
Institut Gustave Roussy
DISCIPLINE: BIOLOGIE
THÈSE DE DOCTORAT
Soutenue le 8 Juillet 2019
Par Deshan REN
Functions of the transcription factor Lyl-1 in the
hematopoietic development of the embryo:
Focus on yolk sac macrophages
and hematopoietic stem cells
Composition du jury:
Rapporteurs: Dr. Charles DURAND Sorbonne Université
Dr. Julien Y. BERTRAND Université de Genève
Examinateurs: Dr. Rachel GOLUB Institut Pasteur
Dr. Thomas MERCHER Institut Gustave Roussy
Président: Dr. Pierre BOBE Université Paris Sud
This work is the result of the untiring and fulfilling efforts at Institut Gustave Roussy, a place I call my second home under the supervision of Dr. Isabelle GODIN. It is my pleasure to be able to thank the people who have provided their kind help and support to me during these 4 years.
First of all, I would express my perpetual and sincere gratitude to my supervisor, Dr. Isabelle GODIN, for introducing, leading and guiding me into this wonderful world of embryonic research. Thank you for your patience, which I tested many a times. Your mentorship during these 4 years of professional training opened my eyes to this amazing world of research. Your wisdom and implausible suggestions have made me into the researcher that I am today. You have taught me a lot and I will always be grateful to you for so many things. Thank you for introducing me to your family and treating me like family. Your mentoring was not only that of a supervisor but also a friend. Where I not only learnt science, but also how to be a person who is righteous and honesty.
Sincere thanks to Dr. Julien Y. BERTRAND and Dr. Charles DURAND who spent a lot of their precious time to improve my manuscript and come up with very insightful comments. You definitely increased my perception and helped me a lot in finalizing my work. I would like to thank the other members of my thesis committee: Dr. Pierre BOBE, Dr. Thomas Mercher for taking out time from their busy schedules to review my work. A very sincere gratitude to Dr. Rachel GOLUB for not only being my thesis jury but also the advisor of my study.
Next, I must also acknowledge my team: I would like to thank Dr. Shoutang Wang, who was a companion for more than 2 years in the lab, and for his scientific assistance and kind help with my studies and life in France. Your humor and jokes
Benhamouche for your encouragement and assistance.
I would like to thank Dr. William VAINCHENKER, Dr. Dr. Isabelle PLO, Dr. Hana RASLOVA and Dr. Monika WITTNER for your kindness support during my study. I would like extend a special thanks to Mr. Rameez ISHAQ for his encouragement and friendship and for his critical support whenever I requested it. I truly have been lucky to meet you in the lab and I will definitely miss you. I would like to thank Dr. Tao Song & Dr. Longsheng Zheng for the fun weekends during their 3 year stay in Villejuif. A warm gratitude to the Chinese people in IGR: Dr. Yanyan Zhang; Dr. Liang He; Dr.Heng Zhou; Dr. Yinxing Ma; Dr. Peng Liu and Dr. Liwei Zhao; Dr. Guo Chen; Dr. Jiang Hu and Mr. Wei Xie for your support and encouragement. Cheers for the young researchers in U1170: Dr. Lise Secardin; Tracy Dagher; Graciela Rabadann; Francesca BASSOVALENTINA; Dr. Mira KHOURY; Dr. Alessandro Donada; Dr. Brahim ARKOUN and Dr. Anita Roy.
I would like to acknowledge the friends I have made in Paris: Mr. Bingrun Liu, Miss Jiajia Guo, and Mr. Dawei Liu and those happy, optimistic and talkative people from Northeast of China who give me a lot of cheering up. Dr. He Huang and Dr. Zuowei Zhu and your group of students from ENS Cachan for sharing your get together during the lonely weekend.
Last but not least I would like to thank my family, particularly my parents, for all the support you provided me throughout my entire life. My girlfriend Yu Pingping for your sacrifice and understanding during the past years. And I hope I will not let you down in any way in the future.
Finally, I would like to thank the China Scholarship Council. This thesis would not have been possible without the fellowship from China Scholarship Council.
1
Index
1. Introduction ... 8
1.1 The adult hematopoietic system ... 9
1.2 Development of hematopoietic system ... 11
1.2.1 Three waves of embryonic hematopoietic progenitors: general information ... 11
1.2.2 The primitive wave ... 13
1.2.3 The transient-definitive wave: EMP and HSC-independent B- and T-lymphoid potential ... 13
1.2.4 The definitive wave: Development of hematopoietic stem cell ... 14
1.2.5 Cross talk between waves of hematopoiesis ... 15
1.3 Development of macrophage progenitors in the YS ... 16
1.3.1 Tissue resident M ... 16
1.3.2 Fate-mapping analysis of M ontogeny ... 18
1.3.2.1 Fate mapping strategies ... 18
1.3.2.2 Various inducible models used to analyze Montogeny ... 19
1.3.2.3 Ontogeny of tissue resident M: contribution and limitation of fate mapping studies ... 20
1.3.3 Contribution of YS hematopoiesis to microglia population ... 21
1.3.4 Factors that regulate the development of M in the embryo ... 24
1.4 HSC development and factors involvement ... 26
1.4.1 HSCs markers during development ... 26
1.4.2 Hematopoietic transcription factors involved in HSC development... 28
1.4.3 Extrinsic regulation of HSC emergence ... 31
1.5 The function of Lyl‐1 in hematopoiesis ... 34
1.5.1 Current knowledge on Lyl-1 ... 34
1.5.2 Redundancy with Tal1/Scl ... 36
2 Results ... 39
2.1 The role of Lyl-1 in the development of YS Mprogenitor and microglia ... 40
2.1.1 Lyl‐1 expression marks YS M progenitors in the early YS and brain ... 45
2.1.2 Lyl‐1 expression discriminates MPrim progenitors from EMP‐derived MT‐Def progenitors ... 47
2.1.3 Lyl‐1 deficiency leads to a defective differentiation of M in the YS and of microglia in early brain ... 50
2.1.4 Lyl‐1 inactivation impairs microglia development at two development stages ... 52
2.1.5 Effects of Lyl‐1 inactivation in the adult: defective microglia and impaired social behavior ... 55
2.2 RNA-seq analysis of YS Mprogenitors ... 86
2.2.2: The difference of expression between E9 WT and Lyl‐1lacZ/lacZ Mprogenitors ... 99
2.2.3:Are E9 MPrim progenitors primed to express microglia enriched genes? ... 107
2.3 Lyl-1 function during HSC development ...120
2.3.1 AGM‐HSC express Lyl‐1, but do not depend on Lyl‐1 for their generation ... 124 2.3.2 Lyl‐1 invalidation leads to a 2‐3 fold decrease of the HSC pool in E10 AGM and in E12 and E14 FL ... 128 2.3.3 Lyl‐1 invalidation leads to an increased level of apoptosis at the AGM stage only ... 130 2.3.4 Are modifications of inflammatory signaling responsible for the HSC defect in Lyl‐1LacZ/LacZ mutants? ... 136
3. Conclusion and general perspectives ...146
3.1 The function of Lyl‐1 during YS Mdevelopment ... 147 3.2 The function of Lyl‐1 during microglia development ... 150 3.3 The function of Lyl‐1 during the HSC development ... 152
4 Résumé ... 157
5 References ... 171
3
Abbreviations
AGM: Aorta‐gonad‐mesonephros ALL: Acute lymphoblastic leukemia AML: Acute myeloblastic leukemia ‐Gal:‐Galactosidase bHLH: Basic helix‐loop‐helix CLP: Common myeloid progenitor CSF1: Colony stimulating factor‐1 DCs: Dendritic cells DEGs: Differentially expressed genes DN: Double‐Negative E: Embryonic day EHT: Endothelial to hematopoietic transition EMP: Erythro‐myeloid progenitor EoBP: Eosinophil–basophil progenitor ER: Estrogen receptor FDG: Fluorescein di‐‐galactopyranoside FDR: False discovery rate FL: Fetal liver GMP: Granulocyte–monocyte progenitors GSEA: Gene Set Enrichment Analysis HIAC: Hematopoietic Intra‐Aortic Cluster HSCs: Hematopoietic stem cells HSPC: Hematopoietic stem and progenitor cells IFN‐Interferon ILCs: Innate lymphoid cells IRF8: Interferon regulatory factor 8 LDA: Limiting dilution assay Lmo2: LIM domain only 2 LRP: Low density lipoprotein receptor‐related protein LSK: Lineage‐ Sca‐1+cKit+
LTR: Long‐term reconstitution Lyl‐1: Lymphoblastic leukemia derived sequence 1 M‐CSF: Macrophage colony‐stimulating factor MEP: Megakaryocyte–erythrocyte progenitors M Macrophages MPrim: Primitive M MT‐Def: Transient definitive M MIF: Macrophage migration inhibitory factor MPS: Mononuclear phagocyte system NES: Normalized enrichment score NF‐B: Nuclear factor k‐light‐chain enhancer of activated B core NK: Natural killer P‐Sp: Paraaortic splanchnopleura Runx1: Runt‐related transcription factor 1 S: Somite pair T‐ALL: T‐cell Acute Lymphoblastic Leukemia TAM: Tamoxifen TLR4: Toll‐like receptor 4 TGF‐β: Transforming growth factor‐β VE‐cadherin: Vascular endothelial cadherin WT: Wild type YS: Yolk sac
5
Organization of the thesis
During ontogeny, hematopoietic progenitors are generated in three independent waves, the first two (primitive and transient definitive) develop from the yolk sac (YS) before the
appearance of hematopoietic Stem Cells (HSCs) that occurs later in the
Aorta‐Gonad‐Mesonephros (AGM), in the third and definitive wave.
Both Tal1/SCL and its paralog Lyl‐1 belong to the transcriptional complex that regulates hematopoietic progenitor development. While Tal‐1/SCL is mandatory for the specification of hematopoietic progenitors from the three embryonic waves, to date the functions of Lyl‐1 during developmental hematopoiesis remains largely unknown. Previous work from our team has detected that Lyl‐1 and Tal1/Scl were expressed in an overlapping pattern in the early YS and newly generated AGM HSC, suggesting Lyl‐1 plays some important roles during hematopoiesis ontogeny. Few years ago, our team started to investigate the role of Lyl‐1 during developmental hematopoiesis and my research project focused on the function of Lyl‐1 during the development of YS macrophage (M) and of HSC.
Here, I give you a brief organisation of the thesis:
Firstly, I will give the general background (Introduction chapter) regarding the different steps of developmental hematopoiesis, including the three waves of hematopoiesis. I will develop in more details the current knowledge on YS M and HSC development. I will also give the information about the regulation of hematopoiesis by transcription factors and focus on the data currently available for Lyl‐1.
In the results part, I will first report previous data regarding the function of Lyl‐1 during YS M development that were obtained Shoutang Wang, as I participated to this project. I further continued this project by the RNA‐seq analysis of YS M progenitors and this part of results will be present secondly. The last part will report the data I have obtained on the function of Lyl‐1 during HSCs development.
Lastly, I will present the conclusion and perspective of the research project.
Figure List
Introduction figures: Figure 1: Hierarchical models of hematopoiesis. ... 10 Figure 2: Two waves of specification, development, and maturation stages of hematopoietic waves in YS. ... 12 Figure 3: Schematic illustration of the successive hematopoietic sites during mouse ontogeny. ... 12 Figure 4: Hematopoietic sites and different output of each hematopoietic wave during ontogeny. ... 16 Figure 5: Localization and functions of resident Msubpopulations. ... 17 Figure 6: Origin of tissue resident M. ... 18 Figure 7: Two distinct M waves generated from YS progenitors. ... 22 Figure 8. Three different models of fetal Montogeny. ... 24 Figure 9: Tissue resident M specification. ... 26 Figure 10: Schematic representation of hematopoietic transcription factors in HSCs. ... 31 Figure 11: Inflammatory signaling is required for HSC emergence. ... 34 Figure 12: The two Lyl‐1 knockout mouse models. ... 36 Results part 1 figures: Figure 1: Lyl‐1 marks M progenitors from early YS and brain. ... 46
Figure 2: Lyl‐1 expression discriminates MPrim progenitors from EMP‐derived MT‐Def progenitors. ... 49
Figure 3: Lyl‐1 regulates the differentiation towards mature M/microglia. ... 51 Figure 4: Lyl‐1 deficiency leads to transient reductions of the microglia pool at E12 and P0‐P3. ... 54 Figure 5: Lyl‐1 deficiency alters transcriptomic profile and activation status of microglia in the adult brain. ... 57 Figure 6: Lyl‐1 deficiency elicits altered social behaviour, as shown by an increased anxiety and a reduced neuronal connectivity. ... 61
Figure 7: Decreased dendritic spine density and impaired neuronal activity in pyramidal neurons from the anterior cingulate cortex of Lyl‐1‐deficient mice. ... 63 Supplementary Figure 1: Gating strategy used for embryonic M progenitors analyses. ... 78 Supplementary Figure 2: Microglia express Lyl‐1 from embryonic stages to adulthood. ... 79 Supplementary Figure 3: Lyl‐1 deficiency leads to transient reductions of the microglia pool at E12 and P0‐P3. ... 80 Supplementary Figure 4: Histological analysis of WT and Lyl‐1‐deficient brain sections... 82 Supplementary Figure 5: Identification of pyramidal units in awake mice. ... 83 Results part 2 figures: Figure 1: General information of PCA. ... 87 Figure: 2: Differential expressed genes between E9 WT and E10 WT M A1 progenitors. ... 91 Figure 3: Enrichment pattern between WT E9 and E10 M A1 progenitors. ... 94
Figure 4: Differential expressed genes between Lyl‐1lacZ/lacZ E9 and E10 MA1 progenitors. ... 97
Figure 5: Enrichment pattern between Lyl‐1lacZ/lacZ E9 and E10 progenitors. ... 99
Figure 6: Enrichment pattern between E9 Lyl‐1lacZ/lacZ and WT M A1 progenitors. ... 101
Figure 7: GSEA analysis of enrichment in E9 Lyl‐1lacZ/lacZ compared to E9 WT M A1 progenitors. ... 104
Figure 8: Enrichment pattern in E10 Lyl‐1lacZ/lacZ and WT M progenitors. ... 106
Figure 9: 16 WT vs. Lyl‐1lacZ/lacZ DEGs common to E9 and E10 progenitors. ... 106
Figure 10: Gene expression pattern of WT E9 YS MPrim progenitors compared to E10 YS MPrim+T‐Def progenitors. ... 109
Figure 11: E9 Lyl‐1lacZ/lacZ M A1 progenitors are enriched in neurogenesis and synaptic regulation related function compared to E9 WT. ... 111
7
Supplemental Figure 1: MA plots show a similar expression scale of whole transcriptome data between E9/10 WT and Lyl‐1LacZ/LacZ YS M progenitors. ... 112 Supplementary Figure 2:MHC‐II expression level in is significatnly higher in E9 compared to E10 YS M progenitors. ... 112 Figure 12: Chart illustrating the general analysis used in this study. ... 117 Figure 13:Overview illustrating the GSEA method. ... 119 Results part 3 figures: Figure 1: AGM‐HSC express Lyl‐1, but do not depend on it for their generation ... 126 Supplementary Figure 1: ... 127 Figure 2: Comparison of proliferation and apoptosis levels in HSPC from E10 AGM, E12 FL and E14 FL in WT and Lyl‐1LacZ/LacZ embryos. ... 132 Supplementary Figure 2: ... 133
1. Introduction
9
1.1 The adult hematopoietic system
In adult mammals, the blood cells are composed of a variety of cell types that travel in the blood vessels to reach the different tissues, where they provide oxygen (erythrocytes), produce platelets that are essential for clotting processes (megakaryocytes) and provide the first barrier of defense against environmental pathogens, through the clearing of exogenous particles and cellular debris (macrophages and neutrophils). Mammalian life is impossible in the absence of any of these erythro‐myeloid cells. Specific defenses against pathogens and the elimination of abnormal cells (tumors) are carried out by cells of the lymphoid lineage — T cells, B cells and natural killer (NK) cells (Laurenti and Gottgens, 2018). And these blood cells are constantly replenished by progenitors produced by a rare population cells from the bone marrow, which are the hematopoietic stem cells (HSCs).
The in vivo proof for the multipotent capacity of HSCs was first discovered based on bone marrow transplantation experiments aimed to protect mice from lethal irradiation (Jacobson et al., 1951). Since then, progress in the phenotypic and functional characterization of these progenitors led to the isolation of HSCs and has made the hematopoietic system a paradigm in stem cell biology. Thus, HSC are characterized by two classical stem cell properties, multipotency and self‐renewal. Multipotency is defined by the capacity of a single cell to give rise to a differentiated progeny comprising different cell types, including erythrocytes, myeloid cells, megakaryocytes, dendritic cells, lymphoid cells and natural killer cells. The self‐renewal capability means that they can give rise to HSCs themselves without differentiation, which is very important to keep its proper pool. The property of HSC is proved by in vivo long‐term reconstitution (LTR) experiments. By contrast, fate‐committed progenitors are defined by a restricted lineage differentiation capacity (most often bi‐ or uni‐lineage) and the absence or a limited self‐renewal capability, so that they are usually exhausted within the first 2–3 weeks after transplantation (Laurenti and Gottgens, 2018).
The integrity of blood system depends on the differentiation of HSCs into the different lineages of blood cells. The characterization of progenitor populations downstream of HSCs provided the blueprint of the first classical hierarchical model of hematopoiesis. In this model, the first branching point distinguishes lymphoid potential from all other lineages (erythroid, myeloid and
megakaryocytic), followed by several further branches on either side of the hierarchy tree progressing from multi‐ to bi‐ then uni‐potent progenitor and mature blood cells. The subsequently discovery of other immune‐phenotypic markers during the years 2005 to 2015 led to revise several details of the branching tree, including subdivision of the multipotent progenitor compartment into several distinct subpopulations, lymphoid and myeloid fates remaining associated until further down the tree making it the current most prevailing model (Figure 1) of hematopoiesis (Laurenti and Gottgens, 2018).
Figure 1: Hierarchical models of hematopoiesis.
a, Visualization of the classical hierarchical model of hematopoiesis: HSCs are represented as a homogeneous population. Downstream HSC, the first lineage bifurcation separates the myeloid and lymphoid branches via the common myeloid progenitor (CMP) and common lymphoid progenitor (CLP) populations. b, During the years 2005–2015, this visualization incorporates new findings: the heterogeneity of the HSC pool both in terms of self‐renewal (vertical axis) and differentiation properties (horizontal axis), the myeloid and lymphoid branches remain associated via the lymphoid‐primed multipotent progenitor (LMPP) population, the GMP compartment is shown to be fairly heterogeneous. DCs, dendritic cells; EoBP, eosinophil–basophil progenitor; GMP, granulocyte–monocyte progenitors; LT, long‐term; ILCs, innate lymphoid cells; MEP, megakaryocyte–erythrocyte progenitors; NK, natural killer cells; ST, short‐term. From (Laurenti and Gottgens, 2018)
11
1.2 Development of hematopoietic system
1.2.1 Three waves of embryonic hematopoietic progenitors: general information
Though adult HSCs reside in the bone marrow of mammalian, they are not generated there, but
originate from a population generated de novo during ontogeny. During mouse ontogeny, the
hematopoietic system is absolutely different from the hierarchical models of hematopoiesis described in the adult. The hematopoietic system initiates with HSCs independent hematopoiesis (Palis, 2016) and is established in three distinct successive waves which are temporally and spatially restricted, each producing specific blood progenitors. This process
involves three main anatomical sites: the extra‐embryonic yolk sac (YS), the intra‐embryonic
aorta‐gonad‐mesonephros region (AGM) and the fetal liver (FL) (Cumano and Godin, 2007). The YS blood island is the first site of hematopoiesis in mammalian embryos, and the AGM is the site for HSC generation, while FL provides a microenvironment for HSC proliferation, maturation and differentiation (Khan et al., 2016). During hematopoiesis ontogeny, the first two waves of hematopoietic progenitors are generated in the YS and are called respectively primitive wave and “transient definitive” wave (Figure 2). These two waves share as a common feature the ability to produce cells from the erythro‐myeloid lineage, but they differ by several features (for more details, see below). The third wave is the definitive wave, which produce multipotent hematopoietic progenitors with long term reconstitution (LTR) activity in the aorta region, called the paraaortic splanchnopleura (P‐Sp) at embryonic day (E) 9, then AGM at E10. During development, progenitors from three waves of hematopoietic cells sequentially migrate to and colonize the FL, then some of them colonize the thymus, the spleen and finally the BM (Figure 3). The first two waves generated in the YS are also called HSC independent hematopoietic waves (Palis, 2016), since they initiate hematopoiesis prior to the generation of HSCs.
Figure 2: Two waves of specification, development, and maturation stages of hematopoietic waves in YS. From (Porcher et al., 2017). Figure 3: Schematic illustration of the successive hematopoietic sites during mouse ontogeny. An illustration of a mouse shows the hematopoietic sites and organs during embryonic development (two independent hematopoietic sites: yolk sac and P‐Sp/AGM; intermediate site: fetal liver; hematopoietic organs: first the thymus, then the spleen and, finally, the bone marrow; here, the placenta has not been considered to be a hematopoietic organ,). P‐Sp/AGM: Paraaortic Splanchnopleura/Aorta‐Gonad‐Mesonephros region.
13
1.2.2 The primitive wave
The primitive wave initiates in the YS blood islands from E7 before the establishment of blood circulation (McGrath et al., 2003) and produces precursors with either erythroid, macrophage (M) or megakaryocytic potential (Palis et al., 2001; Palis et al., 1999). After circulation between the YS and embryo proper is connected at the E8.25 stage (Ji et al., 2003; McGrath et al., 2003), these precursors and their progenies enter the blood stream and soon mix with the progenitors derived from the transient definitive, then the definitive waves and their mature progenies (Kingsley et al., 2004). Contrary to progenitors from the transient definitive and definitive waves, which give rise to mature erythrocyte, M or megakaryocytes trough bi‐potential intermediate progenitors (EMk and GM), in the primitive wave erythrocyte, M or megakaryocytes are produced by monopotent progenitors (Tober et al., 2007). The primitive
erythrocyte progenitors (EryP‐CFCs) will produce large, nucleated, embryonic
βH1‐globin‐expressing erythroid cells, which differ from definitive erythrocytes from the 2nd wave and 3rd waves, which are small, enucleate and express only adult globins. Further studies indicate that primitive erythropoiesis, megakaryopoiesis and M develop independently of cMyb (Gomez Perdiguero and Geissmann, 2013; Schulz et al., 2012; Tober et al., 2008). Though primitive and definitive erythropoiesis have been well characterized, little is known about the differences between primitive and definitive megakaryopoiesis, as well as primitive and definitive M regarding on their development and specific functions. Actually, primitive M
progenitors and 2nd wave EMP share some common feature as their immune‐phenotype
evolution during differentiation to mature M (Bertrand et al., 2005b), so that they are sometimes referred to as early and late EMP (Hoeffel and Ginhoux, 2015, 2018). Information regarding M development in the embryo will be further developed in chapter 1.3.
1.2.3 The transient‐definitive wave: EMP and HSC‐independent B‐ and
T‐lymphoid potential
The 2nd wave of hematopoiesis in the YS gives rise to erythro‐myeloid progenitors (EMPs)
starting from E8.0 (Palis, 2016), concomitantly with the establishment of blood circulation (McGrath et al., 2003). This wave is more complex than the primitive one, as EMP has a multilineage potential and produces mature blood cells in a differentiation pathway that is similar to the adult. Still, progenitors from this wave lack a long‐term reconstitution potential and have been thus termed the ‘‘transient definitive’’ wave. This wave is thus distinct from the
primitive wave, which is also transient but lacks multipotent progenitors and from the third wave, which shows long‐term maintenance capacity (McGrath et al., 2015a). Progenitors from the 2nd wave give rise to definitive erythrocytes, M, megakaryocytes, which will mature and differentiate mainly in the FL, after its colonization. Recent research has suggested that the 2nd wave of hematopoiesis could also give rise to rare progenitors which will later give rise to B1a cells (Yoshimoto et al., 2011) and T cells (Boiers et al., 2013), but these progenitors are distinct from EMPs and develop before the beginning of HSC generation, making this wave of hematopoiesis more complex. McGrath et al. have suggested that EMPs could be distinguished by their phenotype from primitive progenitors: they express higher levels of CD41 and cKit at E8.5, whereas primitive erythrocytes progenitors display a CD41low cKitlow phenotype. At E9.5,
the EMPs population displays a c‐Kit+CD41+CD16/32+ phenotype, differing from maturing
primitive cells such as c‐Kit‐CD16/32+CD45hi primitive M and c‐Kit‐CD41hiGp1bβ+ primitive megakaryocytes (McGrath et al., 2015a). However, the differences between primitive M progenitors and EMPs still remain unclear.
1.2.4 The definitive wave: Development of hematopoietic stem cell
The third wave of hematopoiesis initiates in the intra‐embryonic compartment, in a site that contains the developing aorta, gonads, and mesonephros. This site is called first Paraaortic Splanchnopleura (P‐Sp) from E9 and it further develops into the AGM after E10. Bona fide HSC, characterized by their ability to perform long term mutilineage reconstitution (LTR) of irradiated adult recipient are generated in this P‐Sp/ AGM region. Once generated, these cells migrate to FL where their number dramatically expand. Finally, they migrate to the bone marrow, where they will be responsible for the adult hematopoiesis (Ciau‐Uitz et al., 2014). In vivo LTR
experiments confirmed that only progenitors from the 3rd wave of intra‐embryonic can provide HSC that confers long term reconstitution potential (Cumano et al., 1996; Cumano et al., 2001; Ganuza et al., 2018). The intra‐embryonic HSCs generated in the AGM region (E10: 30‐35 somite pairs (S)), are characterized by a high expression level of c‐Kit, a low level of CD41, and a low to negative expression of CD45. They also express several markers, which expressions are common with endothelial cells, such as CD31, CD34 and AA4.1 (Bertrand et al., 2005a).
At this early stage (E10), HSC do not yet express MHC‐I molecules and thus cannot engraft normal adult recipient mice. However, they can successfully perform multilineage LTR when transferred into immune‐deficient Rag2‐/‐c‐/‐ mice that lack natural killer cell, as well as B and T
15 lymphoid cells (Bertrand et al., 2005a) or into neonatal recipient mice (Arora et al., 2014). Soon after E10.5 (35S) in the AGM and after they migrate to FL, HSC acquire a CD45+ and MHC‐1+ phenotype (Kieusseian et al., 2012) and the ability to perform LTR in normal adult recipient (Arora et al., 2014).
As blood circulation between the YS and the embryo is established just after the formation of the first primitive wave (McGrath et al., 2003), from then on, progenitors from all three waves are mixed in the blood stream and can be found within the YS, the AGM, the FL and other tissue such as the placenta (McKinney‐Freeman et al., 2009), making it difficult to delineate the contribution of each wave to hematopoiesis.
1.2.5 Cross talk between waves of hematopoiesis
Overall, the ontogeny of the hematopoietic system is a precise and complex process, in which each wave gives rise to progenitors with different differentiation and maintenance potentials
(Figure 4). While HSCs are indispensable for lifelong support of blood cells production up to
postnatal life, already functional blood cells are also required for the development of early mammalian embryos prior to the emergence of HSCs (Palis, 2016).
Figure 4: Hematopoietic sites and different output of each hematopoietic wave during ontogeny. The first wave originates in the YS and produces primitive erythrocyte, M and megakaryocytes. The second wave produces erythroid‐myeloid (EMP) and lymphoid‐biased progenitors that can reconstitute lethally irradiated recipients after experimental transplantation, but spontaneously disappear before adulthood in their native environment. The third wave produces conventional fetal HSCs that will develop into quiescent adult HSCs that sustain post‐natal hematopoiesis. From(Yoder, 2014). Embryos deprived of functional Tal1 die in utero as early as E9.5 (Robb et al., 1995) due to the complete absence of primitive erythropoiesis (Fujiwara et al., 1996), suggesting a pivotal role of the primitive wave of hematopoiesis. Embryos which lack functional EMPs from the 2nd wave (Frame et al., 2013), such as cMyb knockout embryos (Mucenski et al., 1991), will die around E15.5, also pointing out the importance of 2nd wave for hematopoiesis. Actually, besides providing the erythroid and myeloid cells that support embryogenesis, progenitors from these two waves will further provide the pro‐inflammatory environment (that will be further discussed in chapter 1.4.2) required for HSC generation in the third wave (Palis, 2016). Collectively, all these research show that progenitors from these three waves, which show a spatial‐temporal overlap in early embryo, work together closely to establish the proper hematopoiesis system.
1.3 Development of macrophage progenitors in the YS
1.3.1 Tissue resident
MM, one of the multifaceted cells of the hematopoietic system, can be found in all tissues
(Figure 5) where they form the tissue resident M population. They perform roles ranging from
the regulation of development, the maintenance of homeostasis to the immune surveillance of pathogens (Wynn et al., 2013). For a long time, adult M were considered as continuously replenished by bone marrow HSCs through monocyte intermediates. However, this view was overturned by several works which evidenced that most adult tissue resident M are generated during embryonic development and that they can self‐renew locally without an input from HSC derived monocytes from the bone marrow (Sieweke and Allen, 2013).
17 Figure 5: Localization and functions of resident Msubpopulations. Resident M are distributed in various tissues such as the CNS, skin, lung, spleen, liver, bone, blood and serosal cavities. From (Kurotaki et al., 2017) About 4 decades ago, Van Furth and colleagues proposed the ‘‘mononuclear phagocyte system’’ (MPS) concept which group together peripheral blood monocytes, tissue resident M and their precursors in the BM (van Furth et al., 1972) and it was firmly believed that tissue resident M were supplied by progenitors from the BM. This view was challenged in the early 2000s with the experiments on Langerhans cells (epidermal M) showing that these cells are resistant to high doses irradiation and that the repopulation originates from host remaining Langerhans cells, whereas monocytes were all repopulated from donor progenitors after congenic BM transplantation (Merad et al., 2002). A similar phenomenon was also observed for brain microglia (Ajami et al., 2007). With the advance of fate mapping technology, several lineage tracing experiments proved that most of tissue resident M, ranging from brain microglia and liver Kupffer cells to epidermal Langerhans cells, arise from embryonic progenitors and maintain themselves through self‐renewal (Ginhoux and Guilliams, 2016). The current knowledge on
different origin of tissue resident M is summarized in Figure 6. Figure 6: Origin of tissue resident M. (A) Different fate mapping strategies used to identify the origin of tissue resident M: Csf1rCreER and Runx1 for YS derived M and Flt3‐cre for either FL‐HSC or bone marrow HSC derived M. (B) The origin of several different tissue resident M: microglia are soley derived from YS; liver Kupffer cells arise from YS derived progenitors and embryonic HSC, etc. From (Epelman et al., 2014b).
1.3.2 Fate‐mapping analysis of M ontogeny
1.3.2.1 Fate mapping strategiesDefining the precise origin and developmental pathway of tissue‐resident Mshould help refine our understanding of the role of these cells in various diseases and enable to design novel M‐targeted therapies. Lineage‐tracing methods provide the possibility to trace embryonic M differentiation into adulthood. The most frequently used tool for lineage‐tracing is the cre‐loxP–mediated recombination system which was first discovered and named by Sternberg and Hamilton in 1981 using P1 bacteriophage system (Sternberg and Hamilton, 1981). The cre recombinase, once expressed, irreversibly removes the loxP‐flanked DNA region, leaving a permanent modification of the DNA sequence. Since then, it was widely used especially in mammalian studied, because it allows researchers to interrogate the function of genes in
19 specific cell types, and it can also be used as a labeling system (McLellan et al., 2017). The conditional gene expression is designed by flanking a stop sequences by loxP between the
promoter and a gene coding sequence for reporter markers (fluorescent markers for example),
and the Rosa26 locus is most frequently used as a reporter gene driver due to its ubiquitous and strong expression pattern (Zambrowicz et al., 1997). Furthermore, the temporal control of Cre activity is designed to precisely target genes at specific development times. One of the most frequent strategy for timed gene targeting uses the fusion of ligand‐binding domains of steroid hormone receptors, such as estrogen receptor (ER) or modified ER (Mer): without the ligand for these receptors, the cre activity is blocked by the heat shock protein Hsp90, which forms heterodimers with cre protein in the cytoplasm and prevents it for accessing the DNA. In the presence of the ligand such as tamoxifen (TAM), the modified cre protein is released from Hsp90 heterodimer, translocates into the nucleus and exerts its recombining function. Recently, several fate‐mapping mouse lines have been used to investigate the ontogeny of M. 1.3.2.2 Various inducible models used to analyze Montogeny Ginhoux et al. made use of the inducible runx1‐MER‐Cre‐MER labeling system at around E7.0 to label early YS M progenitors prior to the development of HSC. He demonstrated that microglia derives from M progenitors originating in the YS, that was considered as primitive (Ginhoux et al., 2010). CSF‐1R is the receptor for colony stimulating factor‐1 (CSF‐1) or macrophage colony‐stimulating factor (M‐CSF), which is expressed by E8.5 YS M. Schulz et al. making used the inducible Csf1r‐Mer‐iCre‐Mer mouse line to lineage trace Mdevelopment at E8.5. They found that YS M seed the different embryonic tissues and contribute later to adult resident M in several tissues, such as liver Kupffer cells, epidermal Langerhans cells and brain microglia (Schulz et al., 2012). One thing that need to be pointed out is that these tissue resident M developed normally in the absence of cMyb, confirming that these M are derived from primitive YS hematopoiesis since cMyb is required for transient definitive hematopoiesis and HSC generation but not primitive YS hematopoiesis (Mucenski et al., 1991).
YS and FL stages to adult progenitors in the BM. Sheng et al. used a new cKit‐MercreMer mouse strain to trace the origin of adult M. By targeting cKit‐expressing progenitors at different developmental time points, they conclude that all microglia derives from YS progenitors, since lineage tracing after E11.5 never labeled microglia (Sheng et al., 2015).
Tie2 is expressed in endothelial cells, YS progenitors and HSCs (Cumano and Godin, 2007). Thus, by injecting TAM into Tie2MeriCreMer at different development time points could help to understanding the origin of different hematopoietic progenitors during development. Gomez et
al. demonstrated that an early injection of TAM (E6.5) could target hematopoietic progenitors
from all waves during embryo development, whereas induction performed at later stages (from E10.5) only highly targets HSCs (Gomez Perdiguero et al., 2015). By comparing the targeting efficiency at different induction time points, they evidenced that the vast majority of adult tissue‐resident M in the liver (Kupffer cells), lung (alveolar M), epidermis (Langerhans
cells) and brain (microglia) originates from YS‐derived progenitors.
During lineage commitment, adult HSCs transiently express Flt3 (Boyer et al., 2011), which provides a good model to genetically label adult HSC derived cells (Flt3‐Cre). For the Mlineage, blood monocytes derived from Flt3+ HSC do not replace Flt3 negative tissue M populations under normal situation, even over long periods of time (Epelman et al., 2014b). But we have to be cautious when we try to interpret the ontogeny of Flt3‐derived M cells. Though, Flt3‐Cre could help trace the differentiation of adult HSCs, it cannot clarify the contribution of the first 2 waves of hematopoiesis to tissue resident M, because M progenitors from both primitive and transient definitive waves do not express Flt3. In addition, during fetal liver hematopoiesis, Flt3 has a very limited lineage tracing efficiency (Epelman et al., 2014a; Hoeffel et al., 2015). So, due to these limitations, Flt3‐cre tracing is reliable only in adult stage.
1.3.2.3 Ontogeny of tissue resident M: contribution and limitation of fate mapping studies
All these fate‐mapping studies provided a lot information on the ontogeny of different tissue resident M. For example, the consensus now is that mouse brain microglia are exclusively derived from YS progenitors (Ginhoux et al., 2010; Gomez Perdiguero et al., 2015). Still, they have few inevitable defects regarding the lineage tracing efficiency and accuracy, because
21 factors such as Runx1, Tie2 and cKit are not specific markers for any waves of progenitors and they are expressed by all progenitors during development. Moreover, contrary to previous
claims, recent research by Senserrich et al. on inducible cre‐loxP system showed that a
significant Cre activity persists in mouse blood cells for 72 h after 4‐OH‐TAM injection (Senserrich et al., 2018). Such extended recombination activity in vivo is a potential source of misinterpretation, particularly in analysis of dynamic developmental processes during early stages of embryogenesis.
1.3.3 Contribution of YS hematopoiesis to microglia population
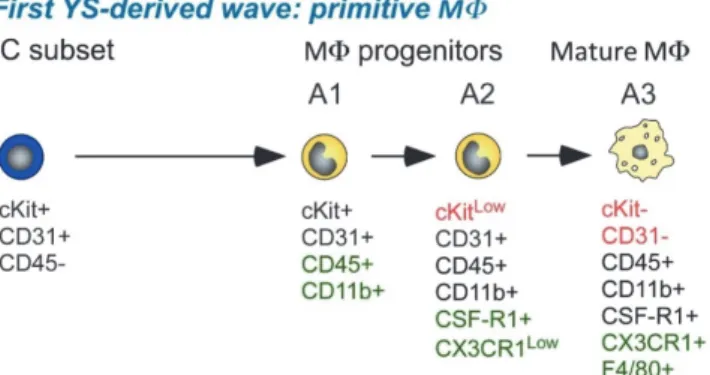
As mentioned before, both waves of hematopoietic progenitors in the YS have the capability to give rise to M within a short time window and, up to now, no immune‐phenotypic markers can distinguish the two M progenitors generated from the respective progenitors (Bertrand et
al., 2005b). Both waves of progenitors show a CD45‐cKit+ phenotype and mature into M in an
A1 to A3 phenotype progression (Figure 7) as indicated by their increased expression of M markers, such as CX3CR1 and F4/80.
Even though fate‐mapping studies using different markers confirmed the YS origin of microglia (Kierdorf et al., 2013; Sheng et al., 2015), the contribution of primitive and transient definitive YS wave of Mprogenitors to microglia remains unclear. To date, 3 models of YS hematopoiesis contribution to microglia have been proposed (Figure 8). The first model corresponds to the results from (Gomez Perdiguero et al., 2015). Combining inducible Tie2cre and inducible Csf1r fate‐mapping mouse models, they proposed that YS EMP are the common source of the vast majority of adult tissue‐resident M, including brain microglia. The second model proposed by (Hoeffel et al., 2015), claims that most tissue resident M including those from spleen, gut, kidney, lung and skin are derived from late cMyb+ YS EMPs which seed the fetal liver and go through a fetal monocytes state, while brain microglia are derived from so‐called “early YS EMPs” without monocytic intermediates. These “early YS EMPs” from (Hoeffel et al., 2015) most probably correspond to the YS primitive progenitors, as they share a common phenotype with YS EMP progenitors, but do not differentiate into M through monocytic intermediates (Bertrand et al., 2005b).
Figure 7: Two distinct M waves generated from YS progenitors.
Ery indicates erythrocytes; Gr, granulocytes. Two waves of M progenitors are generated in a narrow spatial and time overlap pattern and by now, no phenotypic markers can distinguish them. From (Bertrand et al., 2005b).
The last model corresponds to the observation obtained by (Sheng et al., 2015) using the inducible cKit‐cre mouse model to trace the progeny of cKit progenitors at different time points. Induction at E7.5 to E9.5 led to the labeling of all brain microglia and partially of epidermal Langerhans cells. On the contrary, targeting at E8.5 efficiently labeled other tissue resident M. Even if there is some disagreement on the origin of several tissue resident M, all three models agree on one fact: brain microglia are only derived from YS progenitors. However, the precise contribution of primitive vs. EMP‐derived M progenitors is still under debate. Nevertheless, in all the fate‐mapping experiments mentioned above, only a subset of microglia was labeled in adult mice, leaving open the possibility that they are other sources of microglia progenitors. Indeed, two researches on zebrafish confirmed that two distinct microglia progenitors exist in
23 zebrafish (Ferrero et al., 2018; Xu et al., 2015). In zebrafish, the spatial‐temporal and lineage difference of the three waves of hematopoiesis is easier to discriminate than that in mammals (Bertrand et al., 2007), the researchers could reach the conclusion that primitive M progenitors give rise to embryonic microglia and also that the definitive wave generated the adult microglia (Ferrero et al., 2018; Xu et al., 2015). More recently, the discovery of two microglia subpopulations (canonical, non‐Hoxb8 lineage‐labeled microglia and Hoxb8 lineage‐labeled microglia) added new fuel to the dispute on microglia ontogeny (De et al., 2018). Indeed, it is difficult so far to separate progenitors from the three hematopoietic waves using cell surface markers, due to their overlapping generation stages and similar immune‐phenotype (Bertrand et al., 2005a; Bertrand et al., 2005b; Inlay et al., 2014.; Lee et al., 2016; McGrath et al., 2015a; McGrath et al., 2015b).
Figure 8. Three different models of fetal M ontogeny.
The first model corresponds to the work of Gomez Perdiguero et al. (2015), the second to the work of Hoeffel et al. (2015), and the last to Sheng et al. (2015). Red arrow indicates the proposed major path of ontogeny and differentiation in each model. Cell colors are matched to their proposed origins. For example, whereas model 1 considers the contribution of FL monocytes unlikely, models 2 and 3 propose that these cells represent the main precursors of fetal M populations, with the exception of microglia, which arise predominantly from cMyb‐independent YS M From (Ginhoux and Guilliams, 2016).
These discordant results on microglia ontogeny from the currently available inducible fate‐mapping mouse models reveals the difficulty of performing in utero labeling of specific hematopoietic populations that all arise within a very narrow temporal window during development (Bertrand et al., 2005b; Ferrero et al., 2018). Also, we have to always keep in mind that during embryonic development, the time of mouse mating (plug time) does not always mean the exact fertilization time of the eggs. Even within the same litter, up to 20 hours difference can be observed in the development stage of individual embryos. Thus, a better understanding of molecular signature restricted to each wave of hematopoietic progenitors and the identification of new markers specific for each waves is required to fully address the microglia ontogeny process.
1.3.4 Factors that regulate the development of M in the embryo
It is important to clearly understand the factors which are involved in embryonic M development, because they contribute to tissue resident M in the adult and more importantly, because modification/defects of early embryonic progenitors, such as microglia progenitors, have been linked to the development of neurodevelopmental and/or neuropsychiatric disorders at later stages (Chen et al., 2010; Mass et al., 2017). CSF‐1 and its receptor CSF‐1R is very important for the differentiation of adult M. Ginhoux et al. confirmed that CSF‐1R is expressed in early embryonic microglia and YS MHe showed that deletion of CSF‐1R, but not that of CSF‐1, greatly reduces the production of YS M leading to the absence of microglia (Ginhoux et al., 2010). Similarly, Langerhans cells are absent from Csf1r KO mice, but present in Csf1 op/op mice. Further in‐depth analysis of microglia and Langerhans cells formation confirmed that another ligand for CSF‐1R, IL‐34, is required for the homeostasis of microglia and Langerhans cells (Greter et al., 2012; Wang et al., 2012). Another growth factor shown to be required for M development is the transforming growth
25 factor‐β (TGF‐β). Butovsky et al. have demonstrated that TGF‐β signaling pathway is required for adult microglia to keep their characteristic molecular signature and that microglia are absent in TGF‐β1–deficient mice (Butovsky et al., 2014). Yu et al. showed that TGF‐βR signaling is also required for the development of embryonic alveolar M and for their maintenance during adult life (Yu et al., 2017).
Experiments from Schulz et al. have shown that cMyb is required for the development of HSC derived M whereas it is dispensable for YS myelopoiesis (Schulz et al., 2012). cMyb was previously suggested dispensable for unilineage primitive wave M generation but required for definitive hematopoiesis (Clarke et al., 2000), suggesting primitive wave Mare cMyb independent while EMP derived M are cMyb dependent (Ginhoux and Guilliams, 2016). Kierdorf et al. demonstrated that Pu.1 KO embryos lack microglia at E14, while IRF8 KO mice have a reduced number of microglia. Further analysis on YS A1 and A2 M progenitors proved that Pu.1 is required for A1 M progenitors generation and IRF8 is needed for the survival, differentiation from A1 to A2 (Kierdorf et al., 2013) and late stage Mmaturation (Hagemeyer et al., 2016).
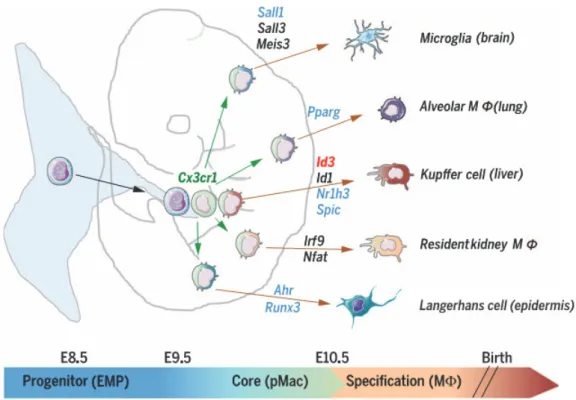
Benefiting from the Immunological Genome (ImmGen) Project (https://www.immgen.org/), immunologists discovered a core M signature and more importantly some genes specifically expressed by tissue specific resident M (Gautier et al., 2012). For example, Sall1 is very important for adult brain microglia identity (Buttgereit et al., 2016) and Id3 is important for liver Kupffer cell development (Mass et al., 2016), for more information please see Figure 9.
Engraftment experiments suggested that even if part of the microglia signature can be acquired by engrafted M/progenitors from other tissues (van de Laar et al., 2016), the core signature of tissue resident M cannot be recapitulated even after a long period of time, suggesting that both environmental and cell ontogeny intrinsic programs strictly control the function of each subsets of M (Bennett et al., 2018). Moreover, transcriptomic and epigenetic landscapes of engrafted M differ from host microglia and they show discrete responses to peripheral inflammation challenge, as compared to host microglia (Shemer et al., 2018). So, it is important to clarify the bone fide origin of each tissue resident M (Ginhoux and Guilliams, 2016).
Figure 9: Tissue resident M specification.
YS M progenitors colonize the FL and give rise to M precursors (pMacs) that acquire a core M transcriptional program and will colonize the embryo and initiated the expression of tissue‐specific transcriptional regulators, such as sall1 and sall3 for microglia, Id3 for Kupffer cell development. From (Mass et al., 2016).
1.4 HSC development and factors involvement
1.4.1 HSCs markers during development
HSCs are de novo generated within in the ventral part of the embryonic dorsal aorta (Bertrand et al., 2005a; Taoudi and Medvinsky, 2007). This generation process involves the transformation of a specific type of endothelial cells, called hemogenic endothelium, that gives rise to HSC through a process called endothelial to hematopoietic transition (EHT) (Ciau‐Uitz and Patient, 2016; Clements and Traver, 2013). The AGM contains a low number of HSC, calculated repopulating units after limiting dilution reconstitution experiments, which corresponds to alow HSC number at the early stage of their development. In vivo experiments have proved that
AGM HSC are able to sustain long term reconstitution of hematopoiesis when transplanted into
adult mice with B, T cell and NK cell deficiency (Arora et al., 2014; Cumano et al., 2001; Vo et al.,
27 Indeed, HSCs are a rare population of cells during both development (Kumaravelu et al., 2002;
Morrison et al., 1995) and adult stage (Benz et al., 2012), it counts less than 1 in 10, 000 cells
from the tissue/organ where they reside. Purifying authentic HSC from heterogeneous cellular populations is necessary to understand the features of those extremely rare and precious cells and promote their therapeutic application. Since the first purification methods available for transplantable HSCs with the help of fluorescence‐activated cell sorting system, extensive research has been applied to perfect the purification efficiency of HSC (Spangrude et al., 1988). Many studies during the past few decades have attempted to identify their specific markers, and now flow cytometry based strategies coupled with stringent LTR assay (secondary transplantation competitive, limiting dilution) have made it possible to sort HSC with high purity in mice (Benz et al., 2012; Kim et al., 2006).
HSCs from different stages of development exhibit quite different phenotypic and cell cycle features. Embryonic HSC shows very high proliferation rate, with 95 and 100% of HSCs actively cycling during embryonic development, while more than 90% of HSC remain quiescent in the adult (Pietras et al., 2011).
Researchers have shown that multipotent HSCs in E10.5 AGM express c‐Kit, AA4.1, CD31, low level of CD41, and are mainly negative for CD45 (Bertrand et al., 2005a) and positive for vascular endothelial cadherin (VE‐cadherin) (Rybtsov et al., 2014). Later, at E11, they will express CD45 (Zhou et al., 2016a). From E12.5, the site enriched for HSC is the FL where HSCs expand dramatically. At this time, they are enriched in the Lin‐Sca‐1+c‐Kit+ CD201+ VE‐cadherin+
Mac‐1/CD11blow population (McKinney‐Freeman et al., 2012; Zhou et al., 2016a), where Lin‐
indicates the negative expression of markers specific for mature cells in various lineages, such as Ter119 for erythrocytes, CD19 for B cells and CD3 for T cells. Mac‐1/CD11b, which is used as a Lin‐ marker for myeloid cells in the adult, cannot be used at early stages of FL hematopoiesis because researchers have shown that embryonic HSCs express low level of Mac‐1/CD11b (Hills et al., 2011; Kim et al., 2005; Morrison et al., 1995). From E13.5, HSCs share a common
phenotype with adult bone marrow HSCs, being enriched in the Lin‐CD45+Sca‐1+
c‐Kit+CD201+CD150+ CD48‐ population, called ESLAM (Benz et al., 2012; McKinney‐Freeman et al., 2012). (See Table1 for a summary of canonical HSC markers at different stages of mouse development).
Despite the increasing knowledge about HSCs development, the exact fate decision of HSC generation and the precise underlying molecular mechanism that control HSC are not fully understood. Here, I will introduce some aspects regarding the development of HSC during ontogeny relating to inflammatory signals and transcription factors.
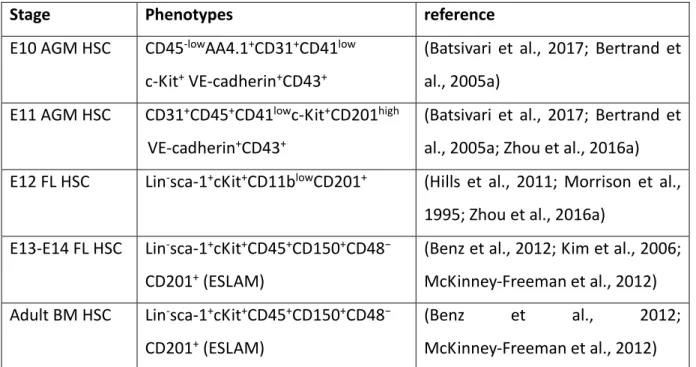
Table 1: Canonical markers for murine hematopoietic stem cells at different developmental stages.
Stage Phenotypes reference
E10 AGM HSC CD45‐lowAA4.1+CD31+CD41low
c‐Kit+ VE‐cadherin+CD43+
(Batsivari et al., 2017; Bertrand et al., 2005a)
E11 AGM HSC CD31+CD45+CD41lowc‐Kit+CD201high
VE‐cadherin+CD43+
(Batsivari et al., 2017; Bertrand et al., 2005a; Zhou et al., 2016a)
E12 FL HSC Lin‐sca‐1+cKit+CD11blowCD201+ (Hills et al., 2011; Morrison et al.,
1995; Zhou et al., 2016a) E13‐E14 FL HSC Lin‐sca‐1+cKit+CD45+CD150+CD48−
CD201+ (ESLAM)
(Benz et al., 2012; Kim et al., 2006; McKinney‐Freeman et al., 2012) Adult BM HSC Lin‐sca‐1+cKit+CD45+CD150+CD48−
CD201+ (ESLAM)
(Benz et al., 2012;
McKinney‐Freeman et al., 2012)
1.4.2 Hematopoietic transcription factors involved in HSC development
The great interest in stem cell–based therapies have emphasized the importance of understanding the molecular mechanisms by which cells choose their fate and mature/differentiate towards a particular lineage. In hematopoiesis, the specification of mesoderm cells to HSCs is precisely controlled by cell intrinsic and extrinsic factors. Among them, cell intrinsic transcription factors play a pivotal role in controlling the progression of the hematopoiesis landscape (Porcher et al., 2017). During past few decades, plenty of work has been focused on identifying transcription factors that govern HSCs specification, maintenance and differentiation and researchers have established several key regulators of the HSCs program (Wilson et al., 2009).
The basic helix‐loop‐helix (bHLH) transcription factor, T‐cell acute lymphocytic leukemia 1 (Tal1/Scl) has been classified as a master regulator of hematopoiesis because it is absolutely required for the specification of YS progenitors and HSCs (Robb et al., 1995; Shivdasani et al.,