HAL Id: hal-01515818
https://hal-enpc.archives-ouvertes.fr/hal-01515818
Submitted on 3 May 2017
HAL is a multi-disciplinary open access archive for the deposit and dissemination of sci-entific research documents, whether they are pub-lished or not. The documents may come from teaching and research institutions in France or abroad, or from public or private research centers.
L’archive ouverte pluridisciplinaire HAL, est destinée au dépôt et à la diffusion de documents scientifiques de niveau recherche, publiés ou non, émanant des établissements d’enseignement et de recherche français ou étrangers, des laboratoires publics ou privés.
Mechanical behaviour of a small-scale energy pile in
saturated clay
Neda Yavari, Anh Minh Tang, Jean-Michel Pereira, Ghazi Hassen
To cite this version:
Neda Yavari, Anh Minh Tang, Jean-Michel Pereira, Ghazi Hassen. Mechanical behaviour of a small-scale energy pile in saturated clay. Geotechnique, Thomas Telford, 2016, 66 (11), pp.878 - 887. �10.1680/jgeot.15.T.026�. �hal-01515818�
General Paper
1 2 3
Mechanical behaviour of a small-scale energy pile in
4
saturated clay
5
Neda YAVARI, Anh Minh TANG, Jean-Michel PEREIRA, Ghazi HASSEN 6
7 8
Université Paris-Est, Laboratoire Navier (UMR CNRS 8205)
9 10 11
Corresponding author:
12
Dr. Anh Minh TANG 13
Université Paris-Est 14
Laboratoire Navier/Géotechnique (CERMES) 15
Ecole des Ponts ParisTech 16
6-8 avenue Blaise Pascal, Cité Descartes, Champs-sur-Marne 17 77455 Marne-la-Vallée 18 France 19 20 Email : [email protected] 21 Phone : +33 1 64 15 35 63 22 Fax : +33 1 64 15 35 62 23 24
Main Text Click here to download Main Text Yavari et al R4.docx
1 2 3 4 5 6 7 8 9 10 11 12 13 14 15 16 17 18 19 20 21 22 23 24 25 26 27 28 29 30 31 32 33 34 35 36 37 38 39 40 41 42 43 44 45 46 47 48 49 50 51 52 53 54 55 56 57 58 59 60 61
Abstract
25
The mechanical behaviour of an energy pile in saturated clay under thermo-26
mechanical loading was studied using a model pile. Axial load was first applied to the 27
pile head in steps to determine the resistance of the pile under mechanical load.
28
Afterwards, thermo-mechanical tests were performed by applying a heating/cooling
29
cycle to the pile under constant axial load. The results show pile head heave during
30
heating and settlement during cooling. Irreversible settlement was observed after the 31
thermal cycles. Tests performed with various axial loads show that the thermal
32
irreversible settlement is greater under a higher axial load. 33
34
Keywords: energy pile; small-scale model; saturated clay; creep; thermo-mechanical
35 load. 36 37 Number of words: 4526 38 Number of figures: 11 39 Number of tables: 0 40 1 2 3 4 5 6 7 8 9 10 11 12 13 14 15 16 17 18 19 20 21 22 23 24 25 26 27 28 29 30 31 32 33 34 35 36 37 38 39 40 41 42 43 44 45 46 47 48 49 50 51 52 53 54 55 56 57 58 59 60
1. Introduction
41
Energy piles are usually used in thermo-active foundations to transfer the mechanical load of 42
the building to the ground and to provide heat exchange between the same using a ground-43
source heat pump system (Brandl, 2006; de Moel et al., 2010; Brandl, 2013; Mimouni & 44
Laloui, 2014; Olgun et al., 2014). Full-scale tests on the thermo-mechanical behaviour of 45
energy piles show that the temperature changes can modify stress and strain in the piles 46
(Laloui et al., 2003; Bourne-Webb et al., 2009; Amatya et al., 2012; McCartney & Murphy, 47
2012; Murphy et al., 2014; Wang et al., 2014). Reduced-scale tests on energy piles in sand 48
show sometimes contradictory trends: their shaft resistance decreased in capacity after 49
thermal loading was introduced, after Wang et al. (2011), while Ng et al. (2015) found an 50
increase of shaft resistance after heating. Stewart & McCartney (2013) found that the 51
behaviour of a scale-model energy foundation tested in a geotechnical centrifuge during 52
transient heating and cooling, agrees well with observation on full-scale end-bearing energy 53
foundations reported in the literature. Numerical simulations reveal that the effect of 54
temperature on the mechanical behaviour of the piles is mainly related to its thermal 55
expansion/contraction (Laloui et al., 2006; Péron et al., 2011; Yavari et al., 2014a). 56
57
However, it is well known that temperature might slightly modify the mechanical properties 58
of saturated clay (Cekerevac & Laloui, 2004; Hueckel et al., 2011; Hong et al., 2013; Laloui et 59
al., 2014). In addition, irreversible volume change of soil induced by temperature variations
60
(i.e. contraction of normally consolidated clay during heating, see Abuel-Naga et al. 2007) 61
may have significant effects on the undrained shear strength of the soil, which may affect 62
the foundation capacity during rapid loading. Also, heating could induce a small decrease of 63
the shear strength of clay/concrete interface (Di Donna & Laloui, 2013; Murphy & 64 1 2 3 4 5 6 7 8 9 10 11 12 13 14 15 16 17 18 19 20 21 22 23 24 25 26 27 28 29 30 31 32 33 34 35 36 37 38 39 40 41 42 43 44 45 46 47 48 49 50 51 52 53 54 55 56 57 58 59 60 61
McCartney, 2014). As a result, beside the thermal expansion/contraction of the piles, other 65
phenomena should be considered as well when studying the mechanical behaviour of 66
energy piles in clay. Conducting full-scale tension load tests, Akrouch et al. (2014) found that 67
heating increases the creep rate of energy piles in high plasticity clay. 68
Beside direct effects of temperature changes, the impact of cyclic heating/cooling on energy 69
piles has been studied in various works. Ng et al. (2014) performed centrifuge modelling of 70
energy piles subjected to heating/cooling cycles in saturated clay under constant working 71
load and observed cumulating irreversible displacement (thermo-mechanical ratcheting) 72
over five thermal cycles. This irreversible settlement reached 3.8% of pile diameter in lightly 73
overconsolidated clay and 2.1% of pile diameter in heavily overconsolidated clay. Yavari et 74
al. (2014b) found that a heating/cooling cycle applied on a model pile inserted in dry sand
75
under constant axial load induced an irreversible displacement of around 2% of the pile 76
diameter. Amatya et al. (2012) analysed the results of several in situ experiments on energy 77
piles and concluded that heating/cooling cycles induce volume change of the energy piles, 78
which changes the pile-soil interaction. More precisely, the mobilized shaft resistance profile 79
of a mechanically loaded pile may undergo significant changes during thermal loading. After 80
Ng et al. (2014), beside the mobilisation of shaft resistance, thermo-mechanical ratcheting 81
can be attributed to a cumulating irreversible reduction of confining stress at the pile-soil 82
interface. 83
In the present work, the mechanical behaviour of energy piles in saturated clay is 84
investigated using a small-scale model. Heating/cooling cycles were performed under 85
various constant axial loads. The pile head axial displacement was monitored during these 86 thermo-mechanical loads. 87 88 1 2 3 4 5 6 7 8 9 10 11 12 13 14 15 16 17 18 19 20 21 22 23 24 25 26 27 28 29 30 31 32 33 34 35 36 37 38 39 40 41 42 43 44 45 46 47 48 49 50 51 52 53 54 55 56 57 58 59 60
2. Experimental method
89
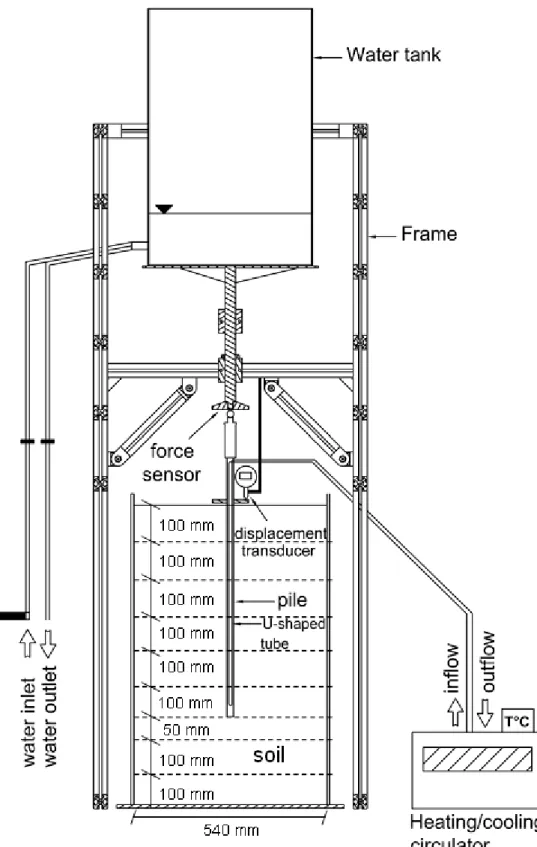
The experimental setup is presented in Figure 1. This system is similar to that used in Yavari 90
et al. (2014b). A pile was embedded in a container filled with saturated clay. The model pile
91
was a closed-end aluminium tube with outer and inner diameters of 20 and 18 mm, 92
respectively. The total length of the pile was 800 mm but only 600 mm was embedded in 93
soil. The pile was coated with a layer of Fontainebleau sand (median grain size of 0.23 mm) 94
by means of appropriate glue (Araldite). The added roughness will likely force failure to 95
occur in the clay, which is softer, rather than at the interface. 96
The axial load applied to the pile head was controlled by the water level in the tank. A force 97
sensor placed on the pile head measured pile head axial load. A displacement sensor 98
monitored the pile head settlement. A heating/cooling circulating bath (cryostat) allowed 99
the control of the pile temperature. Its internal reservoir was filled with water and 100
connected to an aluminium U-shaped tube (2 mm internal diameter) inside the pile. The pile 101
was filled with water to ensure the thermal transfer between the U-shaped tube and the 102
pile. One temperature sensor was inserted inside the pile to monitor its temperature during 103
the experiments. Note that the pile temperature will not be homogenous but it may be an 104
appropriate assumption for the nature of the analysis in the present study. 105
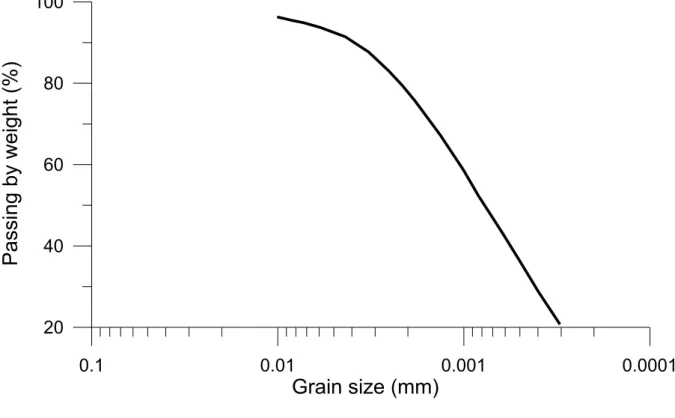
Kaolin clay was used in this study. Its particle size distribution, obtained by laser diffraction 106
method, is shown in Figure 2. It has a liquid limit of 57%, a plastic limit of 33%, and a particle 107
density of 2.60 Mg/m3. More details about this material can be found in the work of
108
Muhammed (2015). The soil powder was mixed with distilled water to a water content of 109
29% and then stored in hermetically sealed boxes for more than 24 h to ensure moisture 110
homogenisation. Soil compaction started with three layers of 100, 100 and 50 mm. A 111 1 2 3 4 5 6 7 8 9 10 11 12 13 14 15 16 17 18 19 20 21 22 23 24 25 26 27 28 29 30 31 32 33 34 35 36 37 38 39 40 41 42 43 44 45 46 47 48 49 50 51 52 53 54 55 56 57 58 59 60 61
vibratory hammer was used to compact the soil to a dry density of 1.45 Mg/m3 (that
112
corresponds to a degree of saturation of 95% and a void ratio of 0.79). After the compaction 113
of the first three layers, the pile was installed and the remaining soil was compacted around 114
the pile by 100 mm thick layers. Attention was paid to ensure the homogeneity of soil next 115
to the pile without touching the pile during soil compaction. Compaction layers are 116
materialised using dashed lines in Figure 1. It should be noted that the average dry density of 117
each compaction layer is controlled by the mass of soil used for compaction and the volume 118
of the layer (thickness and diameter). Compacting the clay sample by several layers was 119
chosen as an appropriate method to ensure its homogeneity prior to testing. Once 120
compaction was finished, saturation was started by injecting water from the bottom of the 121
container with a pressure of 20 kPa. To do so, the water tank was filled with water and its 122
bottom was connected to the bottom of the soil container. At the end of the saturation, the 123
level of water decrease and the final pressure was approximately 15 kPa. During this period, 124
the water tank was blocked to avoid applying any force on the pile head. The soil surface 125
was also covered with a thin layer of water and a plastic film to avoid water evaporation. 126
This condition was maintained for 10 months until the estimated volume of water intake 127
exceeded the initial air-filled pore volume. The soil was then assumed to be fully saturated. 128
Measurement of the pile head displacement and visual inspection of the soil surface show 129
that the soil surface did not move during saturation. Evaluation of the effects of saturation 130
on the clay microstructure was not investigated. Note that Ng et al. (2014) consolidated 131
kaolin clay slurry in order to obtain saturated clay sample for small-scale test but centrifuge 132
was required to accelerate the consolidation process. In the present work, consolidation was 133
not possible at 1-g condition. For this reason, compaction method was chosen to prepare 134
the clay sample. 135 1 2 3 4 5 6 7 8 9 10 11 12 13 14 15 16 17 18 19 20 21 22 23 24 25 26 27 28 29 30 31 32 33 34 35 36 37 38 39 40 41 42 43 44 45 46 47 48 49 50 51 52 53 54 55 56 57 58 59 60
After saturation of the soil mass, the pile was first subjected to mechanical loading tests. 136
Axial load was increased from 0 to 100 N, and then by increments of 50 N. Each increment 137
was kept for 60 min. Loading was continued until failure, corresponding to a pile head 138
settlement of 10% of the pile diameter (2 mm). Two mechanical tests, F1 and F2, were 139
conducted using this loading procedure to check the repeatability of the experimental 140
procedure. It should be noted that regarding the complexity of the compaction and 141
saturation procedures, all the tests in this study were conducted on a single pile embedded 142
at the centre of a single soil mass. This process was adopted following the work of Akrouch 143
et al. (2014). An interval of two weeks between two subsequent mechanical tests was
144
imposed to allow the equilibrium of stress state after each test. The initial states of the 145
subsequent mechanical tests were then assumed to be similar. 146
After the mechanical tests, five thermo-mechanical tests were performed. Each test includes 147
the following steps: (i) Increase of axial load to a given value which was maintained during 148
the subsequent thermal cycle; (ii) Heating the pile from 22°C to 27°C; (iii) Cooling the pile to 149
22°C; (iv) Cooling the pile to 17°C; (v) Heating the pile to its initial temperature (22°C); (vi) 150
Remove the axial load at 22°C. The pile temperature was maintained at 22°C until the 151
subsequent test started. Each step took 120 min, except the last one, which was longer (800 152
min). Five thermo-mechanical tests, denoted by F3, F4, F5, F6 and F7, were performed at 153
100 N, 150 N, 200 N, 250 N and 300 N, respectively. This procedure allowed starting all the 154
thermo-mechanical tests at the same pile temperature (22°C) and the duration of the last 155
step (800 min) was assumed to be long enough to ensure the recovery of the system. That 156
allows also performing one test per 24h and the five tests (F3-F7) in a week. 157 3. Experimental results 158 1 2 3 4 5 6 7 8 9 10 11 12 13 14 15 16 17 18 19 20 21 22 23 24 25 26 27 28 29 30 31 32 33 34 35 36 37 38 39 40 41 42 43 44 45 46 47 48 49 50 51 52 53 54 55 56 57 58 59 60 61
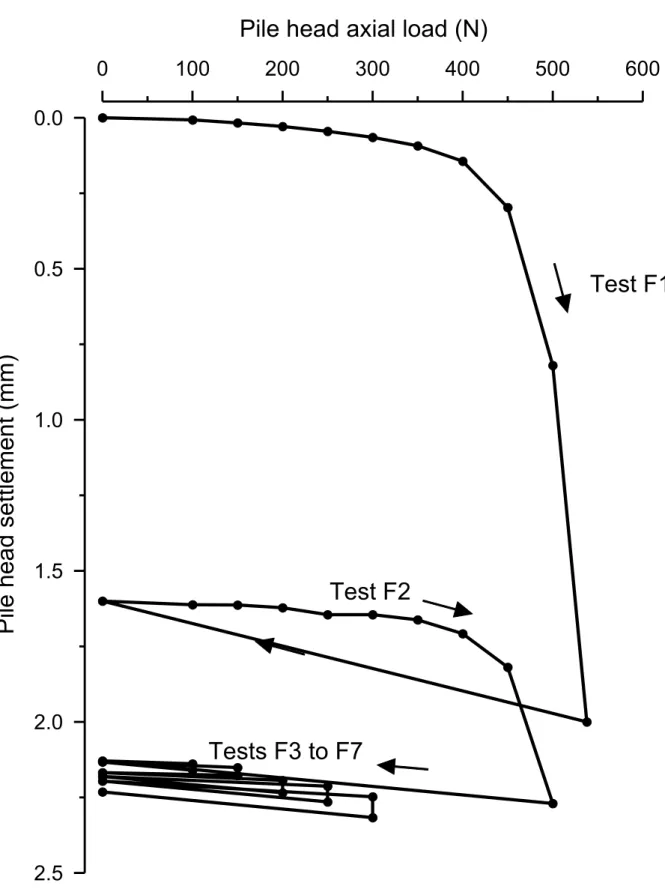
As all the tests were performed using a single soil mass and a single model pile, the global 159
response of the soil/pile system is first examined via load settlement curves of the entire 160
tests in Figure 3. The results show the permanent downward movement of the pile in the 161
soil, which is more explicit under purely mechanical loading (tests F1 and F2). From the 162
results of test F1 and considering 2 mm (10% of pile’s outer diameter) as the pile settlement 163
at failure, the pile’s resistance can be estimated at 500-550 N. Test F2 was stopped 164
intentionally before failure. 165
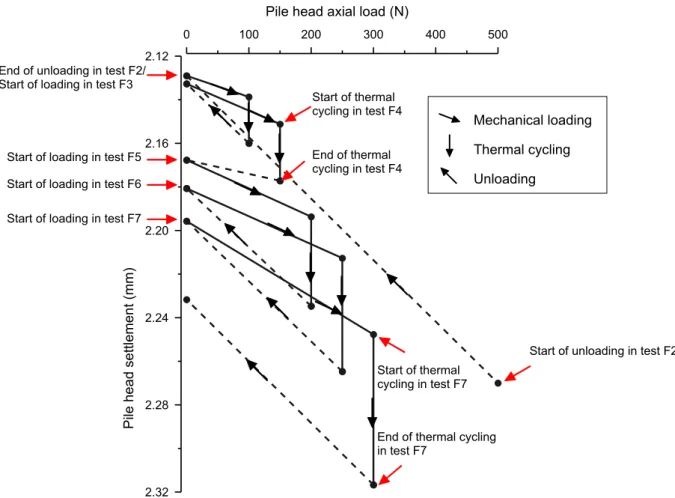
In Figure 4, the load-settlement curves of the thermo-mechanical tests (F3 to F7), which 166
followed pile unloading in test F2, are shown at a larger scale. In each test, the pile response 167
exhibits approximately the same stiffness during mechanical loading. The pile continues to 168
settle during the applied thermal cycle under constant load. Unloading the pile leads to pile 169
heave. The slope of the unloading branch is the same in all thermo-mechanical tests, except 170
for test F4, which seems to be affected by a measurement problem. Also, the slope of the 171
unloading branch in test F2 is identical to the corresponding phase of other tests. 172
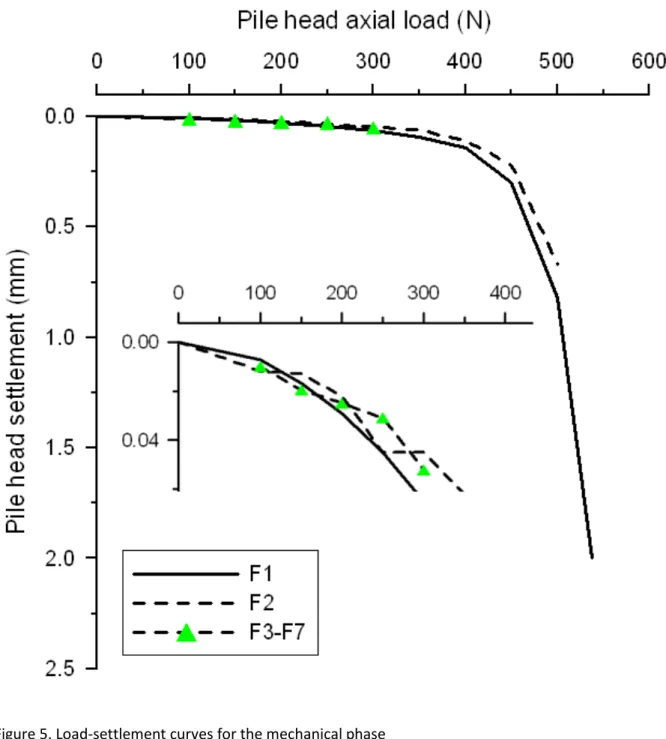
The pile behaviour in each individual test was then investigated. The pile settlement was 173
therefore zeroed (in the results analysis and not in the test) at the beginning of each test. 174
The pile head displacement curves of all the tests are plotted versus the pile head axial load 175
in Figure 5. The results relating to tests F3 to F7 are the pile response after the application of 176
the mechanical load and just before starting thermal cycling. A good repeatability of the 177
load-settlement curves can be observed, even when the figure is zoomed at a small range of 178
settlement (from 0 to 0.06 mm). 179
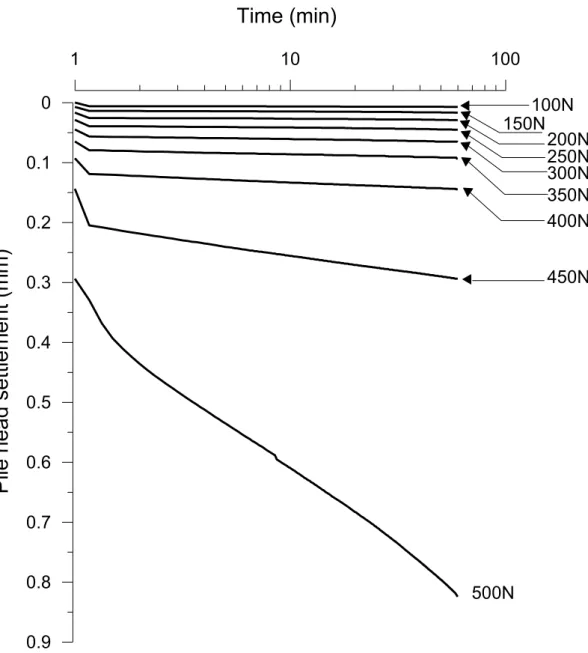
The results of mechanical test F1 are presented in Figure 6, where the pile head settlement 180
is plotted versus elapsed time for each loading step. That shows a quick settlement after the 181 1 2 3 4 5 6 7 8 9 10 11 12 13 14 15 16 17 18 19 20 21 22 23 24 25 26 27 28 29 30 31 32 33 34 35 36 37 38 39 40 41 42 43 44 45 46 47 48 49 50 51 52 53 54 55 56 57 58 59 60
load increase, followed by a stabilisation phase. As could be observed, for all the loading 182
steps, the relationship between the settlement change and time (in a logarithmic scale) is 183
linear under each loading step for t = 2 to 60 min. The creep rate could then be determined 184
from the slope of each curve in Figure 5, based on the French standard (Afnor, 1999). 185
Following this standard, for each loading step, the creep rate is calculated as the change of 186
pile head displacement between 2 and 60 min (of elapsed time) divided by log(60/2). 187
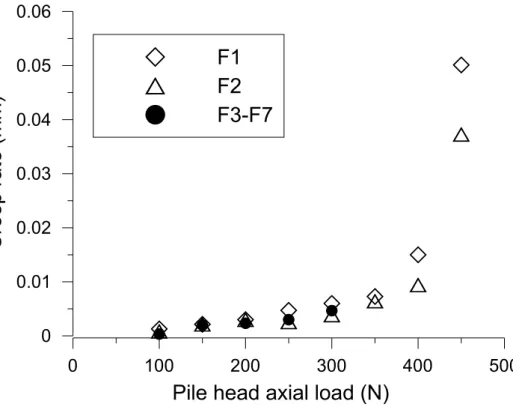
In Figure 7, the creep rate is plotted versus the axial load for all the tests. Note that in tests 188
F1 and F2, the same procedure was followed (loading by steps), while in tests F3-F7, the 189
target axial load was applied in one step. In spite of these different procedures, the 190
relationships between the creep rate and the axial load are found to be similar in all tests; 191
the creep rate increases quickly when the axial load exceeds 400 N. The fact that this rate 192
depends only on the axial load and that it is independent of the loading path proves that it 193
corresponds solely to creep and not to soil consolidation. After Edil & Mochtar (1988), the 194
time-dependent displacement of a pile inserted in clay under a constant axial load is 195
attributed primarily to creep of the pile-soil interface (slip) and shear creep of the soil 196
surrounding the pile. 197
The load and the temperature of the pile measured in tests F3 to F7 are plotted in Figure 8. 198
As explained above, from its initial temperature (around 22°C) after mechanical loading, the 199
pile was heated to 27°C, cooled to 22°C, then cooled to 17°C, and finally heated to 22°C. The 200
results show that the duration of each step (120 min) is long enough to bring the pile’s 201
temperature to the target value. During these heating/cooling steps, the pile head axial load 202
was maintained constant (from t = 0 to 600 min) by keeping the same water level in the 203
water tank (see Figure 1). However the load measured by the force sensor appeared not to 204
be perfectly constant. This blip in load reading can be explained by the small friction 205 1 2 3 4 5 6 7 8 9 10 11 12 13 14 15 16 17 18 19 20 21 22 23 24 25 26 27 28 29 30 31 32 33 34 35 36 37 38 39 40 41 42 43 44 45 46 47 48 49 50 51 52 53 54 55 56 57 58 59 60 61
between the rod, which transfers the water tank load to the pile head, and the frame that 206
supports it. Heating the pile induces a pile head heave. In this case, the measured load 207
corresponds to the water tank load plus the friction force. Inversely, cooling the pile induces 208
a pile head settlement, and the load measured corresponds to the water tank load minus 209
the friction force. These changes, in the order of a few Newtons, can be ignored in this 210
study. 211
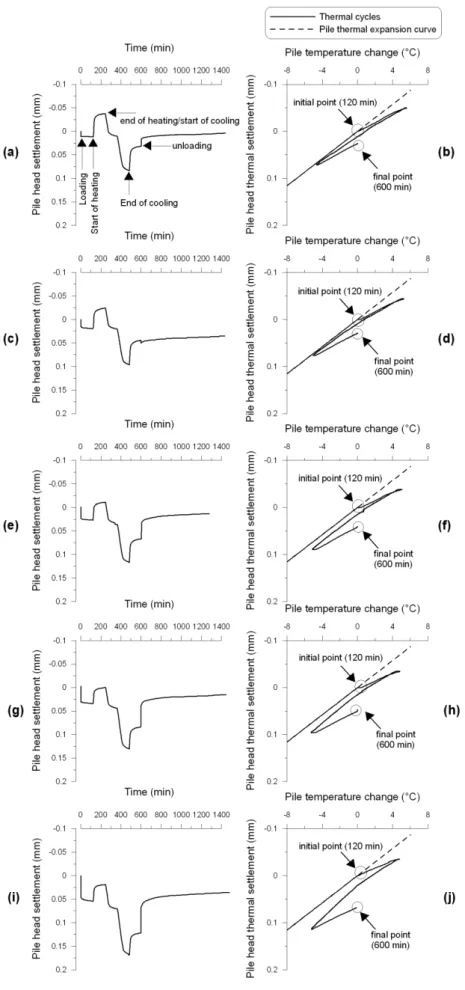
The results of tests F3-F7 are shown in Figure 9. Pile head settlement versus elapsed time is 212
shown in Figure 9(a, c, e, g, i) for the whole test including mechanical loading, thermal cycle, 213
and mechanical unloading. The pile settles under the mechanical load in the first 120 min of 214
the test. It begins to heave while being heated from 22°C to 27°C. It settles during the 215
subsequent cooling down to 17°C and heaves again during the last heating which increases 216
the temperature back to 22°C. The final unloading (when the axial load is removed at t = 600 217
min) induces a pile head heave. The time allocated to each thermal stage (120 min) may not 218
be suitable for a relatively low-permeability material but the results show that the pile head 219
displacement seems reached equilibrium at the end of each stage. 220
The change of pile head settlement versus change of temperature during the thermal cycle 221
(between 120 min and 600 min in Figure 9a, c, e, g and i) is exhibited in Figure 9b, d, f, h, and 222
j. The thermal expansion curve of an aluminium pile, having a fixed toe and being free to
223
expand/contract in other directions, is also plotted. Its slope is equal to the linear thermal 224
expansion coefficient of aluminium (23×10-6/°C). This representation is similar to that used
225
by Kalantidou et al. (2012), Yavari et al. (2014), and Ng et al. (2014). The experimental 226
results show that the pile reacts immediately to temperature change and heaves with the 227
first heating; however its heave is smaller than that of the pile thermal expansion curve. It 228 1 2 3 4 5 6 7 8 9 10 11 12 13 14 15 16 17 18 19 20 21 22 23 24 25 26 27 28 29 30 31 32 33 34 35 36 37 38 39 40 41 42 43 44 45 46 47 48 49 50 51 52 53 54 55 56 57 58 59 60
settles when it is cooled. Under 100 N of axial load (Fig 8b), the slope of the cooling branch is 229
close to that of the heating. This slope seems higher at higher pile head loads and looks 230
similar to the pile thermal expansion curve under 300 N (Fig 8f). The pile heaves during the 231
second heating phase; the slopes of the two heating branches are almost equal. 232
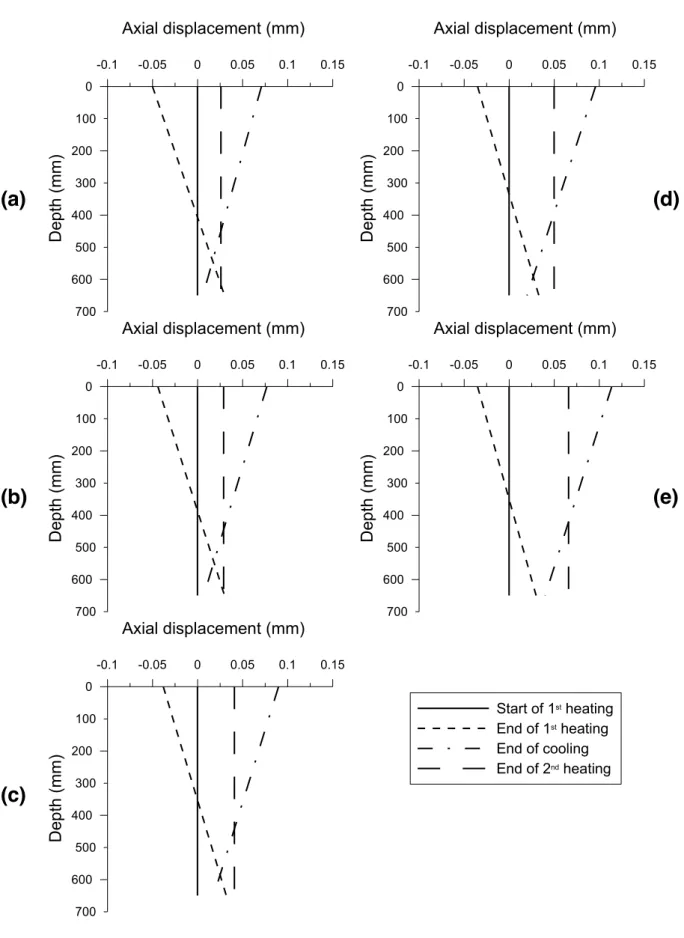
For further analysis of the pile displacement, the axial displacement distribution was plotted 233
for each thermo-mechanical test (similar analysis have been done by Di Donna & Laloui, 234
2015; Rotta Loria et al., 2015). The end of the mechanical loading (start of 1st heating) was
235
taken as the reference, with an axial displacement equal to zero along the pile. The first 236
heating induced a pile head heave (in the figure, the axial displacement at 0 mm depth is 237
taken equal to the measured pile head heave at the end of the first heating). The thermal 238
expansion strain of the pile during this heating of 5°C is equal to 5×23×10-6 =115×10-6, where
239
23×10-6 is the coefficient of thermal expansion of the pile. The stress change during heating
240
along the pile was not measured in this study. However, as the pile head load was fixed 241
during heating, the axial load along the pile can be reasonably assumed to be smaller than 242
20% of the maximal load (300 N). This assumption can be justified from other tests under 243
similar conditions, i.e. heating a floating pile under constant pile head load (Bourne-Webb et 244
al., 2009; Ng et al., 2015). The maximal axial stress change (20% of the maximal load divided
245
by the pile section) along the pile during heating can then be estimated as 246
20%×300/(0.01×0.01×3.14) = 19×104 Pa. That corresponds to an axial strain (axial stress
247
divided by the pile equivalent Young modulus) of 19×104/13×109 = 15×10-6 (where 13×109 Pa
248
is the equivalent Young modulus of the pile following Yavari et al., 2014a). This estimation 249
shows that the axial displacement along the pile related to the stress change during heating 250
can be ignored compared to the thermal expansion. The distribution of the axial 251
displacement along the pile can then be estimated from the pile head displacement 252 1 2 3 4 5 6 7 8 9 10 11 12 13 14 15 16 17 18 19 20 21 22 23 24 25 26 27 28 29 30 31 32 33 34 35 36 37 38 39 40 41 42 43 44 45 46 47 48 49 50 51 52 53 54 55 56 57 58 59 60 61
(measured) and the pile thermal expansion calculated (see Figure 10). The results show that 253
the pile toe settles during the first heating. The subsequent cooling induces heave at the pile 254
toe except the case of the highest pile head load (F7), where settlement of the pile toe was 255
observed. In addition, the higher the pile head load, the lower the pile toe’s heave during 256
cooling. The second heating induces a settlement at the pile toe for all the tests. These 257
trends are similar to that observed by Pasten & Santamarina (2014), using numerical 258
modelling. 259
In Figure 11, the pile head settlement induced by thermal cycling (between 120 min and 600 260
min) is plotted versus the applied pile head axial load for each test. From the creep rate, 261
shown in Figure 6, the settlement related to the creep during this period can be estimated. 262
Note that Cui et al. (2009) showed that the temperature can significantly influence the time 263
dependent behaviour of clay but their tests were performed in a large range of temperature 264
(from 25°C to 80°C). In the present work, the temperature change is much smaller (from 265
17°C to 27°C) and the pile head settlement related to creep (smaller than 0.005 mm for each 266
period) is small compared to that related to the mechanical loading (see Figure 11). As a 267
consequence, effects of temperature on creep settlement can be ignored. The settlement 268
directly related to the thermal cycle can then be estimated: corrected value is the measured 269
value minus the creep value (calculated from isothermal mechanical tests, see Figure 7). The 270
results show that the settlement related to the thermal cycle is higher when the pile is 271
subjected to a higher axial load. 272
4. Discussion
273
The results obtained on the mechanical loading part (Figures 5 and 7) show a good 274
repeatability between the tests. The same settlement curve of the pile in all tests indicates 275 1 2 3 4 5 6 7 8 9 10 11 12 13 14 15 16 17 18 19 20 21 22 23 24 25 26 27 28 29 30 31 32 33 34 35 36 37 38 39 40 41 42 43 44 45 46 47 48 49 50 51 52 53 54 55 56 57 58 59 60
that the behaviour of the pile in one test is independent of the previous one. That suggests 276
that the soil/pile system could have retrieved its initial equilibrium condition prior to the 277
subsequent test. Actually, the pile has been loaded to failure during test F1 (Figure 3). For 278
the subsequent test (F2), the pile shaft resistance would decrease due to the possible 279
softening of the shear behaviour at the clay/pile interface (see Di Donna et al. 2016; Yavari 280
et al. 2016). On the contrary, the pile toe resistance would increase if the clay consolidates
281
after test F1. On one hand, the two mechanisms have opposite effects on the pile response; 282
on the other hand, they could be negligible (because the clay has been already well 283
compacted and the softening observed on a similar material by Yavari et al. 2016 is quite 284
small under low stresses). That would explain why the mechanical response of the pile 285
during test F2 is quite similar to that during test F1 (see Figure 5), suggesting that the waiting 286
stage after failure test is sufficient for the clay to recover its initial mechanical properties. 287
The choice of performing various tests in a unique mass of saturated clay can thus be 288
considered as an appropriate one. 289
It should be noted that the irreversible settlement observed during the thermal cycle is 290
larger at a higher axial load. While testing dry sand, Kalantidou et al. (2012) and Yavari et al. 291
(2014b) found that the effect of thermal cycle under constant axial load was reversible under 292
low loads (smaller than 30% of the pile resistance) and irreversible under high loads. In the 293
present work, where tests were performed within a wide range of axial load (from 20% to 294
60% of the pile’s resistance), irreversible settlement is observed even at low loads (100 N 295
corresponds to less than 20% of the pile resistance, which is between 500 and 550 N). Ng et 296
al. (2014) have also observed irreversible settlement after thermal cycles under constant
297
load at 40% of the pile’s resistance. However, in the work of Ng et al. (2014), thermo-298
mechanical ratcheting was observed to level off after few thermal cycles. In the present 299 1 2 3 4 5 6 7 8 9 10 11 12 13 14 15 16 17 18 19 20 21 22 23 24 25 26 27 28 29 30 31 32 33 34 35 36 37 38 39 40 41 42 43 44 45 46 47 48 49 50 51 52 53 54 55 56 57 58 59 60 61
work, only one thermal cycle was applied and such phenomenon could not be observed. 300
Concerning accumulated thermal displacement, Ng et al. (2014) obtained 2.1% and 3.8% of 301
pile diameter after five cycles. In the present work, the irreversible thermal settlement 302
obtained after one cycle was smaller that 0.5% of the pile diameter, which is in agreement 303
with the work of Ng et al. (2014). 304
Beside experimental works, irreversible settlement of energy piles subjected to thermal 305
cycles has also been investigated through numerical modelling. Suryatriyastuti et al. (2014) 306
used a load transfer approach to study the cyclic behaviour of energy pile and found that 307
thermo-mechanical ratcheting observed under thermal cycle could be predicted by 308
considering a cyclic strain hardening/softening mechanism at the soil/pile interface. 309
However, in the work of Pasten & Santamarina (2014), the main features of energy piles 310
subjected to static load and thermal cycles (i.e. irreversible settlement after thermal cycles 311
and displacement accumulation depending on the static factor of safety) were reproduced 312
by numerical simulations without considering the cyclic strain hardening/softening 313
mechanism. Actually, the authors explained the irreversible settlement by the decrease of 314
mobilised shaft shear stress with thermal cycles. Saggu & Chakraborty (2015) simulated the 315
cyclic thermo-mechanical behaviour of a floating energy pile in sand, and found an 316
irreversible settlement only for the first heating/cooling cycle. The subsequent cycles induce 317
an irreversible uplift of the pile. 318
In the present work, only one heating/cooling cycle was applied for each loading step. 319
Thermo-mechanical ratcheting was observed for all the tests. In addition, this settlement is 320
higher at a higher mechanical load. The mechanisms by which thermal cycles affect the pile 321
behaviour can be explained from the profile of axial displacement shown in Figure 10. 322 1 2 3 4 5 6 7 8 9 10 11 12 13 14 15 16 17 18 19 20 21 22 23 24 25 26 27 28 29 30 31 32 33 34 35 36 37 38 39 40 41 42 43 44 45 46 47 48 49 50 51 52 53 54 55 56 57 58 59 60
Actually, after the mechanical loading, the first heating induces a pile expansion. This latter 323
corresponds to a pile head heave (that was measured from the experiments) and a pile toe 324
settlement. The pile toe settlement is induced by the reduction of the pile shaft resistance, 325
which increases the load transfer to the pile toe (see Pasten & Santamarina, 2014). The 326
subsequent cooling induces a pile contraction, which induces a pile head settlement 327
(measured experimentally) and a pile toe heave (except for the case at high load, F7, where 328
a pile toe settlement was expected). It should be also noted that the pile toe heave during 329
cooling is lower at a higher mechanical load. Finally, the second heating, which brings the 330
pile back to its initial temperature, induces again a pile toe settlement. The total pile toe 331
settlement after the thermal cycle is positive and higher at a higher mechanical load. To 332
explain these results, the pile toe settlement can be attributed to two mechanisms: (i) the 333
compression of the clay below the pile toe; (ii) the displacement of the pile related to 334
shearing of the clay surrounding the pile toe. If the first mechanism can be expected to be 335
almost reversible, the second one is most likely irreversible. The observed thermo-336
mechanical ratcheting can then be attributed to the second mechanism (shearing of the clay 337
surrounding the pile toe). 338
The thermally induced irreversible settlement could become significant in the design of 339
energy piles in saturated clay. When all the piles of the foundation are equipped with the 340
heat exchanger system, additional settlement of the foundation can be expected with 341
seasonal temperature change of piles. When only a part of foundation piles is equipped with 342
the heat exchanger system, cycles of temperature applied to these piles would reduce 343
progressively their axial load while the axial load in the non-equipped piles increases, thus 344
leading to redistributions of loads among the different piles. 345 1 2 3 4 5 6 7 8 9 10 11 12 13 14 15 16 17 18 19 20 21 22 23 24 25 26 27 28 29 30 31 32 33 34 35 36 37 38 39 40 41 42 43 44 45 46 47 48 49 50 51 52 53 54 55 56 57 58 59 60 61
5. Conclusion
346
Thermo-mechanical loading was applied to a model pile in saturated clay. The pile head axial 347
load, displacement and temperature were monitored. Analysis of the experimental results 348
shows that: 349
- Under mechanical loading, the creep rate (of the pile head displacement) increases as 350
the pile head load approaches to pile ultimate resistance but remains negligible at 351
low pile head load. 352
- Under a constant pile head axial load, heating the pile induces pile head heave while 353
cooling induces settlement. This behaviour is mainly related to the thermal 354
expansion/contraction of the pile. 355
- Irreversible settlement of the pile head is observed after the heating/cooling cycle 356
under constant pile head axial load. This settlement is larger under higher axial loads, 357
and is much more significant than that due to creep under isothermal conditions. 358
The findings of this study, observed on a model pile, would be helpful when considering the 359
long-term mechanical behaviour in the design of energy piles in saturated clay. Actually, 360
seasonal piles temperature change could induce additional settlement of the foundation or 361
redistribution of foundation load on the piles. 362
6. Acknowledgement
363
The authors would like to express their great appreciation to the French National Research 364
Agency for funding the present study, which is part of the project PiNRJ “Geotechnical 365
aspects of foundation energy piles” – ANR 2010 JCJC 0908 01. 366 7. References 367 1 2 3 4 5 6 7 8 9 10 11 12 13 14 15 16 17 18 19 20 21 22 23 24 25 26 27 28 29 30 31 32 33 34 35 36 37 38 39 40 41 42 43 44 45 46 47 48 49 50 51 52 53 54 55 56 57 58 59 60
Abuel-Naga, H.M., Bergado, D.T., Bouazza, A. & Ramana, G.V. (2007). Volume change 368
behaviour of saturated clays under drained heating conditions : experimental results 369
and constitutive modeling. Canadian Geotechnical Journal 44, 942 – 956. 370
AFNOR (1999). Essai statique de pieu sous effort axial. NF P 94-150. 371
Akrouch, G., Sánchez, M. & Briaud, J. (2014). Thermo-mechanical behavior of energy piles in 372
high plasticity clays. Acta Geotechnica 6, 503–519. 373
Amatya, B. L., Soga, K., Bourne-Webb, P. J., Amis, T. & Laloui, L. (2012). Thermo-mechanical 374
behaviour of energy piles. Géotechnique 62, No. 6, 503–519. 375
Bourne-Webb, P. J., Amatya, B., Soga, K., Amis, T., Davidson, C. & Payne, P. (2009). Energy 376
pile test at Lambeth College, London: geotechnical and thermodynamic aspects of pile 377
response to heat cycles. Géotechnique 59 No. 3, 237–248. 378
Brandl, H. (2006). Energy foundations and other thermo-active ground structures. 379
Géotechnique 56, No. 2, 81–122.
380
Brandl, H. (2013). Thermo-active ground-source structures for heating and cooling. Procedia 381
Engineering 57, 9–18.
382
Cekerevac, C. & Laloui, L. (2004). Experimental study of thermal effects on the mechanical 383
behaviour of a clay. International Journal for Numerical and Analytical Methods in 384
Geomechanics 28, 209–228.
385
Cui, Y.J., Le, T.T., Tang, A.M., Delage, P. & Li, X.L. (2009). Investigating the time-dependent 386
behaviour of Boom clay under thermomechanical loading. Géotechnique 59, No. 4, 319 387 – 329. 388 1 2 3 4 5 6 7 8 9 10 11 12 13 14 15 16 17 18 19 20 21 22 23 24 25 26 27 28 29 30 31 32 33 34 35 36 37 38 39 40 41 42 43 44 45 46 47 48 49 50 51 52 53 54 55 56 57 58 59 60 61
De Moel, M., Bach, P. M., Bouazza, A., Singh, R. M. & Sun, J. O. (2010). Technological 389
advances and applications of geothermal energy pile foundations and their feasibility 390
in Australia. Renewable and Sustainable Energy Reviews 14, No. 9, 2683–2696. 391
Di Donna, A & Laloui, L. (2013). Advancements in the Geotechnical Design of Energy Piles. 392
International Workshop on Geomechanics and Energy, (November 2013), 26–28.
393
Di Donna, A. & Laloui, L. (2015). Numerical analysis of the geotechnical behaviour of energy 394
piles. Int. J. Numer. Anal. Meth. Geomech. 39, 861 – 888. 395
Di Donna, A., Ferrari, A. & Laloui, L. (2016). Experimental investigation of the soil-concrete 396
interface: physical mechanisms, cyclic mobilisation and behaviour at different 397
temperatures. Canadian Geotechnical Journal (doi: 10.1139/cgj-2015-0294). 398
Edil, T.B. & Mochtar, I.B. (1988). Creep response of model pile in clay. Journal of 399
Geotechnical Engineering 114, No. 11, 1245 – 1260.
400
Hong, P. Y., Pereira, J. M., Tang, A. M. & Cui, Y. J. (2013). On some advanced thermo-401
mechanical models for saturated clays. International Journal for Numerical and 402
Analytical Methods in Geomechanics 37, No. 17, 2952–2971.
403
Hueckel, T., Francois, B. & Laloui, L. (2011). Temperature-dependent internal friction of clay 404
in a cylindrical heat source problem. Géotechnique, 61, No. 10, 831–844. 405
Kalantidou, A., Tang, A. M., Pereira, J.-M. & Hassen, G. (2012). Preliminary study on the 406
mechanical behaviour of heat exchanger pile in physical model. Géotechnique 62, No. 407 11, 1047–1051. 408 1 2 3 4 5 6 7 8 9 10 11 12 13 14 15 16 17 18 19 20 21 22 23 24 25 26 27 28 29 30 31 32 33 34 35 36 37 38 39 40 41 42 43 44 45 46 47 48 49 50 51 52 53 54 55 56 57 58 59 60
Laloui, L., Moreni, M. & Vulliet, L. (2003). Comportement d’un pieu bi-fonction, fondation et 409
échangeur de chaleur. Canadian Geotechnical Journal 40, No. 2, 388–402. 410
Laloui, L., Nuth, M. & Vulliet, L. (2006). Experimental and numerical investigations of the 411
behaviour of a heat exchanger pile. International Journal for Numerical and Analytical 412
Methods in Geomechanics 30, No. 8, 763–781.
413
Laloui, L., Olgun, C. G., Sutman, M., McCartney, J. S., Coccia, C. J., Abuel-Naga, H. M. & 414
Bowers, G. A. (2014). Issues involved with thermoactive geotechnical systems: 415
characterization of thermomechanical soil behavior and soil-structure interface 416
behavior. DFI Journal: The Journal of the Deep Foundations Institute 8, No. 2, 108–120. 417
McCartney, J. S. & Murphy, K. D. (2012). Strain Distributions in Full-Scale Energy Foundations 418
( DFI Young Professor Paper Competition 2012 ). DFI Journal: The Journal of the Deep 419
Foundations Institute 6, No. 2, 26–38.
420
Mimouni, T. & Laloui, L. (2014). Towards a secure basis for the design of geothermal piles. 421
Acta Geotechnica 9, 355 – 366.
422
Muhammed, R.D. (2015). Etude en chambre d’étalonnage du frottement sol-pieu sous grands 423
nombres de cycles. Applications au calcul des fondations profondes dans les sols fins
424
saturés. PhD thesis of Université Pierre Marie Curie, 204 pages.
425
Murphy, K. D. & McCartney, J. S. (2014). Thermal Borehole Shear Device. Geotechnical 426
Testing Journal 37, No. 6, 20140009.
427
Murphy, K. D., McCartney, J. S. & Henry, K. S. (2014). Evaluation of thermo-mechanical and 428
thermal behavior of full-scale energy foundations. Acta Geotechnica 10, 179-195. 429 1 2 3 4 5 6 7 8 9 10 11 12 13 14 15 16 17 18 19 20 21 22 23 24 25 26 27 28 29 30 31 32 33 34 35 36 37 38 39 40 41 42 43 44 45 46 47 48 49 50 51 52 53 54 55 56 57 58 59 60 61
Ng, C. W. W., Shi, C., Gunawan, A. & Laloui, L. (2014). Centrifuge modelling of energy piles 430
subjected to heating and cooling cycles in clay. Géotechnique Letters 4, 310 –316. 431
Ng, C. W. W., Shi, C., Gunawan, A., Laloui, L. & Liu, H.L. (2015). Centrifuge modelling of 432
heating effects on energy pile performance in saturated sand. Can. Geotech. J. 52, 433
1045 – 1057. 434
Olgun, C.G., Ozudogru, T.Y., Abdelaziz, S.L. & Senol, A. (2014). Long-term performance of 435
heat exchanger piles. Acta Geotechnica 10, No. 5, 553 – 569. 436
Pasten, C. & Santamarina, C. (2014). Thermally Induced Long-Term Displacement of 437
Thermoactive Piles. J. Geotech. Geoenviron. Eng., 140(5): 06014003 438
Péron, H., Knellwolf, C. & Laloui, L. (2011). A method for the geotechnical design of heat 439
exchanger piles. Geo-Frontiers 2011, 470–479. 440
Rotta Loria, A.F., Gunawan, A., Shi, C., Laloui, L. & Ng, W.W.C. (2015). Numerical modelling of 441
energy piles in saturated sand subjected to thermo-mechanical loads. Geomechanics 442
for Energy and the Environment 1, 1 – 15.
443
Saggu, R. & Chakraborty, T. (2015). Cyclic Thermo-Mechanical Analysis of Energy Piles in 444
Sand. Geotech Geol Eng 33, 321–342 445
Stewart, M.A. & McCartney, J.S. (2013). Centrifuge modelling of soil-structure interaction in 446
energy foundations. Journal of Geotechnical and Geoenvironmental Engineering 140, 447
No. 4, 04013044. 448
Suryatriyastuti, M.E., Mroueh, H. & Burlon, B., 2014. A load transfer approach for studying 449
the cyclic behavior of thermo-active piles. Computers & Geotechnics 55, 378 – 391. 450 1 2 3 4 5 6 7 8 9 10 11 12 13 14 15 16 17 18 19 20 21 22 23 24 25 26 27 28 29 30 31 32 33 34 35 36 37 38 39 40 41 42 43 44 45 46 47 48 49 50 51 52 53 54 55 56 57 58 59 60
Wang, B., Bouazza, A. & Haberfield, C. (2011). Preliminary observation from laboratory scale 451
model geothermal pile subjected to thermo-mechanical loading. Geo-Frontiers 2011, 452
430 – 439. 453
Wang, B., Bouazza, A., Singh, R. M., Haberfield, C., Barry-macaulay, D. & Baycan, S. (2014). 454
Posttemperature Effects on Shaft Capacity of a Full-Scale Geothermal Energy Pile. 455
Journal of Geotechnical and Geoenrironmental Engineering 141, No. 4, 04014125.
456
Yavari, N., Tang, A. M., Pereira, J.-M. & Hassen, G. (2014a). A simple method for numerical 457
modelling of energy pile’s mechanical behaviour. Géotechnique Letters 4, 119–124. 458
Yavari, N., Tang, A. M., Pereira, J.-M. & Hassen, G. (2014b). Experimental study on the 459
mechanical behaviour of a heat exchanger pile using physical modelling. Acta 460
Geotechnica 9, No. 3, 385 – 398.
461
Yavari, N., Tang, A. M., Pereira, J.-M. & Hassen, G. (2016). Effect of temperature on the shear 462
shear strength of soils and soil/structure interface. Canadian Geotechnical Journal (doi: 463 10.1139/cgj-2015-0355) 464 465 466 1 2 3 4 5 6 7 8 9 10 11 12 13 14 15 16 17 18 19 20 21 22 23 24 25 26 27 28 29 30 31 32 33 34 35 36 37 38 39 40 41 42 43 44 45 46 47 48 49 50 51 52 53 54 55 56 57 58 59 60 61
List of captions
467
Figure 1. Experimental set-up 468
Figure 2. Grain size distribution curve of kaolin clay 469
Figure 3. Pile load-settlement curve obtained through 7 successive tests F1 to F7 470
Figure 4. Pile load-settlement curve obtained through tests F3 to F7 471
Figure 5. Load-settlement curves for the mechanical phase 472
Figure 6. Results of test F1 – Pile head settlement versus elapsed time for each loading step 473
Figure 7. Creep rate versus axial load for the mechanical phase 474
Figure 8. Axial load and temperature of the pile in tests: (a) F3; (b) F4; (c) F5; (d) F6; (e) F7. 475
Figure 9. Results of tests F3-F7 for the thermal phase – Pile head settlement and pile temperature 476
change: (a, b) F3; (c, d) F4; (e, f) F5; (g, h) F6; (i, J) F7. 477
Figure 10. Results of tests F3-F7 for the thermal phase - Axial displacement along the pile: (a) F3; (b) 478
F4; (c) F5; (d) F6; (e) F7. 479
Figure 11. Results of tests F3-F7 for the thermal phase - Pile head settlement versus pile head axial 480 load 481 1 2 3 4 5 6 7 8 9 10 11 12 13 14 15 16 17 18 19 20 21 22 23 24 25 26 27 28 29 30 31 32 33 34 35 36 37 38 39 40 41 42 43 44 45 46 47 48 49 50 51 52 53 54 55 56 57 58 59 60
482
Figure 1. Experimental set-up
483 1 2 3 4 5 6 7 8 9 10 11 12 13 14 15 16 17 18 19 20 21 22 23 24 25 26 27 28 29 30 31 32 33 34 35 36 37 38 39 40 41 42 43 44 45 46 47 48 49 50 51 52 53 54 55 56 57 58 59 60 61
0.1 0.01 0.001 0.0001
Grain size (mm)
20 40 60 80 100P
as
si
ng
b
y
w
ei
gh
t (
%
)
484 485Figure 2. Grain size distribution curve of kaolin clay
486 487 488 489 490 1 2 3 4 5 6 7 8 9 10 11 12 13 14 15 16 17 18 19 20 21 22 23 24 25 26 27 28 29 30 31 32 33 34 35 36 37 38 39 40 41 42 43 44 45 46 47 48 49 50 51 52 53 54 55 56 57 58 59 60
0
100
200
300
400
500
600
Pile head axial load (N)
2.5
2.0
1.5
1.0
0.5
0.0
P
ile
h
ea
d
se
ttl
em
en
t (
m
m
)
Test F1
Test F2
Tests F3 to F7
491Figure 3. Pile load-settlement curve obtained through 7 successive tests F1 to F7 492 1 2 3 4 5 6 7 8 9 10 11 12 13 14 15 16 17 18 19 20 21 22 23 24 25 26 27 28 29 30 31 32 33 34 35 36 37 38 39 40 41 42 43 44 45 46 47 48 49 50 51 52 53 54 55 56 57 58 59 60 61
0 100 200 300 400 500
Pile head axial load (N)
2.32 2.28 2.24 2.20 2.16 2.12 P ile h ea d se ttl em e nt ( m m )
Start of unloading in test F2 End of unloading in test F2/
Start of loading in test F3
Start of loading in test F5 Start of loading in test F6
Start of loading in test F7
Start of thermal cycling in test F7
End of thermal cycling in test F7 Mechanical loading Thermal cycling Unloading Start of thermal cycling in test F4 End of thermal cycling in test F4 493
Figure 4. Pile load-settlement curve obtained through tests F3 to F7 494 495 1 2 3 4 5 6 7 8 9 10 11 12 13 14 15 16 17 18 19 20 21 22 23 24 25 26 27 28 29 30 31 32 33 34 35 36 37 38 39 40 41 42 43 44 45 46 47 48 49 50 51 52 53 54 55 56 57 58 59 60
496
Figure 5. Load-settlement curves for the mechanical phase 497 498 1 2 3 4 5 6 7 8 9 10 11 12 13 14 15 16 17 18 19 20 21 22 23 24 25 26 27 28 29 30 31 32 33 34 35 36 37 38 39 40 41 42 43 44 45 46 47 48 49 50 51 52 53 54 55 56 57 58 59 60 61
1 10 100
Time (min)
0.9 0.8 0.7 0.6 0.5 0.4 0.3 0.2 0.1 0P
ile
h
ea
d
se
ttl
em
e
nt
(
m
m
)
100N 150N 200N 250N 300N 350N 450N 500N 400N 499Figure 6. Results of test F1 – Pile head settlement versus elapsed time for each loading step
500 501 1 2 3 4 5 6 7 8 9 10 11 12 13 14 15 16 17 18 19 20 21 22 23 24 25 26 27 28 29 30 31 32 33 34 35 36 37 38 39 40 41 42 43 44 45 46 47 48 49 50 51 52 53 54 55 56 57 58 59 60
0 100 200 300 400 500
Pile head axial load (N)
0 0.01 0.02 0.03 0.04 0.05 0.06
C
re
ep
r
at
e
(m
m
)
F1
F2
F3-F7
502Figure 7. Creep rate versus axial load for the mechanical phase
503 504 505 506 507 508 509 1 2 3 4 5 6 7 8 9 10 11 12 13 14 15 16 17 18 19 20 21 22 23 24 25 26 27 28 29 30 31 32 33 34 35 36 37 38 39 40 41 42 43 44 45 46 47 48 49 50 51 52 53 54 55 56 57 58 59 60 61
0 200 400 600 800 1000 1200 1400 Time (min) 10 20 30 40 P ile te m p er at ur e (° C ) 0 100 200 300 P ile h ea d ax ia l l oa d ( N ) (a) (b) (c) (d) (e) 0 200 400 600 800 1000 1200 1400 Time (min) 10 20 30 40 P ile te m pe ra tu re ( °C ) 0 100 200 300 P ile h ea d ax ia l l oa d (N ) 0 200 400 600 800 1000 1200 1400 Time (min) 10 20 30 40 P ile te m pe ra tu re ( °C ) 0 100 200 300 P ile h ea d a xi al lo ad ( N ) 0 200 400 600 800 1000 1200 1400 Time (min) 10 20 30 40 P ile te m p er at ur e (° C ) 0 100 200 300 P ile h ea d ax ia l l oa d ( N ) 0 200 400 600 800 1000 1200 1400 Time (min) 10 20 30 40 P ile te m pe ra tu re ( °C ) 0 100 200 300 P ile h ea d ax ia l l oa d (N )
Pile head axial load Pile temperature
510
Figure 8. Axial load and temperature of the pile in tests: (a) F3; (b) F4; (c) F5; (d) F6; (e) F7.
511 1 2 3 4 5 6 7 8 9 10 11 12 13 14 15 16 17 18 19 20 21 22 23 24 25 26 27 28 29 30 31 32 33 34 35 36 37 38 39 40 41 42 43 44 45 46 47 48 49 50 51 52 53 54 55 56 57 58 59 60
512
Figure 9. Results of tests F3-F7 for the thermal phase – Pile head settlement and pile temperature change: (a,
513 b) F3; (c, d) F4; (e, f) F5; (g, h) F6; (i, J) F7. 514 1 2 3 4 5 6 7 8 9 10 11 12 13 14 15 16 17 18 19 20 21 22 23 24 25 26 27 28 29 30 31 32 33 34 35 36 37 38 39 40 41 42 43 44 45 46 47 48 49 50 51 52 53 54 55 56 57 58 59 60 61
-0.1 -0.05 0 0.05 0.1 0.15 Axial displacement (mm) 600 400 200 0 700 500 300 100 D ep th ( m m ) -0.1 -0.05 0 0.05 0.1 0.15 Axial displacement (mm) 600 400 200 0 700 500 300 100 D ep th ( m m ) -0.1 -0.05 0 0.05 0.1 0.15 Axial displacement (mm) 600 400 200 0 700 500 300 100 D ep th ( m m ) -0.1 -0.05 0 0.05 0.1 0.15 Axial displacement (mm) 600 400 200 0 700 500 300 100 D ep th ( m m ) -0.1 -0.05 0 0.05 0.1 0.15 Axial displacement (mm) 600 400 200 0 700 500 300 100 D ep th ( m m ) Start of 1st heating End of 1st heating End of cooling End of 2nd heating
(a)
(b)
(c)
(d)
(e)
515Figure 10. Results of tests F3-F7 for the thermal phase - Estimated axial displacement along the pile: (a) F3;
516 (b) F4; (c) F5; (d) F6; (e) F7. 517 518 1 2 3 4 5 6 7 8 9 10 11 12 13 14 15 16 17 18 19 20 21 22 23 24 25 26 27 28 29 30 31 32 33 34 35 36 37 38 39 40 41 42 43 44 45 46 47 48 49 50 51 52 53 54 55 56 57 58 59 60
519
Figure 11. Results of tests F3-F7 for the thermal phase - Pile head settlement versus pile head axial load
520 521 522 523 1 2 3 4 5 6 7 8 9 10 11 12 13 14 15 16 17 18 19 20 21 22 23 24 25 26 27 28 29 30 31 32 33 34 35 36 37 38 39 40 41 42 43 44 45 46 47 48 49 50 51 52 53 54 55 56 57 58 59 60 61