HAL Id: hal-03104449
https://hal.archives-ouvertes.fr/hal-03104449
Submitted on 8 Jan 2021
HAL is a multi-disciplinary open access
archive for the deposit and dissemination of
sci-entific research documents, whether they are
pub-lished or not. The documents may come from
teaching and research institutions in France or
abroad, or from public or private research centers.
L’archive ouverte pluridisciplinaire HAL, est
destinée au dépôt et à la diffusion de documents
scientifiques de niveau recherche, publiés ou non,
émanant des établissements d’enseignement et de
recherche français ou étrangers, des laboratoires
publics ou privés.
Tom Vincent-Dospital, Alain Steyer, François Renard, Renaud Toussaint
To cite this version:
Tom Vincent-Dospital, Alain Steyer, François Renard, Renaud Toussaint. Frictional anisotropy of
3D-printed fault surfaces. Frontiers in Earth Science, 2021. �hal-03104449�
Tom Vincent-Dospital,1, 2,∗ Alain Steyer,1 Fran¸cois Renard,3, 4 and Renaud Toussaint1, 2,†
1
Universit´e de Strasbourg, ITES UMR 7063, Strasbourg F-67084, France
2SFF Porelab, The Njord Centre, Department of physics, University of Oslo, N-0316 Oslo, Norway 3
The Njord Centre, Department of Geosciences, University of Oslo, N-0316 Oslo, Norway
4
Universit´e Grenoble Alpes, Universit´e Savoie Mont Blanc, CNRS, IRD, IFSTTAR, ISTerre, 38000 Grenoble, France
(Dated: January 7, 2021)
The surface morphology of faults controls the spatial anisotropy of their frictional properties, and hence their mechanical stability. Such anisotropy is only rarely studied in seismology models of fault slip, although it might be paramount to understand the seismic rupture in particular areas, notably where slip occurs in a direction different from that of the main striations of the fault. To quantify how the anisotropy of fault surfaces affects the friction coefficient during sliding, we sheared synthetic fault planes made of plaster of Paris. These fault planes were produced by 3D-printing real striated fault surfaces whose 3D roughness was measured in the field at spatial scales from millimeters to meters. Here, we show how the 3D-printing technology can help for the study of frictional slip. Results show that fault anisotropy controls the coefficient of static friction, with µS//, the friction coefficient along the striations being three to four times smaller than µS⊥, the
friction coefficient along the orientation perpendicular to the striations. This is true both at the meter and the millimeter scales. The anisotropy in friction and the average coefficient of static friction are also shown to decrease with the normal stress applied to the faults, as a result of the increased surface wear under increased loading.
I. INTRODUCTION
Faults in the Earth’s crust are complex systems along which earthquakes nucleate and propagate [1]. Faults hold structures and heterogeneities at all scales [2–4]. While they are often simplified to their simplest two-dimensional description (i.e., the fault plane), increas-ing complexity is now added to faults models [5]. It is indeed considered that, to fully understand seismic-ity in various areas [6–13], it is paramount to account for some disorder in the faults frictional properties such as secondary faulting, off-fault damage or roughness of the fault plane. For instance, the volume of damaged rocks, during the activation of a fault, depends on the initial contact roughness [14] and, thus, a fault with a stronger roughness presents a different energy budget than a flat fault, as more energy is converted into surface area en-ergy. In particular, roughness encourages the triggering of local events, but is believed to prevent the propagation of large-slip earthquakes [13]. Additionally, large scale roughness tends to inhibit the propagation of any rup-ture faster than the shear wave velocity of surrounding rocks [15].
Another degree of complexity is more rarely considered when modelling geological contacts and fault slip: the possible anisotropy in their frictional properties. Mor-phological anisotropy is a known feature of faults, no-tably impacting the seismic waves velocity in their vicin-ity [16–18] or the mobility of natural and injected flu-ids [19] in the subsurface. Frictional anisotropy,
interest-∗[email protected] †[email protected]
ingly, is also regularly studied in other fields than seis-mology, for instance the tribology of rubber tires [20,21], the strength of advanced adhesives [22], or the mitigation of water condensation [23]. It is also considered to play a major role in nature [24], for instance in the motion of numerous animals [22,25,26] and the hydration of some plants [27, 28]. In most cases, frictional anisotropy de-rives from the existence of preferential topographical ori-entations on, at least, one of the contact surfaces [29,30]. The length scale for such structural directivity can be as small as micrometer [31] to nanometer [32, 33].
In seismic faults, such preferential orientations in their topography are observed at all scales [2–4] and originate from several processes. At the molecular level, rock form-ing crystals may display some frictional anisotropy. It is notably the case for antigorite [34], a mineral abun-dant in the Earth’s upper mantle. At the mesoscopic scale, the shear strength of foliated rocks is known to be anisotropic [35, 36], due to the oriented planes in their constitutive mineralogy. Fault zones in sedimen-tary basins are initiated by early fractures that often propagate in layered sediments. It can result [37] in an anisotropic ramp-flat morphology of these fracture surfaces. For more mature faults having accumulated enough displacement, and above a given length scale [38], the topography of the fault planes is also marked by slip induced wear, with striations and grooves of various wavelengths and amplitudes [39, 40] oriented along the main direction of slip. If such morphological anisotropy of fault surfaces is well-known, its effect on the anisotropy of the frictional properties remains to be characterised. Such a characterisation of frictional anisotropy could also be of interest for other types of rock contacts than strictly seismic faults, in particular for shallow rock joints and
fractures [41–44], whose three-dimensional geometry is key in geotechnical engineering and for the structural sta-bility of many man-made constructions.
Here, we study how the morphology of faults controls the static coefficient of friction and the anisotropy of fric-tion with regards to the main stress orientafric-tion during slip. To reach this goal, we produce 3D-prints of actual faults surfaces whose topography was measured in the field [45]. We perform friction experiments with plaster of Paris casts of these 3D-printed faults. Results show that the coefficient of static friction along faults is highly anisotropic, a property that should henceforward be con-sidered in numerical models of slip on seismic faults. We also show that this anisotropy is stress dependent, and should decrease with depth (e.g., [46]).
II. 3D PRINTING AND PLASTER CASTING OF FAULT PLANES
The actual morphology of natural faults can be diffi-cult to assess, even if their long wavelength structures can be inferred by surface or subsurface imaging tech-niques [40, 47, 48]. Yet, some fault planes are accessi-ble to direct, high resolution, measurements, notably as they were exhumed by erosion and tectonic processes. For this study, we have used a series of digital fault sur-faces. These fault roughness data were acquired with Light Detection And Ranging (LiDAR), laboratory laser profilometry, or white light interferometry techniques [3]. These data are available on an online public database [45], and in a repository with a doi number [49]. Should the reader hold some similar data, these authors welcome additions to this database. We have specifically selected fault roughness measurements performed on the Corona Heights fault [11] that outcrops near the Peixotto play-ground in San Francisco, California. These data cover surface areas with spatial scales in the range of millime-ters to memillime-ters. Figures1and2show the fault surface at two spatial scales, one surface at the meter scale, defined on a 5 mm×5 mm grid, and one surface at the millimeter scale, defined on a 2 µm×2 µm grid. We will further on refer to these two surfaces as respectively Sm and Smm.
Already, one can notice some preferential orientations in these topographies, and that the amplitude of fault roughness is, relatively to their size, somewhat larger at smaller scales (Smm) than at larger scales (Sm) [50].
For our tests, we chose to limit these anisotropic surfaces to a circular sample geometry. We also applied a mild running-window median filter to smooth out spikes in the measured surfaces that could be associated to measure-ment noise. The window length of the filter was 10 space steps, accounting for 5 cm for Smand for 20 µm for Smm.
In order to run the friction experiments, we generated some opposing surfaces to the ones presented in Figs. 1
and 2. These opposing surfaces could not be measured, as the actual fault walls that were facing Smand Smmare
now eroded. To reconstruct them, we have applied the
FIG. 1. Topography (i.e. roughness) of the Corona Heights fault at the meter scale [45,49]. This surface, called Sm, has
a radius of 1 m and is defined on a 5 mm grid with a 1.25 mm elevation resolution. A parametric angle θ is defined from the main groove orientation.
FIG. 2. White light interferometry measurement of the to-pography of the Corona Heights fault plane at the millimeter scale [45,49]. This surface, called Smm, has a radius of 1.5 mm
and is defined on a 2 µm grid with a 0.025 µm elevation reso-lution. A parametric angle θ is defined from the main groove orientation.
following transformation to the 3D coordinates (X, Y, Z) of Smand Smm:
X0∼ X Y0∼ −Y Z0∼ −Z,
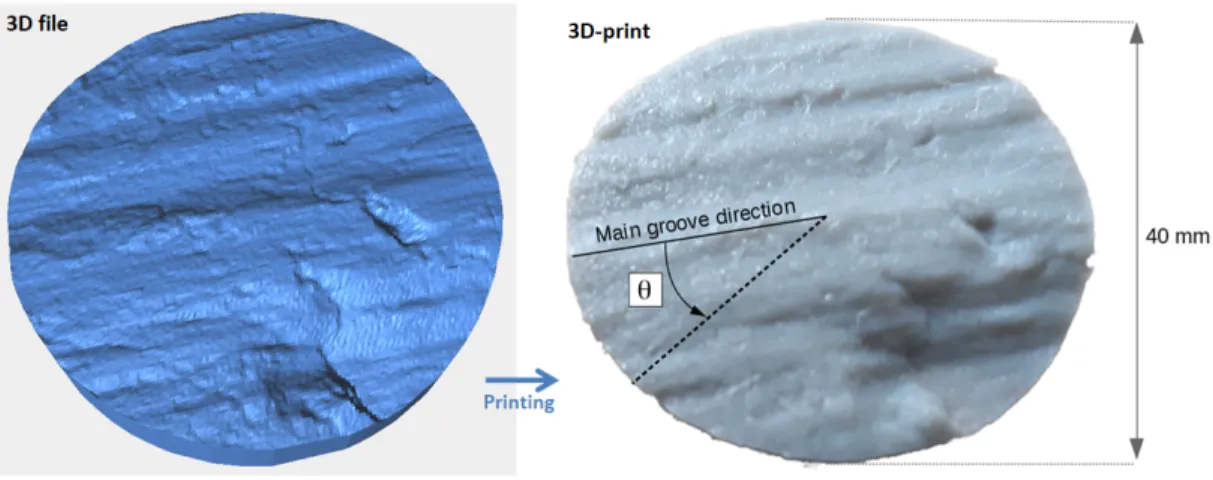
FIG. 3. (Left): 3D file (STL file) obtained from the measured topography of the Smfault. The four 3D files generated for our
friction experiments (Sm, Smmand their respective complementary) are available as Supplementary Material. (Right): Picture
of a Polylactic acid 3D-print of the Smfault.
where X0, Y0 and Z0 are the coordinates of the gener-ated opposing surfaces and (X, Y ) give the map location of a given surface point of elevation Z, as represented in Fig.1. We have thus assumed that the missing fault walls are complementary to the measured ones, so that, when pressed together before the friction tests, they form a bulk with negligible aperture between the two blocks. Such assumption for natural faults would only be partly verified. When having accumulated enough slip, a gran-ular layer of gouge material may there have formed, and
FIG. 4. Plaster faults made using the 3D-printed moulds (i.e., an example of which is shown in Fig.4). Left: Sm(top)
and its complementary surface (bottom). Right: Smm (top)
and its complementary surface (bottom). The samples have a diameter of 40 mm. One can appreciate that the fault at the millimeter scale (Smm) shows a higher roughness aspect than
at the meter scale (Sm).
the two opposing sliding surfaces may not always per-fectly match. However, our assumption is relevant for the youngest faults with a small amount of slip. We have also assumed that erosion did not significantly alter the fault plane, such that the measured topography is rep-resentative of the one of an actual buried fault. For the Corona Heights fault, this assumption is valid because the fault offsets silica-rich chert rocks with a high resis-tance to weathering.
After having obtained the surfaces, we isotropically (i.e., with the same factor in all directions) down- or up-scaled Smand Smmto fit a standard 4 cm diameter disk
that matches the clamp size of our shear deformation apparatus. We also re-gridded the surfaces to match the lateral resolution of our 3D-printer (Ultimaker2
Ex-tended+’ [52]) that has a nozzle size of 250 µm. The four surfaces (two fault surfaces and two opposing surfaces) were then 3D-printed into polylactic acid (PLA) mate-rial, as shown in Fig.3. It should be noted that, even when designed to be flat, printed objects can present a natural roughness [53], at a scale however smaller that the grooves observed on the printed faults. These intrin-sic imperfections shall be comparable to 60 µm, the ele-mentary thickness of the PLA layers deposited by our 3D printer. In comparison, the 2D standard deviation of the elevation in our printed objects topography are 0.66 mm for Sm and 1.7 mm for Smm. The maximal elevation of
these objects are, respectively, 3.7 mm and 8.3 mm. We thus consider that the small scale roughness (∼ 60 µm) from the printer’s limit in resolution has a second order effect on the frictional properties of the surfaces. Although we could have performed the friction exper-iments with the plastic pieces produced with the 3D printer, we have rather produced samples of plaster of Paris (gypsum) blocks moulded from the plastic faults. Plaster is known [54] to be a reasonable model of porous brittle materials, and the main goal of these casts was to work with a rock-like material, notably because plas-ter may wear and deform differently than plastic under
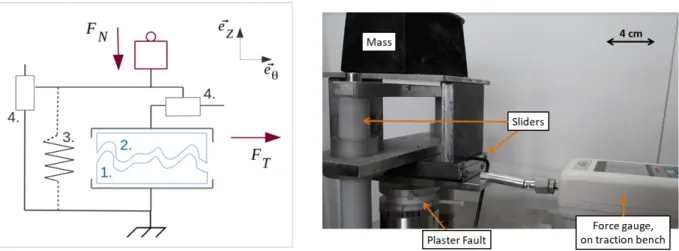
FIG. 5. Schematic (left) and picture (right) of the shear apparatus. It contains: the complementary plaster-casted fault surfaces (1 and 2) installed between two clamps; the compression spring (3) necessary to obtain a null normal loading when required (not mounted on the picture); and two horizontal and vertical sliders (4) used to force the motion in the direction of interest while allowing for vertical displacement. The shear force FT is applied on the top fault wall in the eθ direction, while the
bottom surface is kept fixed. It is measured by a Sauter®FH500N force gauge [51]. The normal force FN is applied by a dead
weight that acts oppositely to the eZ direction) on the top surface. For a visualisation purpose, the two plaster blocks (1 and
2) are offset vertically in the schematic, whereas in the experiments these two surfaces matched, with a quasi-null aperture.
shear. The fragile nature of plaster, and the potential friction-induced wear that the plaster was subjected to in our experiments, made us use new casts for each exper-imental realisation. The casts were generated with the following protocol: five volumes of water and eight vol-umes of powder of plaster of Paris were mixed and poured over the plastic moulds, then let to dry during one and half hour. The moulds, an example of which is shown in Fig.3, were sprayed before each cast with a thin layer of silicon grease to avoid some of the fine plaster details to stick to the plastic during the mould release. The last step in the casts preparation was to dry them in an oven at a temperature of 40◦C for one hour. As a result, we produced fault planes in blocks made of plaster of Paris, as shown in Fig.4.
III. EXPERIMENTAL SET-UP AND EXPERIMENTAL CONDITIONS
The shear apparatus used to perform the friction tests is shown in Fig.5. The two complementary surfaces are pressed together and mounted one on top of the other between the clamps of the shear apparatus. A normal force FN is applied on the top surface by using
ad-justable weights. In addition, a spring system of stiff-ness 625 N m-1 allows, if desired, to compensate for the machine empty weight of 13.7 N (i.e., the normal weight transmitted to the friction surfaces by the machine top clamp and structure and the top cast when no extra mass is used). A tangential driving shear force FT is then
ap-plied to the top fault wall in a given direction of the (X, Y ) plane. The amplitude of the force is measured by a Sauter® [51] force gauge. The shear orientation
is defined by the angle θ ∈ [0◦ 360◦] from the orienta-tion of main grooves on the fault surface, as defined in Figs. 1and2. A horizontal mechanical slider makes sure that the friction is evaluated in the direction of interest only, and a vertical slider allows upward or downward dis-placement of the top surface. While these sliders would ideally be perfectly lubricated, we have estimated their frictional resistance at the sliding velocity of our experi-ments, Fc= 4 N±0.5 N by performing a friction test with
no fault installed in the machine (that is, with only air between the two clamps represented in Fig.5).
FIG. 6. Typical tangential force versus time for a given slide angle (θ = 30°) and a given normal force (FN = 33.3 N)
applied to the Sm fault. From the local maximal value of
the tangential force, at the onset of slip, a friction coefficient µs(33.3 N, 30°) = 2.0 can here be calculated using Eq. (2).
The target speed of the test bench speed (that is, the de-manded slip velocity) was fixed to a constant and equal to 1.3 mm s-1. Of course, such a velocity may be orders
of magnitude above that of typical tectonic solicitations (for instance, an ultra-fast oceanic ridge may reach an opening rate of 10 to 20 cm yr-1[55]). Here, we define the static friction in the experiments as the peak shear stress reached before sliding occurs, divided by the nor-mal stress.
We characterise the anisotropy of this laboratory static friction coefficient for both the Sm and Smm surfaces by
performing a series of experiments where we vary the an-gle of loading with respect to the grooves. We ran friction tests every 30◦ on both plaster faults. At each angle, the experiment was repeated at least three times in order to ensure that results are reproducible (with new casts each time, to avoid any wear related deviation). The standard deviation computed on these multiple measure-ments (typically 5 to 10 N) was used to compute the error bars on our characteristics coefficients of static friction. Sm was sheared under a normal stress σN = 10.9 kPa,
while the tests performed on the rougher surface Smm
were performed under σN = 26.5 kPa. A total of 76
experiments were performed, 37 using Sm and 39 using
Smm. At the onset of slip, the laboratory static friction
coefficient is defined using a standard Coulomb’s law [56]:
µs(FN, θ) =
max [FT(FN, θ)] − Fc
FN
, (2) where µsis the coefficient of static friction and max [FT]
is the (local) maximum tangential force applied at the on-set of slip. In the following, we will also consider the mean driving and normal stresses, denoted σT = FT/(πr2) and
σN = FN/(πr2), where r = 2 cm is the radius of the cast.
Figure6 shows a typical measurement of a friction test, from which max [FT], and hence µs, are calculated.
IV. RESULTS
A. Friction anisotropy
The results are presented in Fig.7. The derived coeffi-cient of frictions are larger than 1, which does not come as a surprise due to the non negligible roughness of our fault samples. Indeed, a large part of the contact area is bound to be perpendicular to the demanded slip (in any direction), inducing a strong resistance to motion. On both fault samples, one can observe the strong anisotropy of the coefficient of static friction, with the maximum value of σS being about four times larger than
its minimum for Sm and about three times larger for
Smm. In most experiments, the minimal friction is
ob-tained along the main groove orientation (i.e., at θ = 0◦
or θ = 180◦), and the resistance to shear is larger per-pendicularly to this orientation. The maximum of value is however never obtained exactly at θ = 90◦or θ = 270◦
FIG. 7. Coefficient of static friction of the Smfault (top) and
Smm fault (bottom) as a function of the sliding direction θ.
Each transverse error bar is computed using at least three experimental realisations (with new plaster casts on each oc-currence). Bar lengths display twice the standard deviation of the obtained coefficient. The tests performed with sample Sm
were done under a normal stress σN = 10.9 kPa, while those
performed with the sample Smm(larger roughness) were done
under σN= 26.5 kPa. The arrows indicate the orientation of
the main grooves (see Figs.1and.2).
but rather along a neighbouring direction. Local max-ima are indeed obtained for θ = 60◦ or θ = 240◦ when shearing Smand for θ = 120◦or θ = 300◦when shearing
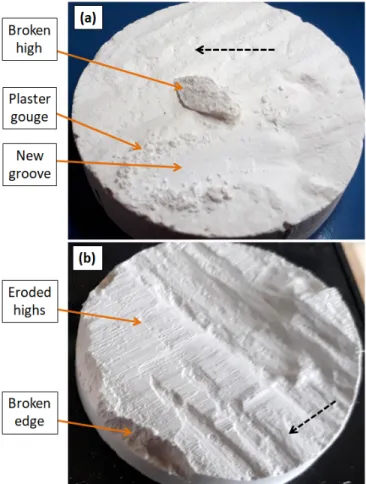
FIG. 8. Various types of damage observed on the fault sur-faces after the sliding tests. The dashed arrows show the slip directions of the complementary plaster casts during the tests. (a): Smsheared at θ = 330◦and σN= 26.5 kPa. The
indicated broken topographic high, on top of the fault, comes from the complementary surface. (b): Complementary of Sm
of a different experiment, sheared at θ = 90◦ and under a higher normal stress σN = 99.0 kPa. The visible damage is
there less localised. Scale: the samples diameter is 40 mm.
B. Damage and stress dependence
Most of our experiments were destructive, with visible wear on the plaster samples after the shearing tests. This wear was the main reason calling for the production of new plaster casts for each experimental realisation, as we verified that repeating a same experiment with a previ-ously used cast led to a significant (and here unwanted) drop in friction. The observed damage consists either in the formation of plaster powder (gouge) or in the rup-ture of topographic highs of the fault surfaces. Part of it might have initiated at the onset of the fault displace-ment (and hence be related to the static friction), while some of it has rather been induced by the subsequent sliding. Figure8 shows some examples of these damage types.
Wear of seismic faults has been studied (e.g., [57,58]) to, in particular, better understand the energy budget of the
FIG. 9. Elevation profile along the diameter of Sm in the
60◦− 240◦
direction. The distances are reported in real word units and the axes are orthonormal. The arrows indicate the motion of the complementary surface for tests along θ = 60◦ and along θ = 240◦. The chip is only strongly interlocked in the latter orientation.
FIG. 10. Coefficient of static friction µS as a function of the
applied normal stress σN for the fault Smsheared along the
direction θ = 90◦ (squares). The length of the error bars is twice the standard deviation of µS obtained for three
dif-ferent tests. For reference, the straight dashed line indicates µS ∝ σS−0.45. The static coefficient of friction measured on
contacting flat plaster surfaces is shown (crosses) for compar-ison.
deformation, but also because this process may lubricate faults during slip (e.g., [59, 60]) or modify the fault per-meability to fluid flow (e.g., [61,62]). The present study focuses on the measurement of the coefficient of static friction and on its anisotropy, but we suggest that our 3D-print-based set-up could also enable the quantitative characterisation of damage during sliding along analogue fault surfaces.
We here keep to a qualitative assessment of which parts of the surfaces were mainly worn during each experiment. It seems that most of the shear resistance of the Corona Heights fault, at the millimeter scale (Smm), arises from
its grooves. By contrast, the friction of Sm
(represent-ing a metric scale) is dominated by one chip in its field-scanned morphology (i.e., the main topographic low in Fig.1). This chip being on the edge of the 3D-printed surface, but not on the edge of the real word fault, a fi-nite size effect (inducing an artificial asymmetry of the fault wall) is certainly at play in the results reported in Fig.7(top), notably explaining the strong asymmetry in µS for the opposite directions θ = 60◦ and θ = 240◦.
Indeed, due to the finite size of our tested pieces, the in-terlocking of the chip is relatively free to unlock laterally
along the θ = 60◦ direction, but is strongly locked by the surrounding plaster along the θ = 240◦direction (see Fig.9).
Because the overall friction is likely to be affected by the surface wear, and because this wear is likely stress depen-dent, we have performed some friction tests on Smunder
various loads σN, at a given angle θ = 90◦. The results
are shown in Fig.10. At the highest tested stresses, µS
seems, to an extent stress independent, with its mean variations lying within the measured error bars. While this result is compatible with the classical Coulomb the-ory (e.g., [56]), one can observe, over a wider range of normal stresses, a consistent decrease in the friction co-efficient with a higher normal stress. It could, in part, emanate from some limitations in our experimental set-up. For instance, at lower σN, the internal friction of
the device (Fc) accounts for a more significant portion
of the total measured tangential force, and the friction characterisation could thus be less accurate. We have however run similar tests on flat plaster surfaces, show-ing no significant variations in µS over the same stress
range (see Fig.10). The drop in friction coefficient with σN is then likely related to the increased damage under
higher normal loading (see Fig.8), reducing the overall shear resistance as asperities are easier to break. It might also result from the change in effective contact area with a higher load, with, proportionally, more pressure being borne by the surfaces parallel to the demanded motion, causing proportionally less of a resistance to slip. Such a drop of µS with the normal stress has already been
re-ported for tilted contacts [63], as the static coefficient of friction is not an absolute material constant [63,64]. We have then assessed the effect of the normal stress σN
on the anisotropy of the static friction coefficient. We performed frictional tests on the four poles of Sm (θ =
0◦, 90◦, 180◦ and 270◦) at a higher load (σN = 171 kPa)
than the load used before (i.e., σN = 10.9 kPa, as
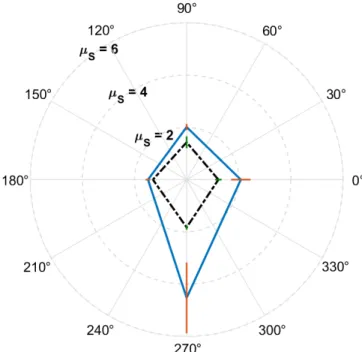
re-ported in Fig.7). The newly measured coefficients of static friction are shown in Fig.11. One can notice the re-duced friction anisotropy at high σN. The ratio between
the maximum and the minimum value of µS indeed drops
from 3.1 at σN = 10.9 kPa to 1.5 at σN = 171 kPa. This
result suggests that the frictional anisotropy of faults is smaller at depth. This concept is naturally linked with the seminal Byerlee [46]’s law, stating that the roughness of fault planes (as well as the type of their constitutive rocks) has less effect on their maximum static frictional properties at larger depths.
V. DISCUSSION AND CONCLUSION
Here, we show how the multiscale anisotropy of fault plane topography leads to an anisotropy in the frictional properties. Results confirm that seismic faults are prone to slide along some preferential orientations. The orientation that is the most likely is the one that faults have previously slid along, and which has shaped some
FIG. 11. Coefficient of static friction µS of the Sm fault
along the cardinal directions θ = 0◦, 90◦, 180◦and 270◦, for two normal stresses: σN = 10.9 kPa (outer plain line) and
σN = 171 kPa (inner dashed line). The bars length is twice
the standard deviation of the measured coefficient, for three different experimental realisations, at each angle and stress. Friction data at the two different normal loads do not overlap. One can notice the consistent reduction in the friction coeffi-cient with a higher load and the reduced friction anisotropy at high σN.
guiding grooves in their morphology. Yet, displacements following other orientations are possible. Predicting the rupture direction of the next earthquake on a fault is thus not only dependent on assessing the main regional stress. The question should rather be along which orientation a rupture criterion [56] will first be exceeded. Such a subtlety might be of little importance for mature faults for which the stress principle orientations have not changed with time, because, in this case, the main stress is likely to act along the lowest coefficient of friction anyway. Yet, it could be paramount for faults under a changing geological load, where this alignment is not verified, or for immature faults, where the slip could be mainly governed by the anisotropy of early surfaces (i.e., where the slip does not coincide with the stress principal orientation, but is non-associated). Examples of slickensides (i.e., fault planes) commonly exist with several overlapping striations orientations (e.g., [65]), with rake and striations oblique to the actual orienta-tion of the fault plane (e.g., [66]). These observations indicate that the original slip direction (if assumed to initiate following Andersonian criterion [67]) does not completely determine the direction of the next episode. Earthquakes occurring along abnormal directions (i.e., not in agreement with the local stress state) have
been observed (e.g., [67–69]), and their understanding might be eased by accounting for the possible frictional anisotropy of their surfaces [70,71].
Note that frictional anisotropy should not only be considered at the full fault scale, but this property may spatially vary along the fault walls. Analytical solutions demonstrate that the stress around a fault is perturbed by its roughness, and a local slip can occur much before the entire fault is under yielding conditions [10] in a given direction.
While we have here only measured the static coefficient of friction, we suggest that similar studies could be performed to characterise the coefficient of dynamic friction (i.e., by analysing the evolution of the resistance to motion, after the plaster faults start moving, as a function of the sliding orientation). Hence, not only the initial slip direction of an earthquake could be impacted by frictional anisotropy, but the complete slip trajectory [30]. Changes in the slip direction within single earthquake rupture events are indeed sometimes observed, notably from bent grooves on post-mortem fault walls [72].
We have, additionally, measured how the anisotropy in friction becomes less significant when the normal stress acting on a fault increases (i.e., with the fault depth), in general agreement with Byerlee’s law [46]. Such an effect likely derives from the stress related changes in rupture rheology and in damage type. The transition from a highly anisotropic to a relatively isotropic regime should typically occur when local stresses on the fault reach the yield strength of the material, σy ∼ 5 MPa [54] in the
case of plaster. This is about two orders of magnitude above the transition σN ∼ 100 kPa at which we observed
a strong reduction in anisotropy (see Fig.11), but our computed σN is an average value which does not
account for the potential strong stress concentrations at play in our faults. Considering that the strength σy
of rocks (e.g., [73]) is about two orders of magnitude (100 times) larger than that of plaster, fault frictional anisotropy could thus be only at play at pressures less than about σN ∼ 100 × 100 kPa = 10 MPa. This would
correspond to the shallowest faults, at depths less than σN/(gρ) ∼ 500 m, where ρ is the volumetric mass of
rocks (∼ 2000 kg m-3) and g the gravity acceleration. Some care should however be taken when deriving such a conclusion by analysing resized samples as ours (40 mm diameter samples representing meter or millimeter topographies), as the way matter breaks is length-scale dependent (e.g., [50]). Note also that other fault geome-tries than the one we have here studied may induce lesser stress concentration, so that a significant damage only occurs at a mean stress level directly comparable to the yield stress σy of rocks. Thus, the possibility
of frictional anisotropy should not be overlooked when studying fault buried up to σy/(gρ) ∼ 50 km. The
heterogeneity of fault planes, and thus the anisotropy in this heterogeneity, may also still play a role under high stress, as roughness does not only encourage local yield,
but also helps to suppress large slip events on moving faults [13].
Additionally to the assessment of the stability of (at least) shallow seismic faults, the characterisation of the frictional anisotropy of rock surfaces may be of importance in geotechnical engineering, for instance, for the stability of tunnels and foundations. There, the intrinsic strength anisotropy of foliated rocks is well studied [35, 36]. Our work shows how one can also characterise the mechanical anisotropy of rough rock contacts, for instance, along joints [41–44] and fractures [74,75] between or inside rock formations. A main point of this manuscript is, finally, to illustrate how the 3D-printing technology can help with new exper-imental designs in Earth Sciences, and this technology is getting a growing attention from the community [76–80], including the study of the frictional properties of 3D-printed fault analogues [80]. A direct continuation of the present work, for instance, could be to 3D-print and to test some faults surfaces beforehand filtered with various band-pass filters, in order to understand how the various wavelengths of the topography contribute to the global static friction coefficient, to the dynamical friction coefficient and to analyse the spatial distribution of the fault wear produced under various stresses and amounts of slip.
Acknowledgement
Author contributions: RT proposed the guidelines of this work, AS built the test machine and, with TVD, printed the faults and performed the friction experi-ments. FR advised on the mechanics of seismic faults. TVD wrote the first version of this manuscript and all authors contributed to the writing of its final version. We are grateful for the early experimental explorations per-formed by Marine-Sophie Jacob, C´eline Fliedner, Aldo Mellado Aguilar, Ga¨etan Leca and Laifa Rahmi, all stu-dents from the EOST/IPGS faculty at the University of Strasbourg. We also thank Amir Sagy from the Geo-logical Survey of Israel for fruitful discussions, and ac-knowledge the support of the University of Strasbourg, of the IRP France-Norway D-FFRACT, and of SFF Pore-lab (project number 262644 of the Research Council of Norway). We thank the Strasbourg AV.Lab association for the use of their 3D printer.
Author declarations: The authors declare no com-peting interest. A funding support from the University of Strasbourg is acknowledged. Readers are welcome to comment and correspondence should be addressed to [email protected] or [email protected].
[1] C. A. J. Wibberley, G. Yielding, and G. Di Toro. Re-cent advances in the understanding of fault zone internal structure: a review. Geological Society, London, Special Publications, 299(1):5–33, 2008. ISSN 0305-8719. doi: 10.1144/SP299.2.
[2] F. Renard, C. Voisin, D. Marsan, and J. Schmittbuhl. High resolution 3d laser scanner measurements of a strike-slip fault quantify its morphological anisotropy at all scales. Geophysical Research Letters, 33(4), 2006. doi: 10.1029/2005GL025038.
[3] T. Candela, F. Renard, Y. Klinger, K. Mair, J. Schmit-tbuhl, and E. E. Brodsky. Roughness of fault surfaces over nine decades of length scales. Journal of Geo-physical Research: Solid Earth, 117(B8), 2012. doi: 10.1029/2011JB009041.
[4] S. R. Brown and C. H. Scholz. Broad bandwidth study of the topography of natural rock surfaces. Journal of Geo-physical Research: Solid Earth, 90(B14):12575–12582, 1985. doi:10.1029/JB090iB14p12575.
[5] J. R. Rice and Y. Ben-Zion. Slip complexity in earth-quake fault models. Proceedings of the National Academy of Sciences, 93(9):3811–3818, 1996. ISSN 0027-8424. doi: 10.1073/pnas.93.9.3811.
[6] J. C. Pechmann and H. Kanamori. Waveforms and spectra of preshocks and aftershocks of the 1979 im-perial valley, california, earthquake: Evidence for fault heterogeneity? Journal of Geophysical Re-search: Solid Earth, 87(B13):10579–10597, 1982. doi: 10.1029/JB087iB13p10579.
[7] T. Tesei, C. Collettini, M. R. Barchi, B. M. Carpenter, and G. Di Stefano. Heterogeneous strength and fault zone complexity of carbonate-bearing thrusts with possi-ble implications for seismicity. Earth and Planetary Sci-ence Letters, 408:307 – 318, 2014. ISSN 0012-821X. doi: 10.1016/j.epsl.2014.10.021.
[8] R. Ando, N. Takeda, and T. Yamashita. Propagation dynamics of seismic and aseismic slip governed by fault heterogeneity and newtonian rheology. Journal of Geo-physical Research: Solid Earth, 117(B11), 2012. doi: 10.1029/2012JB009532.
[9] H. Aochi and S. Ide. Complexity in earthquake sequences controlled by multiscale heterogeneity in fault fracture energy. Journal of Geophysical Research: Solid Earth, 114(B3), 2009. doi:10.1029/2008JB006034.
[10] A. Sagy and V. Lyakhovsky. Stress patterns and failure around rough interlocked fault surface. Journal of Geo-physical Research: Solid Earth, 124(7):7138–7154, 2019. doi:10.1029/2018JB017006.
[11] T. Candela, F. Renard, J. Schmittbuhl, M. Bouchon, and E. E. Brodsky. Fault slip distribution and fault roughness. Geophysical Journal International, 187(2): 959–968, 11 2011. ISSN 0956-540X. doi:10.1111/j.1365-246X.2011.05189.x.
[12] A. A. Allam, K. A. Kroll, C. W. D. Milliner, and K. B. Richards-Dinger. Effects of fault roughness on coseismic slip and earthquake locations. Journal of Geophysical Research: Solid Earth, 124(11):11336–11349, 2019. doi: 10.1029/2018JB016216.
[13] L. Bruhat, Y. Klinger, A. Vallage, and E. M. Dun-ham. Influence of fault roughness on surface displace-ment: from numerical simulations to coseismic slip
distri-butions. Geophysical Journal International, 220(3):1857– 1877, 12 2019. ISSN 0956-540X. doi:10.1093/gji/ggz545. [14] C. A. Queener, T. C. Smith, and W. L. Mitchell. Tran-sient wear of machine parts. Wear, 8(5):391 – 400, 1965. ISSN 0043-1648. doi:10.1016/0043-1648(65)90170-5. [15] Michel Bouchon, Hayrullah Karabulut, Marie-Paule
Bouin, Jean Schmittbuhl, Martin Vall´ee, Ralph Archuleta, Shamita Das, Fran¸cois Renard, and David Marsan. Faulting characteristics of supershear earth-quakes. Tectonophysics, 493(3):244 – 253, 2010. ISSN 0040-1951. doi:10.1016/j.tecto.2010.06.011.
[16] R. Evans. Anisotropy: a pervasive feature of fault zones? Geophysical Journal International, 76(1):157– 163, 01 1984. ISSN 0956-540X. doi:10.1111/j.1365-246X.1984.tb05031.x.
[17] E. S. Cochran, J. E. Vidale, and Y.-G. Li. Near-fault anisotropy following the Hector Mine earthquake. Jour-nal of Geophysical Research: Solid Earth, 108(B9), 2003. doi:10.1029/2002JB002352.
[18] Z. Li, Z. Peng, Y. Ben-Zion, and F. L. Vernon. Spatial variations of shear wave anisotropy near the San Jacinto fault zone in southern California. Journal of Geophysi-cal Research: Solid Earth, 120(12):8334–8347, 2015. doi: 10.1002/2015JB012483.
[19] L. Vadacca, C. Maria Colciago, S. Micheletti, and A. Scotti. Effects of the anisotropy of the fault zone permeability on the timing of triggered earthquakes: Insights from 3d-coupled fluid flow and geomechanical deformation modeling. Pure and Applied Geophysics, 175(12):4131–4144, Dec 2018. ISSN 1420-9136. doi: 10.1007/s00024-018-1936-4.
[20] G. Carbone, B. Lorenz, B. N. J. Persson, and A. Wohlers. Contact mechanics and rubber friction for randomly rough surfaces with anisotropic statistical properties. The European Physical Journal E, 29(3):275–284, Jul 2009. ISSN 1292-895X. doi:10.1140/epje/i2009-10484-8. [21] A. Tiwari, L. Dorogin, B. Steenwyk, A.
Warhad-pande, M. Motamedi, Fortunat G., Ciaravola V., and B. N. J. Persson. Rubber friction directional asymme-try. Europhysics Letters, 116(6):66002, dec 2016. doi: 10.1209/0295-5075/116/66002.
[22] K. Jin, Y. Tian, J. S. Erickson, J. Puthoff, K. Autumn, and N. S. Pesika. Design and fabrication of gecko-inspired adhesives. Langmuir, 28:5737–5742, 2012. ISSN 0743-7463. doi:10.1021/la204040p.
[23] N. Pionnier, J. Vera, E. Contraires, S. Benayoun, R. Berger, and S. Valette. The effect of the orienta-tion and the height of periodic sub-micrometric textur-ing on dropwise condensation. Journal of Colloid and Interface Science, 526:184 – 193, 2018. ISSN 0021-9797. doi:10.1016/j.jcis.2018.04.043.
[24] A. Filippov and S. N. Gorb. Frictional-anisotropy-based systems in biology: structural diversity and numerical model. Scientific Reports, 3:1240, 2013. ISSN 2045-2322. doi:10.1038/srep01240.
[25] A. E. Filippov, G. Westhoff, A. Kovalev, and S. N. Gorb. Numerical model of the slithering snake locomotion based on the friction anisotropy of the ventral skin. Tribology Letters, 2018. ISSN 1023-8883. doi:0.1007/s11249-018-1072-4.
[26] Y. Zheng, X. Gao, and L. Jiang. Directional adhesion of superhydrophobic butterfly wings. Soft Matter, 3:178– 182, 2007. doi:10.1039/B612667G.
[27] A. Roth-Nebelsick, M. Ebner, T. Miranda, V. Gottschalk, D. Voigt, S. Gorb, T. Stegmaier, J. Sarsour, M. Linke, and W. Konrad. Leaf surface structures enable the endemic namib desert grass Stipagrostis Sabulicola to irrigate itself with fog water. Journal of The Royal Society Interface, 9(73):1965–1974, 2012. doi:10.1098/rsif.2011.0847.
[28] F. Wang, L. Wang, H. Wu, J. Pang, D. Gu, and S. Li. A lotus-leaf-like sio2 superhydrophobic bam-boo surface based on soft lithography. Colloids and Surfaces A: Physicochemical and Engineering As-pects, 520:834 – 840, 2017. ISSN 0927-7757. doi: 10.1016/j.colsurfa.2017.02.043.
[29] C. Yu and Q. J. Wang. Friction anisotropy with re-spect to topographic orientation. Scientific Reports, 2: 988, 2012. ISSN 2045-2322. doi:10.1038/srep00988. [30] F. Tapia, D. Le Tourneau, and J.-C. G´eminard.
Anisotropic friction: assessment of force components and resulting trajectories. EPJ Techniques and In-strumentation, 3:1, 2016. ISSN 2195-7045. doi: 10.1140/epjti/s40485-016-0029-y.
[31] S. Stupkiewicz, M. J. Lewandowski, and J. Lengiewicz. Micromechanical analysis of friction anisotropy in rough elastic contacts. International Journal of Solids and Structures, 51(23):3931 – 3943, 2014. ISSN 0020-7683. doi:10.1016/j.ijsolstr.2014.07.013.
[32] G. Fessler, A. Sadeghi, T. Glatzel, S. Goedecker, and E. Meyer. Atomic friction: Anisotropy and asymmetry effects. Tribology Letters, 67(2):59, Apr 2019. ISSN 1573-2711. doi:10.1007/s11249-019-1172-9.
[33] H. Gong, P. Zhu, L. Si, X. Zhang, and G. Xie. “M-shape” nanoscale friction anisotropy of phosphorene. Compu-tational Materials Science, 150:364 – 368, 2018. ISSN 0927-0256. doi:10.1016/j.commatsci.2018.04.013. [34] M. Campione and G. C. Capitani. Subduction-zone
earthquake complexity related to frictional anisotropy in antigorite. Nature Geoscience, 6:847, 2013. ISSN 1752-0908. doi:10.1038/ngeo1905.
[35] W. T. Shea and A. K. Kronenberg. Strength and anisotropy of foliated rocks with varied mica contents. Journal of Structural Geology, 15(9):1097 – 1121, 1993. ISSN 0191-8141. doi:10.1016/0191-8141(93)90158-7. [36] G. C. Rawling, P. Baud, and T.-F. Wong. Dilatancy,
brittle strength, and anisotropy of foliated rocks: Ex-perimental deformation and micromechanical modeling. Journal of Geophysical Research: Solid Earth, 107(B10): ETG 8–1–ETG 8–14, 2002. doi:10.1029/2001JB000472. [37] D. C.P. Peacock and D. J. Sanderson. Effects of layering
and anisotropy on fault geometry. Journal of the Geolog-ical Society, 149(5):793–802, 10 1992. ISSN 0016-7649. doi:10.1144/gsjgs.149.5.0793.
[38] T. Candela and E. E. Brodsky. The minimum scale of grooving on faults. Geology, 44(8):603–606, 08 2016. ISSN 0091-7613. doi:10.1130/G37934.1.
[39] J. T. Engelder. Microscopic wear grooves on slick-ensides: Indicators of paleoseismicity. Journal of Geophysical Research, 79(29):4387–4392, 1974. doi: 10.1029/JB079i029p04387.
[40] J. H. Edwards, J. W. Kluesner, E. A. Silver, E. E. Brod-sky, D. S. Brothers, N. L. Bangs, J. D. Kirkpatrick, R. Wood, and K. Okamoto. Corrugated megathrust
re-vealed offshore from costa rica. Nature Geoscience, 11: 197–202, 2018. ISSN 1752-0908. doi:10.1038/s41561-018-0061-4.
[41] N. Barton and V. Choubey. The shear strength of rock joints in theory and practice. Rock mechanics, 10:1–54, 1977. doi:10.1007/BF01261801.
[42] J. P. Seidel and C. M. Haberfield. The application of energy principles to the determination of the sliding re-sistance of rock joints. Rock Mechanics and Rock Engi-neering, 28:211–226, 1995. doi:10.1007/BF01020227. [43] G. Grasselli and P. Egger. Constitutive law for the shear
strength of rock joints based on three-dimensional sur-face parameters. International Journal of Rock Mechan-ics and Mining Sciences, 40(1):25 – 40, 2003. ISSN 1365-1609. doi:10.1016/S1365-1609(02)00101-6.
[44] Y. Li, C.’A. Tang, D. Li, and C. Wu. A New Shear Strength Criterion of Three-Dimensional Rock Joints. Rock Mechanics and Rock Engineering, 53:1477–1483, 2020. ISSN 1434-453X. doi:10.1007/s00603-019-01976-5.
[45] T. Candela and F. Renard. Fault morphology database, 2012. URL https://www.isterre. fr/french/recherche-observation/equipes/
mecanique-des-failles/moyens-et-outils/article/ donnees.html.
[46] J. Byerlee. Friction of rocks. pure and applied geo-physics, 116(4):615–626, Jul 1978. ISSN 1420-9136. doi: 10.1007/BF00876528.
[47] D. Massonnet, M. Rossi, C. Carmona, F. Adragna, G. Peltzer, K. Feigl, and T. Rabaute. The displacement field of the Landers earthquake mapped by radar inter-ferometry. Nature, 364:138–142, 1993. ISSN 1476-4687. doi:10.1038/364138a0.
[48] R. J. Blakely, R. E. Wells, C. S. Weaver, and S. Y. Johnson. Location, structure, and seismic-ity of the Seattle fault zone, Washington: Evidence from aeromagnetic anomalies, geologic mapping, and seismic-reflection data. GSA Bulletin, 114(2):169– 177, 02 2002. ISSN 0016-7606. doi:10.1130/0016-7606(2002)114¡0169:LSASOT¿2.0.CO;2.
[49] F. Renard. Fault roughness data [data set]. 2020. doi: 10.11582/2020.00059.
[50] E. E. Brodsky, J. D. Kirkpatrick, and T. Candela. Con-straints from fault roughness on the scale-dependent strength of rocks. Geology, 44(1):19–22, 01 2016. ISSN 0091-7613. doi:10.1130/G37206.1.
[51] Technical information, Sauter FH-S. Technical report, Sauter. URL https://dok.kern-sohn.com/manuals/ files/English/FH-S-BA-e-1819.pdf.
[52] Technical information, Ultimaker2 Extended+. Techni-cal report, Ultimaker. URL https://ultimaker.com/ download/7386/UserManual-UM2Extended-v2.1.pdf. [53] Y. Quinsat, C. Lartigue, C. A. Brown, and L.
Hat-tali. Characterization of surface topography of 3d printed parts by multi-scale analysis. International Journal on Interactive Design and Manufacturing, 12(3):1007–1014, Aug 2018. ISSN 1955-2505. doi:10.1007/s12008-017-0433-9.
[54] G. Vekinis, M. F. Ashby, and P. W. R. Beaumont. Plaster of Paris as a model material for brittle porous solids. Journal of Materials Science, 28:3221–3227, 1993. ISSN 1573-4803. doi:10.1007/BF00354239.
[55] V. Renard, R. Hekinian, J. Francheteau, R.D. Ballard, and H. Backer. Submersible observations at the axis of
the ultra-fast-spreading east pacific rise. Earth and Plan-etary Science Letters, 75(4):339 – 353, 1985. ISSN 0012-821X. doi:10.1016/0012-821X(85)90178-5.
[56] F. P. Bowden and D. Tabor. The friction and lubrication of solids. American Journal of Physics, 19(7):428–429, 1951. doi:10.1119/1.1933017.
[57] W. Wang and C. H. Scholz. Wear processes during fric-tional sliding of rock: A theoretical and experimental study. Journal of Geophysical Research: Solid Earth, 99 (B4):6789–6799, 1994. doi:10.1029/93JB02875.
[58] Y.-S. Kim, D. C.P Peacock, and D. J. Sanderson. Fault damage zones. Journal of Structural Geol-ogy, 26(3):503 – 517, 2004. ISSN 0191-8141. doi: 10.1016/j.jsg.2003.08.002.
[59] G. Di Toro, R. Han, T. Hirose, N. De Paola, S. Nielsen, K. Mizoguchi, F. Ferri, M. Cocco, and T. Shimamoto. Fault lubrication during earthquakes. Nature, 471:494– 498, 2011. ISSN 1476-4687. doi:10.1038/nature09838. [60] A. W. Rempel and J. R. Rice. Thermal
pressuriza-tion and onset of melting in fault zones. Journal of Geophysical Research: Solid Earth, 111(B9), 2006. doi: 10.1029/2006JB004314.
[61] M. L. Blanpied, D. A. Lockner, and J. D. Byerlee. An earthquake mechanism based on rapid sealing of faults. Nature, 358:574–576, 1992. ISSN 1476-4687. doi: 10.1038/358574a0.
[62] T. M. Mitchell and D. R. Faulkner. Experimental mea-surements of permeability evolution during triaxial com-pression of initially intact crystalline rocks and impli-cations for fluid flow in fault zones. Journal of Geo-physical Research: Solid Earth, 113(B11), 2008. doi: 10.1029/2008JB005588.
[63] O. Ben-David and J. Fineberg. Static friction coefficient is not a material constant. Phys. Rev. Lett., 106:254301, Jun 2011. doi:10.1103/PhysRevLett.106.254301. [64] Dorian A.H. Hanaor, Yixiang Gan, and Itai Einav.
Static friction at fractal interfaces. Tribology Interna-tional, 93:229 – 238, 2016. ISSN 0301-679X. doi: 10.1016/j.triboint.2015.09.016.
[65] P. H. Cashman and M. A. Ellis. Fault in-teraction may generate multiple slip vectors on a single fault surface. Geology, 22(12):1123–1126, 12 1994. ISSN 0091-7613. doi:10.1130/0091-7613(1994)022¡1123:FIMGMS¿2.3.CO;2.
[66] A. Sagy and Y. Hamiel. Three-dimensional structure and evolution of an asymmetric pull-apart basin. Interna-tional Journal of Earth Sciences, 106:1619 – 1630, 2017. ISSN 1437-3262. doi:10.1007/s00531-016-1374-4. [67] B. C´el´erier. Seeking anderson’s faulting in seismicity:
A centennial celebration. Reviews of Geophysics, 46(4), 2008. doi:10.1029/2007RG000240.
[68] J.-P. Avouac, F. Ayoub, S. Wei, J.-P. Ampuero, L. Meng, S. Leprince, R. Jolivet, Z. Duputel, and D. Helmberger. The 2013, Mw 7.7 Balochistan earthquake, energetic strike-slip reactivation of a thrust fault. Earth and
Plan-etary Science Letters, 391:128 – 134, 2014. ISSN 0012-821X. doi:10.1016/j.epsl.2014.01.036.
[69] K. Satake and H. Kanamori. Abnormal tsunamis caused by the june 13, 1984, torishima, japan, earthquake. Journal of Geophysical Research: Solid Earth, 96(B12): 19933–19939, 1991. doi:10.1029/91JB01903.
[70] M. H. P. Bott. The mechanics of oblique slip fault-ing. Geological Magazine, 96(2):109–117, 1959. doi: 10.1017/S0016756800059987.
[71] D.D. Pollard, S.D. Saltzer, and A. M. Rubin. Stress in-version methods: are they based on faulty assumptions? Journal of Structural Geology, 15(8):1045 – 1054, 1993. ISSN 0191-8141. doi:10.1016/0191-8141(93)90176-B. [72] M. Otsubo, N. Shigematsu, K. Imanishi, R. Ando,
M. Takahashi, and T. Azuma. Temporal slip change based on curved slickenlines on fault scarps along itozawa fault caused by 2011 iwaki earthquake, northeast japan. Tectonophysics, 608:970 – 979, 2013. ISSN 0040-1951. doi:10.1016/j.tecto.2013.07.022.
[73] B. T. Brady, W. I. Duvall, and F. G. Horino. An exper-imental determination of the true uniaxial stress-strain behavior of brittle rock. Rock mechanics, 5:107–120, 1993. ISSN 1434-453X. doi:10.1007/BF01240161. [74] L. Ponson, D. Bonamy, H. Auradou, G. Mourot,
S. Morel, E. Bouchaud, C. Guillot, and J. P. Hulin. Anisotropic self-affine properties of experimental fracture surfaces. International Journal of Fracture, 140:27–37, 2006. ISSN 1573-2673. doi:10.1007/s10704-005-3059-z. [75] L. Ponson, D. Bonamy, and E. Bouchaud.
Two-dimensional scaling properties of experimental fracture surfaces. Phys. Rev. Lett., 96:035506, Jan 2006. doi: 10.1103/PhysRevLett.96.035506.
[76] L. Wang, Y. Ju, H. Xie, G. Ma, L. Mao, and K. He. The mechanical and photoelastic properties of 3D printable stress-visualized materials. Scientific Reports, 2017. ISSN 2045-2322. doi:10.1038/s41598-017-11433-4.
[77] T. Feng, Y.-H. Gong, Y.-Y. Zhou, Z.-W. Li, and X.-F. Liu. The 3D-printing technology of geological mod-els using rock-like materials. Rock Mechanics and Rock Engineering, 52:2261–2277, 2019. ISSN 1434-453X. doi: 10.1007/s00603-018-1703-y.
[78] A. Squelch. 3D printing rocks for geo-educational, tech-nical, and hobbyist pursuits. Geosphere, 14(1):360–366, 11 2017. ISSN 1553-040X. doi:10.1130/GES01364.1. [79] J. Wang, R. R. Stewart, and N. I. Dyaur. Seismic
re-sponse analysis of a 3D-printed dual-porosity physical model: Marine case, pages 301–305. Society of Ex-ploration Geophysicist, 2018. doi:10.1190/segam2018-2997200.1.
[80] P. Braun, G. Tzortzopoulos, and S. Ioannis. Design of sand-based, 3d-printed analogue faults with con-trolled frictional properties. preprint, doi: 10.1002/es-soar.10503633.1, 2020.
![FIG. 2. White light interferometry measurement of the to- to-pography of the Corona Heights fault plane at the millimeter scale [45, 49]](https://thumb-eu.123doks.com/thumbv2/123doknet/14784958.598324/3.918.475.835.519.837/white-light-interferometry-measurement-pography-corona-heights-millimeter.webp)
![Figure 6 shows a typical measurement of a friction test, from which max [F T ], and hence µ s , are calculated.](https://thumb-eu.123doks.com/thumbv2/123doknet/14784958.598324/6.918.475.839.80.716/figure-shows-typical-measurement-friction-test-max-calculated.webp)