IMPACTS ON WATER LEVELS OF NEW
BRIDGE FOOTINGS AND ASSOCIATED
COFFERDAMS FOR THE
INTERNATIONAL BRIDGE OF
CORNWALL (ONTARIO)
USING DETAILED 2D
HYDRODYNAMIC MODELLING
IMPACTS ON WATER LEVELS OF NEW BRIDGE FOOTINGS
AND ASSOCIATED COFFERDAMS FOR THE INTERNATIONAL
BRIDGE OF CORNWALL (ONTARIO) USING DETAILED
2D HYDRODYNAMIC MODELLING
Morin, Jean, Olivier Champoux and Paul Boudreau
Study for the McCormick Rankin Corporation
Institut National de la Recherche Scientifique Centre Eau, Terre et Environnement
Université du Québec
Research report INRS-ETE No R-888
© INRS-ETE, 2007 ISBN: 978-2-89146-553-3
Reference : Morin, Jean, Olivier Champoux and Paul Boudreau (2007). Impacts on water
levels of new bridge footings and associated cofferdams for the International Bridge of Cornwall (Ontario) using detailed 2D hydrodynamic modelling. Study for the McCormick Rankin Corporation. Research report INRS-ETE R-888. 12 pages + appendix.
iii
TABLE OF CONTENTS
1. INTRODUCTION ... 1
2. METHODOLOGY... 2
2.1 HYDRODYNAMIC MODEL... 2
2.2 FINITE ELEMENT MESHTT... 3
2.3 NUMERICAL FIELD MODEL... 3
2.4 BOUNDARY CONDITIONS... 3
2.5 RESULTS... 4
2.6 ON THE MODEL’S PRECISION... 10
3. RECOMMENDATIONS ... 11
REFERENCES ... 12 APPENDIX ...A-1
LIST OF FIGURES
FIGURE 1: NEW PILES 10 700 M³/S - WATER LEVEL DIFFERENCES BETWEEN NEW FOOTINGS AND PRESENT CONDITIONS... 6
FIGURE 2: NEW PILES 7 700 M³/S - WATER LEVEL DIFFERENCES BETWEEN NEW FOOTINGS AND PRESENT CONDITIONS... 7 FIGURE 3:PROPOSITION PILES 7 700 M³/S -WATER LEVEL DIFFERENCES BETWEEN IMPROVED
PROPOSED DESIGN AND PRESENT CONDITIONS... 8
PLATE 1:FINITE ELEMENT MESH -GLOBAL VIEW...A-3 PLATE 2:ACTUAL MESH...A-4
PLATE 3:COFFERDAM MESH...A-5
PLATE 4:NEWPILES MESH...A-6 PLATE 5:PROPOSITION MESH...A-7 PLATE 6:TOPOGRAPHY -GLOBAL VIEW...A-8
PLATE 7:MANNING’S N (FRICTION MAP)-GLOBAL VIEW...A-9
PLATE 8:ACTUAL10700 M³/S -VELOCITY MODULUS...A-10 PLATE 9:ACTUAL10700 M³/S -VELOCITY MODULUS...A-11
PLATE 10:ACTUAL10700 M³/S -VELOCITY MODULUS...A-12
PLATE 11:ACTUAL10700 M³/S -WATER LEVEL...A-13 PLATE 12:ACTUAL10700 M³/S -WATER LEVEL...A-14
PLATE 13:ACTUAL7700 M³/S -VELOCITY MODULUS...A-15
PLATE 14:ACTUAL-7700 M³/S -VELOCITY MODULUS...A-16 PLATE 15:ACTUAL-7700 M³/S -VELOCITY MODULUS...A-17 PLATE 16:ACTUAL-7700 M³/S -WATER LEVEL...A-18
PLATE 17:ACTUAL-7700 M³/S -WATER LEVEL...A-19
PLATE 18:COFFERDAM-10 700 M³/S -VELOCITY MODULUS...A-20 PLATE 19:COFFERDAM-10 700 M³/S -VELOCITY MODULUS...A-21
PLATE 20:COFFERDAM-10 700 M³/S -VELOCITY MODULUS...A-22
PLATE 21:COFFERDAM-10 700 M³/S -WATER LEVEL ...A-23 PLATE 22:COFFERDAM-10 700 M³/S -WATER LEVEL ...A-24
PLATE 23:COFFERDAM7700 M³/S -VELOCITY MODULUS...A-25
PLATE 24:COFFERDAM7700 M³/S -VELOCITY MODULUS...A-26 PLATE 25:COFFERDAM7700 M³/S -VELOCITY MODULUS...A-27 PLATE 26:COFFERDAM7700 M³/S -WATER LEVEL...A-28
PLATE 27:COFFERDAM-7700 M³/S -WATER LEVEL...A-29
PLATE 28:NEWPILES-VELOCITY MODULUS...A-30 PLATE 29:NEWPILES-VELOCITY MODULUS ...A-31
PLATE 30:NEWPILES-10700-VELOCITY MODULUS...A-32
PLATE 31:NEWPILES-10700 M³/S -WATER LEVEL...A-33 PLATE 32:NEWPILES-10700 M³/S -WATER LEVEL ...A-34
v
PLATE 38:PROPOSITION-7700 M³/S -VELOCITY MODULUS...A-40
PLATE 39:PROPOSITION-7700 M³/S -VELOCITY MODULUS ...A-41 PLATE 40:PROPOSITION-7700 M³/S -VELOCITY MODULUS ...A-42
PLATE 41:PROPOSITION-7700 M³/S -WATER LEVEL...A-43
PLATE 42:PROPOSITION7700 M³/S -WATER LEVEL...A-44
LIST OF TABLES
TABLE 1: VALIDATION OF SIMULATION WITH MEASURED AND SIMULATED WATER LEVELS AT
CORNWALL AND AT THE MOSES DAM FOR THE TWO SIMULATED DISCHARGES... 4
TABLE 2:HYDRODYNAMIC RESULTS (WATER LEVELS) AT THE DAM AND 50 M UPSTREAM OF THE BRIDGE FOR ALL SIMULATED CONDITIONS... 5 TABLE 3: HYDRODYNAMIC RESULTS FOR DISCHARGES FLOWING TROUGH THE NORTH AND
1
1. Introduction
The INRS-ETE (Institut national de la recherche scientifique – Eau, Terre et Environnement) has been mandated by the McCormick Rankin Corporation to evaluate the impact of the new footings design and cofferdams for the International Bridge in Cornwall, Ontario. This bridge would link the main land to Cornwall Island over the north channel of the St. Lawrence River. The new bridge would be located immediately upstream the present bridge.
The McCormick Rankin Corporation wants to evaluate the impacts of the projected construction (proposed bridge footings and related cofferdams used during construction) on the water levels and on local velocities for two contrasted discharges: 1) a very high discharge (100-year return period) of 10 700 m³/s and for the 2) most common summer discharge (summer median) of 7 700 m³/s. Since the original McCormick design had a local impact on water levels, a more hydrodynamic design for the footing has also been tested with the same two discharges.
This report focuses on the methodology used in order to assess the impact of the project on the water levels and on the results obtained from detailed hydrodynamic simulations. These results are presented in Appendix.
2. Methodology
The field model used for this impact assessment is a modification of the Lake Saint-François model that was developed as a part of Morin’s Ph.D. dissertation (Morin, 2001). For the present project, the global model has been reduced to Summerstown gauging station and refined in the bridge area.
Two discharge conditions were used in the hydrodynamic simulation process. A discharge of 10 700 m³/s was used and corresponds to a 100-year return period as calculated with a log Pearson III regression with data from 1959 to 1993. A discharge of 7 700 m³/s was also used, corresponding to the median value of the daily mean average for data from July to October of 1960 to 2003 (this period corresponds to the most possible cofferdam installation and removal).
In order to assure the model’s accuracy while avoiding simulating validation conditions sensu stricto, observed discharges and water levels (gauging stations) available in the historical records were used to fix the boundary conditions.
The discharge of 10 700 m³/s was in fact observed at Moses-Saunders Dam on May 28th 1993 and represents the worst case scenario for the present study. The second discharge of 7 700 m³/s was commonly observed between June 17th and 30th 2000, and it represents the mean discharge for the present study.
2.1 Hydrodynamic model
The hydrodynamic modelling was performed by using the HYDROSIM model developed at INRS-ETE (Leclerc et al., 1995). The approach used is based on the two-dimensional finite element discretization of the St. Venant equations (flux formulation), which are solved using an iterative transient solution method named Euler-GMRES (Heniche et al., 1999). This method solves simultaneously the mass and momentum conservation principles and takes into account the local friction coefficient for parameterization. The turbulence closure scheme uses the mixing length theory (0-equation model) which involves the horizontal velocity gradients. The model is vertically integrated and produces reliable predictions of mean velocity of the water column, water level, and
3
As one seeks the steady-state conditions, the solution is considered independent of the initial conditions. As for the boundary conditions scheme, one usually solves the problem by using specified discharge at the upstream boundary, water level at the main outlet and specified discharges at the tributary and secondary outlets.
2.2 Finite Element Mesh
The hydrodynamic model uses a finite element grid for discretization. The number of elements is variable and the model allows refining discretization in areas where it is needed. Each triangular element is made of six nodes that support the information from the numerical field model (topometry, friction coefficients) and simulation results (velocities and depth).
For this study, four meshes were produced: 1) the PRESENT mesh represents the present bridge footings only; 2) the COFFERDAM mesh describes the presence of cofferdams surrounding the new piles during construction; 3) the NEW PILES mesh represents the mesh used to simulate hydrodynamic conditions that would prevail after the removal of cofferdams; and 4) the PROPOSITION mesh represents the mesh used to simulate a more hydrodynamic design for the future footings.
The upstream boundary condition (discharge) of all meshes is the discharge at Moses-Saunders Power Dam. The downstream boundary (water level) is defined by the measured level at Summerstown gauging station. The PRESENT mesh is composed of 138 823 nodes and 67 575 elements, the COFFERDAM mesh is composed of 137 599 nodes and 66 915 elements and the NEW PILES mesh is composed of 138 158 nodes and 67 193 elements. Elements vary in size from 0.2 to 75 m. The smallest elements were used to describe more precisely the area surrounding the bridge piles.
2.3 Numerical field model
The bathymetry used for this project was produced by Morin (2001). The bathymetry is composed of 266 917 sounding points digitized from the original field sheets from the Canadian Hydrographic Service (CHS) surveys. The Manning’s friction coefficient map used for this project was also produced by Morin (2001).
2.4 Boundary Conditions
The first simulated condition corresponds to a high-discharge event as observed on May 28th 1993. The discharge of the St. Lawrence at Cornwall was 10 700 m³/s at the time, while 20 m³/s was flowing from Grass River and 70 m³/s from Raquette River. The measured water level at Summerstown (Cornwall station) was 46.79 m.
For the 7 700 m³/s event, the condition corresponds to the mean value of the events between June 17th and 30th 2000. The mean discharge at Cornwall was 7 704 m³/s, while 10 m³/s was flowing from Grass River and 20 m³/s from Raquette River. The mean measured water level at Summerstown was 46.72 m.
2.5 Results
In order to compare properly the different hydrodynamic results, all numeric solutions were computed to a high degree of convergence (varying from 10E-08 to 10E-13). The model represents correctly the local hydrodynamics as shown by the measured water levels at Cornwall and at the Dam. In fact, the differences between simulated and measured water levels are less than 4 cm (Table 1) in both stations for the two contrasted discharges.
Table 1: Validation of simulation with measured and simulated water levels at Cornwall and at the Moses Dam for the two simulated discharges
At Cornwall
Water Level (m) Measured Simulated 7 700 m³/s 46.93 46.92 10 000 m³/s 47.17 47.16
At the Moses Dam Water Level (m) Measured Simulated 7 700 m³/s 48.29 48.25 10 000 m³/s 49.09 49.08
More results are presented on the figures appearing in the appendix at the end of the document. These figures show the numerical field model, the manning friction coefficients, the different meshes and the results from hydrodynamic simulations: velocity modulus and water levels for each of the simulated events.
The hydrodynamic simulations show that the impact of the COFFERDAM and of the NEW PILES on the water level is close to 6 cm in the bridge area for the extremely high discharge, while it is close to 3 cm at 7 700 m³/s (see Table 2 below, Figure 1 and Figure 2). The proposed design that is more efficient in terms of hydrodynamic has ±30% less
5
Table 2: Hydrodynamic results (water levels) at the dam and 50 m upstream of the bridge for all simulated conditions
10 700 m³/s
Water Level DAM 50 m
upstream Water level Differences (compared to present) DAM 50 m upstream m m m m PRESENT 49.287 48.608 PRESENT COFFERDAM 49.314 48.668 COFFERDAM 0.026 0.060
NEW PILES 49.313 48.665 NEW PILES 0.026 0.058
PROPOSITION NOT SIMULATED
AT 10K PROPOSITION
7 700 m³/s
Water Level DAM 50 m
upstream Water level Differences (compared to present) DAM 50 m upstream m m m m PRESENT 48.155 47.811 PRESENT COFFERDAM 48.168 47.842 COFFERDAM 0.012 0.031
NEW PILES 48.168 47.841 NEW PILES 0.012 0.030
PROPOSITION 48.164 47.830 PROPOSITION 0.008 0.019
50 m DAM
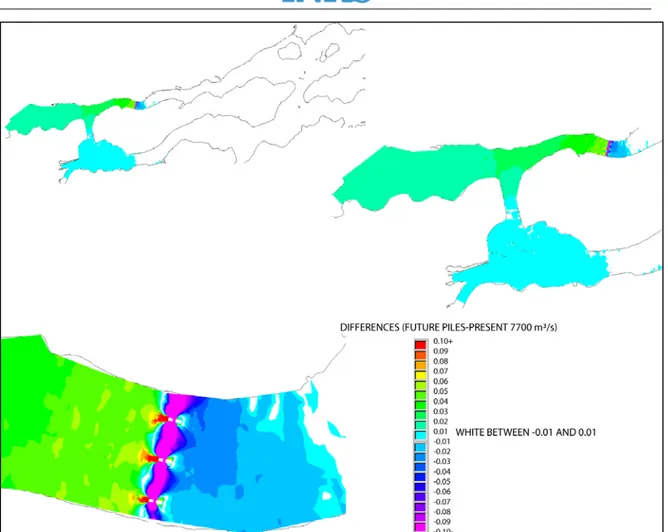
Figure 1: New Piles 10 700 m³/s - Water Level differences between new footings and present conditions
7
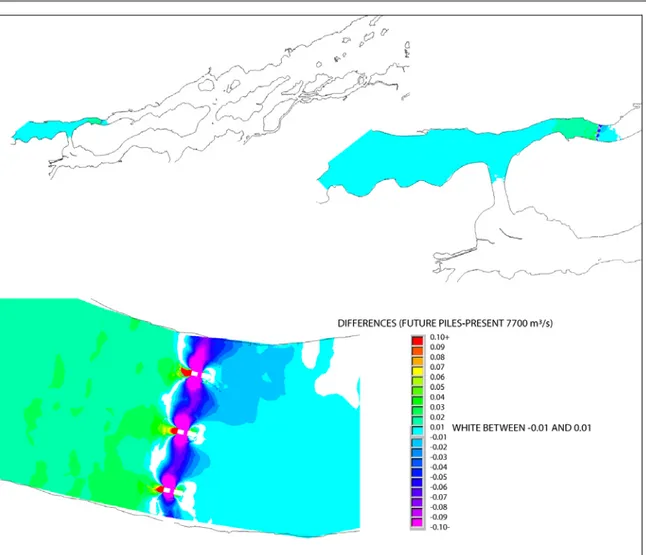
Figure 2: New Piles 7 700 m³/s - Water Level differences between new footings and present conditions
Figure 3: Proposition Piles 7 700 m³/s - Water Level differences between improved proposed design and present conditions
With the new piles (Table 3), a discharge of approximately 63 to 74 m³/s is transferred from the northern channel to the southern channel at 10 700 m³/s, while it is of 34 to 41 m³/s at 7 700 m³/s. For the proposed design, this impact is reduced and only 25 to 31 m³/s is transferred for the 7 700 m³/s discharge.
The hydrodynamic model solves the mass conservative equation, but some gain/loss of discharge are still observed here and there in the model. That is why the loss of discharge in the northern channel is not exactly the same as the gain in the southern channel. However, the variation of discharge is less than 1% for the southern and 2% for the northern channel, which precision is less than the one that would be obtained if we measured the discharge with precise equipment (echo sounder Doppler for example).
9
Table 3: Hydrodynamic results for discharges flowing trough the north and south channel around Cornwall Island
10 700 m³/s Discharge Q1 Q2 Differences in discharge (compared to present) Q1 Q2 m³/s m³/s m³/s m³/s PRESENT 7159 3310 PRESENT COFFERDAM 7231 3235 COFFERDAM 71 -74
NEW PILES 7223 3240 NEW PILES 63 -69
PROPOSITION NOT SIMULATED
AT 10K PROPOSITION 7 700 m³/s Discharge Q1 Q2 Differences in discharge (compared to present) Q1 Q2 m³/s m³/s m³/s m³/s PRESENT 5250 2299 PRESENT COFFERDAM 5291 2257 COFFERDAM 40 -41
NEW PILES 5284 2258 NEW PILES 34 -40
PROPOSITION 5276 2267 PROPOSITION 25 -31
Q1 Q2
These simulated impacts are surprisingly high for such a small modification of the present conditions in the river. This fact seems to be mainly linked to the extremely high velocities in the area were the bridge is located. The simulated velocities show that for a relatively small discharge of 7 700 m³/s, the maximal velocity is more than 3 m/s between the bridge piles, and for a 10 700 m³/s discharge, the maximal simulated velocity is close to 3.7 m/s on a large portion of the area.
2.6 On the model’s precision
In order to evaluate the model’s sensitivity to Manning’s friction coefficient, two simulations were done with a 10% decrease in Manning’ friction coefficient around the bridge area, from a typical n value of 0.025 to 0.022. The impacts of these changes on the water levels were less than 0.5 mm in the bridge area.
Even if errors could be associated with the model itself, they are difficult to quantify mainly because no water level measurements upstream of the present bridge is available. It is also possible that the relative discharges in the south and the north channel are effectively slightly different. This would have a small impact on the absolute water levels and discharge. However, the impact created by the insertion of the new piles, or any other modification of the present conditions, would be certainly similar to the present simulated conditions in terms of differences.
In conclusion, even if the hydrodynamics results may not be absolutely accurate, the differences in the hydrodynamics results obtained from each scenario are accurate because they reflect only the impact from the footings themselves.
11
3. Recommendations
The area were the new piles would be built is characterised by extremely fast flowing currents. In regards of the simulations, this feature causes a small water level increase when the new piles and footings are in place. For a median discharge of 7 700 m³/s, the impact on the water level near the bridge is an increase of 3 cm and increase of near 1 cm at the dam. As computed with the hydrodynamic model, the impact of this change would result in a transfer of approximately 40 m³/s from the northern to the southern channel of the Cornwall Island. In terms of discharge, approximately 40 m³/s (40/5 250 m³/s in the southern channel and 40/2 299 m³/s in the northern channel) represents a change of 0.7% to 1.7% compared to the present discharge. These changes would be too small to be measurable with the best technology available such as Doppler current profiler for example. As shown, the selection of more hydrodynamic footings would reduce the impact of these changes on the discharge by 30%.
A few solutions can be explored in order to reduce this impact: 1) optimisation of the design of the new footings and piles in order to be more “hydrodynamic” and 2) modification of the shape of the old piles and footings, i.e. “sculpting it” by removing the angles (corners) in its downstream portion. In our opinion, these two options would probably reduce the impact on the discharge to a similar magnitude than the proposed design, 30%.
References
Morin, J. (2001). Modélisation des facteurs abiotiques de l’écosystème du lac
Saint-François, fleuve Saint-Laurent. Thèse présentée pour l’obtention du grade de philosophiae doctor (Ph.D.) en sciences de l’eau. Université du Québec, Institut national de recherche scientifique, INRS-Eau. 69 pages.
Leclerc, M., A. Boudreault, J. Bechara and G. Corfa (1995). Two–Dimensional
Hydrodynamic Modelling: A Neglected Tool in the Instream Flow Incremental Methodology. Transaction of the American Fisheries Society. 124: 645–662.
Heniche, M., Y. Secretan, P. Boudreau and M. Leclerc (1999). A 2-D finite element
drying-wetting shallow water model for rivers and estuaries. Advances in Water Resources. 35 pages.
A-1
APPENDIX
PLATE 1:FINITE ELEMENT MESH -GLOBAL VIEW...A-3
PLATE 2:ACTUAL MESH...A-4
PLATE 3:COFFERDAM MESH...A-5 PLATE 4:NEWPILES MESH...A-6
PLATE 5:PROPOSITION MESH...A-7
PLATE 6:TOPOGRAPHY -GLOBAL VIEW...A-8 PLATE 7:MANNING’S N (FRICTION MAP)-GLOBAL VIEW...A-9 PLATE 8:ACTUAL10700 M³/S -VELOCITY MODULUS...A-10
PLATE 9:ACTUAL10700 M³/S -VELOCITY MODULUS...A-11
PLATE 10:ACTUAL10700 M³/S -VELOCITY MODULUS...A-12 PLATE 11:ACTUAL10700 M³/S -WATER LEVEL...A-13
PLATE 12:ACTUAL10700 M³/S -WATER LEVEL...A-14
PLATE 13:ACTUAL7700 M³/S -VELOCITY MODULUS...A-15 PLATE 14:ACTUAL-7700 M³/S -VELOCITY MODULUS...A-16
PLATE 15:ACTUAL-7700 M³/S -VELOCITY MODULUS...A-17
PLATE 16:ACTUAL-7700 M³/S -WATER LEVEL...A-18 PLATE 17:ACTUAL-7700 M³/S -WATER LEVEL...A-19 PLATE 18:COFFERDAM-10 700 M³/S -VELOCITY MODULUS...A-20
PLATE 19:COFFERDAM-10 700 M³/S -VELOCITY MODULUS...A-21
PLATE 20:COFFERDAM-10 700 M³/S -VELOCITY MODULUS...A-22 PLATE 21:COFFERDAM-10 700 M³/S -WATER LEVEL ...A-23
PLATE 22:COFFERDAM-10 700 M³/S -WATER LEVEL ...A-24
PLATE 23:COFFERDAM7700 M³/S -VELOCITY MODULUS...A-25 PLATE 24:COFFERDAM7700 M³/S -VELOCITY MODULUS...A-26
PLATE 25:COFFERDAM7700 M³/S -VELOCITY MODULUS...A-27
PLATE 26:COFFERDAM7700 M³/S -WATER LEVEL...A-28 PLATE 27:COFFERDAM-7700 M³/S -WATER LEVEL...A-29
PLATE 28:NEWPILES-VELOCITY MODULUS...A-30
PLATE 29:NEWPILES-VELOCITY MODULUS ...A-31
PLATE 30:NEWPILES-10700-VELOCITY MODULUS...A-32 PLATE 31:NEWPILES-10700 M³/S -WATER LEVEL...A-33 PLATE 32:NEWPILES-10700 M³/S -WATER LEVEL ...A-34
PLATE 33:NEWPILES-7700 M³/S -VELOCITY MODULUS ...A-35 PLATE 34:NEWPILES-7700 M³/S -VELOCITY MODULUS...A-36 PLATE 35:NEWPILES-7700 M³/S -VELOCITY MODULUS...A-37
PLATE 36:NEWPILES-7700 M³/S -WATER LEVEL ...A-38 PLATE 37:NEWPILES-7700 M³/S -WATER LEVEL...A-39 PLATE 38:PROPOSITION-7700 M³/S -VELOCITY MODULUS...A-40
PLATE 39:PROPOSITION-7700 M³/S -VELOCITY MODULUS ...A-41
PLATE 40:PROPOSITION-7700 M³/S -VELOCITY MODULUS ...A-42 PLATE 41:PROPOSITION-7700 M³/S -WATER LEVEL...A-43
A-3
Plate 1: Finite element mesh - Global View
Finite Element Mesh
Global View
Discharge condition: May 28 7993
EAU, TERR.md!'.l:l~~
Cornwall water level Mose-Sauders Power Dam Q= 10000 mJ/s
'\
\ Q = 700ml!s station " ,C,"o""!!nw",,,al,-I _...,1
> ·
·!
I
Grass River Q = 20 mJ/sFinite Element Mesh
Internation Bridge section View
International Bridge
1
Raquette River Q = 70 ml/s Summerstown H=46.79mActual Finite Element Mesh
Number of nodes: 139171
Number of element: 67749
Modification Finite Element Mesh
Number of nodes: , 38070
A-5
A-7
Topography
Global View
m-IGLD55 . 47.00+ . 46.400
45 .80 45.20 , 44.60 , 44.00 43.400
42.80 42.20 41.60n
41.000
40.40 39.80 39.20 . 38.60 . 38.00 . 37.40 EAU, TERR~4!'.!:l~~A-9
Plate 7: Manning’s n (friction map) - Global View
EAU, TERR';4Ilil~
Manning's n (friction map)
Global View
. 0.06 0.047 1 0.044 0.041 0.037n
0.034 0.031 . 0.247 . 0.214 . 0.181EAU, TERR mis . 3.0+ . 2.85
rJ
2.70 n 2.55n
2.40 n 2.25n
2.10n
1.95 1.800
1.65n
1.50 1.350
1.20 . 1.05 0.90 . 0.75 . 0.60A-11
Plate 9: ACTUAL10 700 m³/s - Velocity Modulus
mis
-...-A-13
Plate 11: ACTUAL10 700 m³/s - Water Level
Visualisationl
IsoSlJface . FinaF'ont_Actueli 10k .-Niveau de slJface 4.9500000e+Ol 4.9360001e+01 • 4 9220001 .. 01 • 4.3JBOOO2e+Ol 4.893999ge+Ol
r
4 8799999 .. 01Il
4.8660000e+Ol1
4.8520000e+Ol 4,8380001e.Ol 4.8240002 .. 018
4.8099998e+Ol 4.7959999,.010
4.7820000e+010
4.7680000 .. 01 • 4.7540001 e+Ol 4.7400002 .. 01Il
4 7259998e+Dl 4.7119999,.01Il
4.69BOOOOe+Ol • 46840000e+Dl 4.6700001e+Ol· EAU, TERR';4~~~-\
A-15
Plate 13: ACTUAL7700 m³/s - Velocity Modulus EAU, TERR mis . 3.0+ . 2.85 2.70 0 2.55
n
2.40n
2.250
2.100
1.95 1.80 1.650
1.50 n 1.35 1.20 . 1.05 0.90 . 0.75 . 0.60 . 0.45 . 0.30 . 0.15 . 0.0A-17
Plate 15: ACTUAL- 7700 m³/s - Velocity Modulus
-
... -, -. ...---
~...:::: ... ... ...-
-
-...-::----.:::
-
... ~......--...----
-,,'-
~- -~ -~ ~-~--
-
-... ... ~-....
,:::.
~~---
_
...---
... ... ... ~ --
::;...~ -...-
~-
--~ ~ -~
-
-
-EAU, TERR --~-
--
----.-..---.--
--
--
--::-:--::
~- --~------
-
--- ---
---
---
-
---
----
--
-
---
-Visualisation 1
l$oSllf~e' Fin~ont_Actud 7k . Nive~ de sll'f~e 4.85OC(((\e.Ol 4.84(0))2e.Ol
=
4.829999ge+Ol 4.8200))1 e+01r
4.8099998e+Olr
4.00:0:0Je+Ol 4.7~2e+O'r
r
4.779999ge+01 4.77(0))1 e+01 4.7599998e+Ol I:::i 4.75OX((\e+Ol 4.740c002e+Ol Or;;l 4.729999ge+01 4.7200))1 e+01 • U099998e+Ol • 4.11))))))e.Ol 4.6~2e+O'=
4.679999ge+01 4.67(0))1 e+01=
4.6599998e+Ol • 4.65OX((\e.Ol EAU, TERR';4~~~A-19
Plate 17: ACTUAL- 7700 m³/s - Water Level
mis . 3.0+ . 2.85 2.70 n 2.55
n
2.40 n 2.25n
2.10 1.95 1.80D
1.65 1.50 n 1.35D
1 .20 . 1.05 0.90 . 0.75 . 0.60 . 0.45 . 0.30 . 0.15 . 0.0 EAU, TERRA-21
Plate 19: COFFERDAM - 10 700 m³/s - Velocity Modulus
A-22 Plate 20: COFFERDAM - 10 700 m³/s - Velocit y Modulus ~
<
~ ! I ! ,','r
, , 1,
r'
!/,!
! 1 1 r 1 IIIr r
1 ilr!
1 1 r 1 r ! rA-23
Plate 21: COFFERDAM - 10 700 m³/s - Water Level
EAU, TERR
A-25
Plate 23: COFFERDAM7700 m³/s - Velocity Modulus EAU, TERR mis . 3.0+ . 2.85 2.70 0 2.55
n
2.40n
2.250
2.100
1.95 1.80 1.65n
1.50 0 1.350
1.20 . 1.05 0.90 . 0.75 . 0.60 . 0.45 . 0.30 . 0.15 . 0.0A-27
Plate 25: COFFERDAM7700 m³/s - Velocity Modulus
-
--- ---
--
...~----
~
~~~~
--
---.,. --",,---~~ -~
--
~-:..-
--
--. -~--..-
-~--
~-
-
-.-.---
~--- -~ --
--
-
---
-
-
--
- -
- -
-
:_2';;:-.,.:;:",~~!i~
---
-
~
~
$
~~~
:.=
-
-
-
-
----
-. ~-
---
-
--
::::-
---.
--_.--~--- ~-~ - --...-
-
--
--
---
-
---
--
-
--
---
--
--
-
--
-
--Vi~wlismion'
IsoSUlf~e· F~orU'~odit 7k .. Niveau de slI'fo5Ce
4.135CIOCOJe+01 4.8400002e+Ol
=
4.829999ge+01 4.8200001e+01, 4.8099998e+01r
4.8OOOOOOe+Ol 4.7!n1OO2e+01!=
4.7799S9ge+01 ' 4.7700001e+01 0 4.7599998e+Ol 4.75OOOOOe+01 4.7400002e+01Id
4.729999ge+01 4.7200001e+Ol ~ 4.7099998e+01 • 4.7000000e+01 4.69JOOO2e+01=
4.679999ge+Ol 4.6700001e+01=
4.6599998e+01 • 4.65OOOOOe+01 EAU, TERR';4~~~A-29
Plate 27: COFFERDAM-7700 m³/s - Water Level
EAU, TERR 2.70 n 2.55
n
2.40 n 2.25n
2.10 1.95 1.80D
1.650
1.50 n 1.350
1 .20 . 1.05 0.90 . 0.75 . 0.60 . 0,45 . 0.30 . 0.15 . 0.0A-31
Plate 29: NEW PILES - Velocity Modulus
-
-A-33
Plate 31: NEW PILES-10700 m³/s - Water Level
Vi$~$dionl
l.oStI'fllCe· F~ml.JlJ(JI 1 Ck·· N .... MU de .... fllCe 4,95O'JCOl\e+Ol 4.93600010.+01
=
4.S220001e+Ol 49lOOOO2e+Olr
4.893999ge+Ol 4879999Se+OlF
HIG6OOOOe+01 n 4.852OOlOe+Ol 4.8300001 .. +01 4.82400020.+01 4.009999&+01 095999ge+01 n 4.7a2OOlOe+Ol 4.7Sl:I'JCOl\e+Ol VS40001o.+01 • 4.7'00002e+01=
" 7259996e+Ol 4.711999ge+Ol=
4.69OOOJl\e+Ol HS4OCOOe+01 • 4.67000018+01· EAU, TERR';4~~~A-35
Plate 33: NEW PILES-7700 m³/s - Velocity Modulus
EAU, TERR mis . 3.0+ . 2.85 2.70 2.55
n
2.40n
2.25 2.100
1.95 1.80 1.65n
1.50 1.350
1 .20 . 1.05 0.90 . 0.75 . 0.60 . 0.45 . 0.30 . 0.15 . 0.0EAU, TERR
A-37
Plate 35: NEW PILES-7700 m³/s - Velocity Modulus
... ~
-..::..
-
_
...-
--...-
----..""':,.---
::
...-_ _ _-- ~-i:: ::: ... -..."""'- -...- ":!..
-
~-.
-
::::
-
-
~~--...
-
----
_
-
...-
:-i::
-
-
-.-
---
- -
--:.-
-
--
--
-
----~--
----
---:::
-
--....
---
... ---
-
-
-::: '""'-'- ~ ~
-:.
-:::
:::
--
-
-:::::::
-
--~~'-
""-....::--::.
-:.
EAU, TERR';4~~~
ViWo!Iliso!Ition 1
IsoSlI"lo!Ice· Fin~ontJutur 7k .. Niveo!lu de sUff~e
4.8500COJe+Ol • 4.8400002e+Ol • 4.829999ge+Ol 4.B200001e+Ol 1 4.B099998e+Ol 1 4.800000Je+01 4.7900002e+01
b
4.779999ge+01 4.7700001 e+01 r:::::i 4.759999Be+01 r:i 4.750000Je+01n
4.7400002e+01 D 4.729999ge+Ol 4.7200001,.01Q
.
4.709999Be+Ol 4.7000COJe+Ol=
4.S900002e+Ol • 4.679999ge+Ol 4.6700001e+Ol=
4.659999Be+01 • 4.650000Je+01 ...A-39
Plate 37: NEW PILES-7700 m³/s - Water Level
EAU, TERR';4~~~
-EAU, TERR mis . 3.0+ . 2.85
rJ
2.70 n 2.55n
2.40 n 2.25n
2.10n
1.95 1.800
1.65n
1.50 1.350
1.20 . 1.05 0.90 . 0.75 . 0.60 . 0.45 . 0.30 . 0.15A-41
Plate 39: PROPOSITION-7700 m³/s - Velocity Modulus
0.1
. 0.0
EAU, TERR
mis . 3.0+ . 2.85 2.70 n 2.55
n
2.40 n 2.25n
2.10 1.95 1.80D
1.650
1.50 n 1.350
1 .20 . 1.05 0.90 . 0.75 . 0.60 . 0.45 . 0.30 . 0.15 . 0.0 ........ ... , " " " ...:
:
-
-, ...... -- -,,' " ... "'
-... ........ ' -" " EAU, TERR ",-
" , "'
--
--,
" -:. ...... -"-
... :::--
... :. -...... " ,A-43
Plate 41: PROPOSITION-7700 m³/s - Water Level
Visualis~ion 1
IsoS~face - FinaF'crl._Plopo 7k -Niveau de slIfo!Ce 4.840C0J2e+Ol 4.831499ge .. Ol