WORKING
PAPERS
SES
N. 488
IX.2017
Faculté des sciences économiques et sociales Wirtschafts- und sozialwissenschaftliche Fakultät
Peer Effects on Perseverance
Berno Buechel,
Lydia Mechtenberg,
and
1
Peer Effects on Perseverance*
Berno Buechel
a, Lydia Mechtenberg
b, and Julia Petersen
bSeptember 8, 2017
Abstract
Successful performance – be it in school, at the job, or in sports activities – requires perseverance, i.e., persistent work on a demanding task. We investigate in a controlled laboratory experiment how an individual’s social environment affects perseverance. We find evidence for two kinds of peer effects: being observed by a peer can serve as a commitment device, while observing a peer can be informative. In particular, we show that successful peers affect perseverance positively if they communicate their success in a motivating way and negatively otherwise, while perseverance is unaffected by unsuccessful peers. Our experimental results suggest that peers affect perseverance indirectly, via influencing self-confidence. We turn to field data from an educational setting and find that students seem to be able to harness the power of peer effects, by selecting into groups that help them reach their goals.
Keywords: Self-control; Peer Effects; Social Networks; Experiment
JEL-Classification: C91; D90; I21; J24
_________________________
a University of Fribourg, Department of Economics, Bd. de Pérolles 90, 1700 Fribourg, Switzerland. Email:
[email protected]. Web: www.berno.info
b University of Hamburg, Department of Economics, Von-Melle-Park 5, 20148 Hamburg, Germany. Email:
[email protected], [email protected]. Tel.: +49-30-25491-446.
* We thank Ugo Bolleta, Bryan Graham, Jean-Robert Tyran, the participants of the workshop on Behavioral Public Economics at the University of Vienna, 2014, and the participants of the 'Economics and Leadership' conference in Groningen 2017. Special thanks go to the WISO lab crew: Olaf Bock (leader), Thais M. Hamasaki, Jan Papemeier, Fenja Pauls, and Merlinde Claudia Tews; and to Willi Flemming and Lorenz Rumberger for supreme research assistance in this particularly demanding experiment.
2
1
Introduction
1.1 Motivation
Some people are more successful than others. Be it in school, at the job, or in sports activities, there are tasks which require painful effort at some point. While many people let themselves get distracted or fully give up, others stay focused and keep working on the successful completion, i.e. they persevere. Clearly, perseverance is to some extent a matter of personality. However, individual behavior is also shaped by the social environment, which includes peers, teachers, parents, and coaches. Personal interactions can have two very distinct effects on individual perseverance.
On the one hand, others who know about the task at hand and interact with the individual after the task can induce social pressure. This is the typical view that peer effects work through being observed by peers. On the other hand, observing peers before the own task can affect an individual’s ability to persevere. More experienced peers, as well as mentors and coaches, may foreshadow the value of perseverance and affect the confidence of the one aspiring to successfully complete a task.1 It is important to understand the conditions for positive and negative peer effects on perseverance because they can have severe consequences. Applications range from students’ educational success, over performance of sports athletes, to success within organizations.
In this paper, we test both categories of peer effects on perseverance in a controlled laboratory experiment and we illustrate the importance of peers for self-control – which is necessary for perseverance – in a field study. We find that both types of peer effects are present in some way. Peer pressure to justify the own performance after the task induces participants to try for a longer period before giving up. Communication with a successful peer before the task, on the other hand, can either induce participants to give up immediately or to persevere, depending on the content of the communication. This last result means that a successful peer can have a crucial effect on the perseverance of a less experienced individual, while unsuccessful peers are rather ignored, according to our data.
1 As an illustration of the two categories of peer effects, we may consider a leisure time runner who aspires to
complete a marathon. Joining a group of runners might have a positive effect for the ability to persevere for multiple reasons. Committing to regularly practicing together and having announced the own plan to participate in a certain marathon to the group clearly fall into the category of peer effects through peer pressure. Learning about the challenges that running a marathon implies and increasing the own self-confidence by observing that others have succeeded to finish a marathon clearly falls into to the category of peer effects through learning. Yet, to choose a group of runners, it is important to know which effect is at work, under which conditions they are working, and when there are actually negative peer effects.
3
We provide one of the first experimental studies on how peers influence individual perseverance by their own success or failure.2 We find that the effect depends on the way peers
communicate about the difficulty of the task. In the field study, we illustrate the relation between own self-control and the social network one maintains in an economically relevant environment.
1.2 Two Categories of Peer Effects
Perseverance, which is required to successfully complete a demanding task, necessitates self-control, i.e. the strength to resist temptations to procrastinate. For instance, a student might want to study hard in the evening, in order to be well prepared for class the next day and to eventually perform better in the exam by the end of the semester. However, when evening actually arrives, the now immediate psychological costs from studying become much more salient than the still relatively far-away benefits, and the student is severely tempted to go out instead. More generally, if a disproportionally high weight is attached to whatever costs or benefits would accrue immediately, then plans implying that investments precede benefits will be likely to fail due to the temptation to avoid immediate costs. Since performance plans typically are of this kind, a present bias can impede perseverance and hence performance. This link is studied in the literature on present-biased preferences.3
The vast majority of the studies on peer effects suggest that being observed by peers can enhance performance, e.g. due to peer pressure.4 In contexts of perseverance this means that
peers could serve as a commitment device: By imposing some social cost on a person whom they observe giving in to a temptation, they can help that person not to give in. An example for such a strategy in the educational context is a group of students who agree to meet at 8 am at the library and who would not appreciate any breach of this agreement. Their agreement is a commitment to start early with studying on that day. Considering peers as commitment devices is an interesting variation of the general idea that commitment devices can help overcome self-control problems.5
2 The only other study we are aware of is the one by Gerhards and Gravert (2017).
3 For theoretical contributions see, e.g., Strotz (1955), Thaler and Shefrin (1981), Ainslie and Haslam (1992),
Laibson (1997), O’Donoghue and Rabin (1999), Gul and Pesendorfer (2001), Bénabou and Pycia (2002), and Fudenberg and Levine (2006). Recent experimental contributions on time preferences include Ariely and Wertenbroch (2002), Andersen et al. (2008), Benhabib, Bisin and Schotter (2008) and Andreoni and Sprenger (2012).
4 See, e.g. Hoxby (2000), Hoxby and Weingarth (2005), Zimmerman (2003), Falk and Ichino (2006), Mas and
Moretti (2009), and Calvo-Armengol, Patacchini and Zenou (2009). The latter combines theory and empirics to investigate peer effects in an educational setting.
4
The second category of peer effects on perseverance is elaborated in the theory of Battaglini, Bénabou and Tirole (2005), hereafter: BBT, which provides us with our main hypotheses. They stipulate that observing one’s peers - rather than being observed by them - can affect own performance. The reason is that the behavior of others can be informative about how much the task at hand would challenge one’s own self-control.
In BBT, self-control is the ability to persevere on a task (that may be anything from not drinking alcohol to preparing for an exam or working on a paper). Individuals have imperfect knowledge about their own self-control, but know that levels of self-control are positively correlated within their peer group. Hence, observing how peers react to temptations provides individuals with additional information about their own level of control. This, in turn, affects their self-confidence and consequently the degree to which they themselves exhibit self-controlled behavior in the future.6 Intuitively, observing how peers can handle similar challenges to their willpower can be encouraging or discouraging (“if he can do it, then so can I” or “if not even he can do it, then I do not even have to try”). Hence, the theory of BBT is complementary to the vast majority of the literature on peer effects which assumes that being observed by – rather than observing – one’s peers affects own performance.
1.3 Our Contribution
In a large lab experiment with overlapping generations, we address the question whether observing or being observed affects own perseverance and performance. Hence, we test the major claims that BBT and the empirical literature on peer effects make about causality against each other. For this purpose, we match subjects who face a challenge to perseverance with subjects who faced the same challenge before and whose success or failure is observed by the former. We let the matched pairs talk to each other in bilateral free text chats about the challenge. Some of the subjects who chat after the task anticipate being observed by and chatting with the peer, and some do not. The former setting is the commitment treatment in which being observed by peers may function as commitment device. Subjects who chat before the task can be encouraged or discouraged to persevere later on by observing an experienced peer. We find that knowing in advance that one has to justify one’s own performance toward one’s peers prevents giving up immediately but does not necessarily have long-lasting effects on perseverance. Hence, there seems to be a commitment effect as stipulated by the empirical literature on peer effects. However, we also find effects on those unpracticed peers who observe
6 Relatedly, Bénabou and Tirole (2002, 2003) and Mechtenberg (2009) theoretically study effects of
communication on self-confidence of subjects with incomplete self-knowledge. These studies find both positive and negative effects on self-confidence, i.e. learning from a peer can be both encouraging and discouraging.
5
how their advanced peers explain their own success. More specifically, both motivating and de-motivating messages from the advanced peer affect own perseverance if and only if the peer had been successful in her own task. A peer’s success or failure in itself, unmediated by communication, has no effect on perseverance.
In our lab experiment, communication is the channel through which information that is assumed to be public in BBT is made available. Communication addresses in particular information on how, according to the experienced peer’s belief, the subjective difficulty of the task at hand – or, alternatively, the individual level of self-control – is distributed in the population. Hence, our lab experiment combines the approach of BBT with a communication channel similar to the one discussed in Bénabou and Tirole (2002, 2003) and Mechtenberg (2009). The presence of communication channels is also the main feature of our experimental design that essentially distinguishes our lab experiment from the one conducted by Gerhards and Gravert (2017). As opposed to them, we do not find that observing one’s peers – without the mediation of communication – has any effect on perseverance; in our lab experiment, it is the interaction between listening to communication and observing success that is effective.
While we implement exogenous bilateral relationships of students in the lab to identify directions of causality in peer effects on perseverance, it is an endogenous social network of students that we investigate in our field study. The move to an endogenous network is the logical next step in our analysis since in reality, the total net peer effects on perseverance and the resulting performance depend on whether subjects connect to those peers who have positive rather than negative effects on their perseverance. BBT assume such rationality, but real network formation decisions might look different. First, other motives, like homophily on observable characteristics, play a role (Currarini et. al., 2009) and, second, it is realistic to assume that there is also a stochastic element in who connects with whom (Jackson and Rogers, 2007) . Whether subjects form helpful rather than harmful social networks in the presence of a task that challenges their self-control is an empirical question.
In our field study, we behaviorally elicit individual self-control, talent, and performance; and we reconstruct the social network of our students with survey methods.7 We show that more self-controlled students are better connected to their peers, have better access to highly talented peers and write better exam grades than students with low self-control. Our findings are consistent with BBT and the empirical test of their theory in Battaglini, Diaz, and Patacchini
7 Communication is less salient in our field study, but is indirectly present there, too, since we elicit real-world
networks of students that obviously include communication channels. In our field study, we measure individual time-consistency rather than perseverance to elicit self-control.
6
(2015). In particular, we find evidence for their prediction that individuals with low self-control rationally remain unconnected to their peers while individuals with sufficiently high self-control connect to them. In addition, we find that connectedness and performance are positively correlated, which is in line with both the theory and the empirical results of Calvó-Armengol, Patacchini and Zenou (2009). Specifically, we find that it is connectedness to talented friends that correlates with performance. We conclude that students seem to be able to harness the power of peer effects, by selecting into groups that help them reach their goals.
To our knowledge, we are the first to combine within one field study the behavioral measurement of self-control with the measurement of subjects’ social network. Moreover, we are the first to combine a lab experiment with a field study to investigate peer effects on perseverance.
2 Lab Experiment
We first introduce the experimental design and implementation. Then we turn to the results.
2.1 Experimental Design
We first describe the task environment and then the overlapping-generations structure and the different treatments.
THE TASK ENVIRONMENT To measure perseverance, we implemented the combination
of a real-effort task with access to the internet (see, e.g., Corgnet et al. 2015). In order to create the necessary variation in perseverance, we chose a real-effort task that is (1) depleting, to require an effort to persevere, (2) meaningless, to reduce average intrinsic motivation, and (3) novel to our subject pool, to exclude experience from previous real-effort experiments. Subjects had to identify, among a number of meaningless strings of letters (like abCOCAcaZAgbCBZ) any such strings that contain the letter combination “abc” (in all combinations of small and capital letters) if that is followed by a vowel. (For such tasks and their depleting effect, see Baumeister et al., 1998, and many others as surveyed in Hagger, Wood, & Stiff, 2010.)
The task was divided into ten subtasks, each consisting of 99 strings displayed on the computer screen, with five input fields for the five strings that had to be identified. A subtask was counted as correctly solved if at least four of the five strings were identified correctly. The entire task was counted as correctly solved if five out of the ten subtasks were solved. We chose these standards (after piloting the real-effort task) to allow approximately one third of our subjects to solve the entire task correctly. For the correctly solved task, a bonus of 100 points was paid.
7
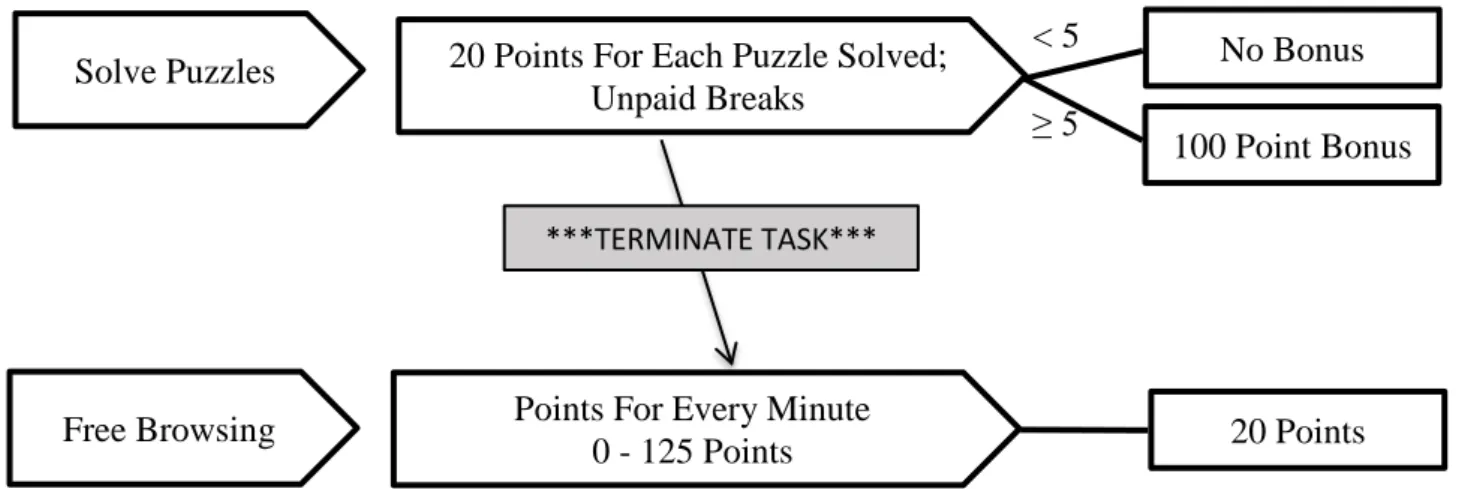
Additional points were paid for each subtask that was correctly solved. The difficulty of the task was increasing in that more and more letters a, b, and c appeared in the strings, while still only five strings had to be identified. The points awarded for correct subtasks were fixed to 20. Subjects had 50 minutes to solve the task, but they could also give up on it whenever they wished. Those who wished to give up could click the terminate-task button always visible on the task screen and spend the remainder of their time browsing the internet.
Browsing the internet is a common diversion at the work-place and hence a realistic obstacle to perseverance. However, it is to be expected that the laboratory setting activates the social norm to exclusively concentrate on the experimental task. Moreover, access to the internet is typically blocked in lab experiments to enhance control. Therefore, granting access to the internet may well create a demand effect; subjects might deduce from the design that browsing the internet would be encoded as lack of perseverance. Thus, simply granting access to the internet might not be sufficient to induce any usage of it. To prevent the demand effect and to overcome the social norm of “no surfing in the lab”, we paid a small bonus of 20 points for terminating the real-effort task and paid “surfing points” for browsing the internet afterwards, thereby providing a possible rationale for giving up the task. Browsing the internet in minute t yielded t/10 points to someone who terminated the task. For instance, if a subject clicked the “terminate-task” button in minute 12, she earned 1.2 points in minute 12; 1.3 points in minute 13, and so on. Hence, who only browsed the internet and did not even start working on the task received 125 points in total. Generally, clicking the “terminate task” button at time T yielded 125 − 1
20𝑇𝑇2
points in total. 100 points correspond to 5 Euros. The payoff structure of the task environment is depicted in Figure 1. The respective amount of points possible to gain for continuing the task and for terminating it and surfing for the rest of the time was continuously announced on the experimental screen in z-tree.
Figure 1: Overview of Payoff Structure
≥ 5 < 5
Free Browsing Points For Every Minute
0 - 125 Points 20 Points
***TERMINATE TASK***
100 Point Bonus No Bonus 20 Points For Each Puzzle Solved;
Unpaid Breaks Solve Puzzles
8
The payoff structure is such that the following holds in virtually any case: If one solves at least five of the ten subtasks correctly, i.e., if one is eligible for the task bonus, then it pays off to continue on the task until the end, that is, to never click the “terminate task” button. If one solves less than five of the ten puzzles correctly, then it pays off to quit the task, that is, to click the “terminate task” button. In this case, the best choice is to terminate right after the beginning of the task. We did not communicate during the task whether the subject had reached the threshold for the bonus (this would strongly determine performance). Also, we took great care to explain the payoff structure and the choice between continuing and terminating the task in the instructions, using Figure 1. Subjects were given an example of a subtask in the instructions for them to assess their own confidence in their performance. Also, in the course of their work at the task we elicited their beliefs about whether or not they solved the last subtask correctly. Hence, we could validate that their termination decision was optimal, given their beliefs, which is true for more than 90% of the participants. (More precisely, of those who believed that they had solved five subtasks or more correctly, no one gave up. Of the remaining participants, most (84%) gave up at some point.)
To familiarize subjects with the website that they could browse after task termination, we explicitly stated in the instructions that taking occasional breaks from the task and surfing during the breaks are allowed. However, we did not pay any points for browsing the internet during a break. Breaks could be scheduled freely by clicking the break button and switching to a specific website created by us for a deliberate amount of time.8 Moreover, prior to each
subtask, subjects had to go on a website to search a password with which they could unlock the next subtask in z-tree. The website offered a broad variety of pictures and articles in many categories such as politics, sports, diets, celebrities, cartoons, and news; and during the unlocking of each subtask, subjects were made aware of the possible diversions offered on the website.
TREATMENTS We conducted four different treatments in a between-subjects design, two
newcomer treatments and two leader treatments. We now use the “leader” and “newcomer” terminology to easily refer to a more experienced peer versus an unexperienced peer. Subjects were invited in subsequent cohorts, with a leader cohort preceding a newcomer cohort; a cohort comprised twelve subjects, half as many as were cubicles in the lab. All treatments had two parts, a task part and a chat part. The task part was spent in the task environment as described above. In the chat part, subjects in a newcomer treatment were randomly matched one-to-one
8 Note that breaks need not signify lack of perseverance but might be part of an optimal working schedule since
9
with the subjects of the preceding leader treatment and could chat with their matched partner for three minutes. The treatment structure is depicted in Figure 2.
Figure 2: Treatments. Committed leaders (CL), newcomers with committed leaders (NewCL), uncommitted leaders (UCL), and newcomers with uncommitted leaders (NewUCL)
x
The chat part A newcomer matched with a leader from the precedent cohort in the first (chat)
part of a newcomer treatment learned the failure or success and the degree of perseverance of their matched partner, i.e., whether or not their matched partner had earned the bonus of 100 points and whether or not she had terminated the task. This was communicated to the newcomers on their computer screen and remained visible there throughout the next (task) part. In addition, newcomers could communicate with the matched leader via a chat window during the chat part. The chat opportunity lasted for three minutes. Chat format was free text; there were no prohibitions, except that anonymity must be kept. We asked the leaders from the preceding cohort to address the following three questions: 1) Please estimate the fraction of participants in percent that manage the task, i.e. who reached the bonus of 100 points. 2) Does it pay off to strive for the bonus or should the task be quit immediately? 3) Please, explain your recommendation. Question 1, in particular, was asked to measure the similarity that a leader assumed between herself and the average person, regarding performance on the task. A successful (unsuccessful) leader who believes more than half of the other subjects to be successful (unsuccessful) as well deems herself rather similar to the average person; a successful (unsuccessful) leader who believes that no other is successful (unsuccessful) as well deems herself exceptional. We assume that a newcomer – who has no experience with the task – tends to perceive herself as an average person with regard to the task environment. Thus, the answer that her matched leader gives to question 1 provides her with information about how similar she herself is to her matched leader. Since BBT implies that only similar peers have effects on subjects’ perseverance, we expect the answers given by the leaders to question 1 to
2 Chat 1 Chat 2 Task 1 Task 1 Task 1 Chat 2 Chat 2 Task
10
set the conditions for any effects of their success or failure on the perseverance of the matched newcomers.
Leader treatments In the commitment treatment “committed leaders” (short: CL) subjects are
leaders: They first do the task part and then the chat part. During the task part they know the content of the second part, i.e., that they will be matched with newcomers (after carrying out the task), that these newcomers will learn their success or failure and their perseverance, and that they will chat for three minutes. By contrast, in the other leader treatment “uncommitted leaders” (short: UCL) they do not anticipate the details of the chat part since instructions for that are only given after completion of the task part. Hence, subjects do not anticipate that they will be matched with newcomers of the subsequent cohort and that information about their own perseverance and performance will be provided to their matched partners.
Newcomer treatments In the “newcomers with committed leaders” treatment (short: NewCL)
subjects are newcomers: They first do the chat part and then the task part. They are matched with leaders from CL (committed leaders) in the chat part. In the other newcomer treatment “newcomers with uncommitted leaders” (short: NewUCL) subjects are matched with leaders from UCL (uncommitted leaders) during the chat part.
IMPLEMENTATION In total, we have N=336 participants which amounts to 84 subjects
(i.e., observations) per treatment. Despite the logistic complexities of this overlapping generations experiment and the IT reliability challenge to let participants seamlessly switch between experimental software and a web browser, there was only one case of a system failure within a regular session.9 Cohorts are overlapping: always two consecutive cohorts were
chatting with each other after the first of the two had finished the task and before the second started with it. Hence, for logistic reasons we conducted multiple sequences of sessions per day. We distributed these sequences of sessions across different days and made sure that treatments do not differ much in the days and time slots at which they were run. The experiment was run at the WISO-laboratory of Hamburg University. A different room outside the computer lab was reserved for reading of instructions and a subsequent quiz to guarantee understanding of the decision and payoff structure. Another room outside the lab was reserved for payment (in cash and in private). Communication other than required in the chat part of the experiment was prohibited. In the time span between the end of the task and leaving (in treatments NewCL and NewUCL) or chatting with the subsequent cohort (in treatments CL and UCL), subjects answered a questionnaire. This questionnaire elicited age and sex of the subject and other control variables. The chat data were transcribed and coded by a research assistant unaware of
11
the purpose of the study and the different treatments. The reliability of the coding was checked and confirmed by having another, equally unaware research assistant, coding the same chat protocols. The coding of the three questions that had to be addressed in the chat into answer categories was straight-forward.
2.2 Results
Before we turn to the effects of observing peers and to the effects of being observed by peers, we first provide some summary statistics for the main variables.
2.2.1 Some Summary Statistics
The main outcome variables are the number of subtasks solved correctly (Puzzles) and the dummy whether the bonus is reached or not (Bonus).
Table 1 reports summary statistics of these main outcome variables and also reports the payoff earned in EUR (Payoff) and the minutes participants stayed in the task before clicking the “terminate task” button (MinutesTask). The average number of correctly solved puzzles is below four, but still roughly every third participant (34%) reached the bonus of 100 points, which requires to solve five or more. There was indeed one person who solved 10 puzzles correctly, each time believed that the puzzle is solved correctly, and received the bonus of 100 points. (This leads to the maximal number of points of 10*20 + 10*1 + 100 =310, which yields the maximal payoff of EUR 15.50 + 8.00 = 23.50.) The average Payoff was around 16 EUR. In Table 1 there are separate outcome statistics for those participants who gave up, i.e. clicked the “terminate task” button at some point, and those who stayed in the task, reported in the last two columns. Separating these two groups, we observe that the bonus was reached by 73% of those who stayed in the task. The histogram below shows that those who stayed in the task solved typically five or six puzzles correctly. Very few managed to solve nine or ten tasks. Most of those who gave up solved none or less than three tasks. Table 2 reports the timing of giving up, i.e. the minutes before clicking the “terminate task” button, separated by the number of puzzles solved. Those who solved three or four puzzles gave up after 44 of 50 minutes, which indicates that they strived for the bonus until they realized that they would not reach it. Participants who solved two puzzles or less gave up earlier.
12
Figure 3: Histogram of Puzzles by Giving Up Decision
Since each participant was asked after each subtask whether she believed that she had solved it correctly, we can analyze the participants’ beliefs about the number of tasks they had solved correctly. The correlation of this belief with the actual amount solved correctly (Puzzles) is 0.88. Looking at the difference between these two variables, it turns out that a majority of participants, 72%, has exactly accurate beliefs, while 24% overestimate the amount, and 4% underestimate it. Hence, beliefs are quite accurate, but there is bias consistent with overconfidence. The bias is however weak since most overconfident participants overestimate the amount solved by one or two.
We now first analyze the effects of observing peers and communication, i.e., we focus on the newcomer treatments. Afterwards, we turn to the effects of being observed, i.e., we focus on the commitment treatment.
2.2.2 Effects of Observing Peers and Communication
Consider the newcomer treatments, NewCL and NewUCL. From the perspective of the newcomers, no treatment variable changes between these two treatments. Hence, when analyzing the newcomers’ reaction to what they observe from their matched leaders, we pool the data from NewCL and NewUCL.
The main aspect observed by a newcomer is whether her matched leader did or did not receive a bonus (captured by the dummy variable BonusPeer). This piece of information is highlighted during the chat and on each subtask in the newcomer treatments. Moreover, in the chat the leaders are asked to provide a guess about the fraction of participants that was able to receive
0
.2
.4
0 5 10 0 5 10
keep going give up
Fr a c ti o n
number of right solutions in 10 rounds
13
the bonus. The answers range from 0% to 100%, and we call this continuous variable FractionSuccess. As the histograms in Figure 4 show, leaders who do not receive the bonus more often guess that the number of participants receiving the bonus is small, but there is still a considerable variation across leaders such that our subjects in the newcomer treatments get very different signals about the difficulty of the task and their personal likelihood of being able to receive the bonus.
Figure 4: Histogram of FractionSuccess, i.e. the leader’s estimate concerning how many participants manage to reach the bonus, differentiated by whether the leader has received the bonus herself (right panel) or not (left
panel)
FractionSuccess provides information on the leader’s belief about how likely it is that the newcomer can succeed. Combined with the leader’s success or failure, FractionSuccess provides information on the peer’s belief on how similar she is to general population and hence to the newcomer. If it follows from FractionSuccess that most will succeed or fail like the peer, this signals high similarity. Moreover, in the chat leaders gave explicit recommendations whether to give up or to strive for the bonus, and we elicited how difficult the task is described as. These two variables Recommendation and Difficulty are highly correlated with the variable FractionSuccess, but coarser measures since they are binary, respectively ordinal.
In the following we regress the main outcome variables (Puzzles and Bonus) on BonusPeer and FractionSuccess, which are the two most important variables of observing and communicating with a peer. They cover the objective information provided by the experimenter that the peer (leader) has or has not received the bonus, as well as the subjective message of how hard it is to reach the bonus. Since it must be expected that these two variables interact with each other, we also include the interaction term. The outcome variable Puzzles is a count variable which
0
5
10
15
0 50 100 0 50 100
bonus no bonus yes
F
req
ue
nc
y
14
we estimate by a Poisson regression. The outcome variable Bonus is a binary variable, for which we use a logistic regression.
We first illustrate the results by plotting the predicted outcome values by different levels of FractionSuccess for both subjects with matched leaders who received a bonus and subjects with matched leaders who did not. We obtain the predicted number of puzzles and the predicted probability of a bonus for values of FractionSuccess that range from 0 to 100 with increments of 5.
Figure 5: Marginsplots of Puzzles and Bonus by FractionSuccess and BonusPeer
Figure 5 shows how the outcome variables are increasing in FractionSuccess for a matched leader who received a bonus and rather decreasing in FractionSuccess for a matched leader who did not. The graphs indicate that the best performance is predicted for those who observe that their matched leader obtained the bonus and who receive the message that a very high fraction were able to reach the bonus. Lowest performance is obtained if the matched leader received a bonus but reports that only very few are able to do so. It seems that a message from a peer who has been successful can be both particularly encouraging and particularly discouraging.
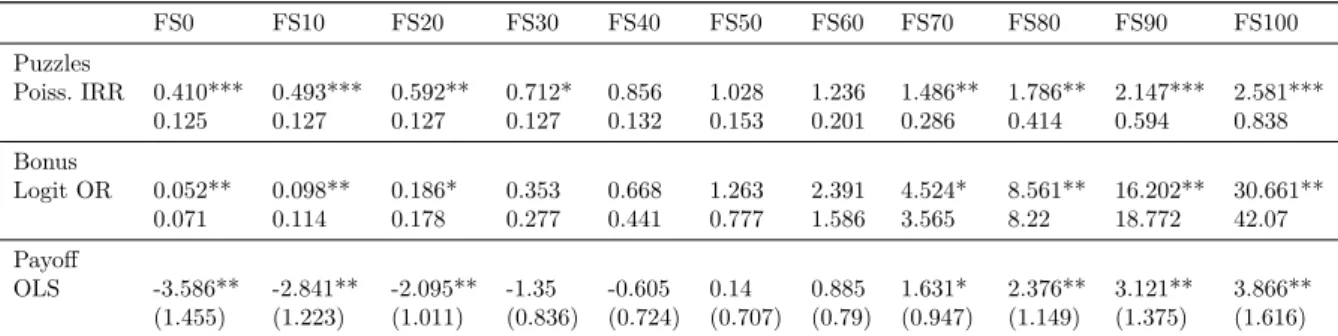
To investigate this interaction effect and to test for significance of the difference between having a peer with bonus and a peer without bonus, we run a sequence of regressions each time modifying the variable FractionSuccess by subtracting a constant from it. More precisely, we generate the variables FractionSuccess0, FractionSuccess10, FractionSuccess20, …, FractionSuccess100, with FractionSuccessk defined as FractionSuccess minus k. The results of these regressions are all identical apart from the coefficient of BonusPeer. Consider the interaction term, which is the product of the binary variable BonusPeer and the continuous variable FractionSuccessk. When the variable FractionSuccessk is zero, the interaction term is always zero such that the coefficient of BonusPeer picks up the whole effect. We use this fact to provide an interpretation for the effects. All coefficients of BonusPeer, which are the only
0 2 4 6 8 p re d ict e d a mo u n t so lve d (Pu zzl e s) 0 5 10 15 20 25 30 35 40 45 50 55 60 65 70 75 80 85 90 95 100 How many participants obtained the bonus? (FractionSuccess)
peer did not obtain the bonus peer obtained the bonus
j p 0 .2 .4 .6 .8 1 P(Bo n u s) 0 5 10 15 20 25 30 35 40 45 50 55 60 65 70 75 80 85 90 95 100 How many participants obtained the bonus? (FractionSuccess)
peer did not obtain the bonus peer obtained the bonus
15
coefficients that differ from the ones in Table 3, are reported in Table 4. Hence, the entries in FS0 of Table 4 correspond to the columns (1’), (2’), and (3) of Table 3.
First, we observe that significance levels are very similar across model specifications. Thus, the results seem to be robust. Second, the coefficients are significant for low values and for high values of FractionSuccess but not in between. Moreover, the sign of the effects changes from low to high values. We provide an interpretation for each outcome variable, starting with Puzzles.
EFFECTS ON PUZZLES Pure coefficients of the Poisson model cannot be interpreted easily
due to the log link function. Hence, we use the incidence rate ratio (IRR) interpretation. (The significance levels remain roughly the same comparing the robust and the IRR – option). At the lower end of the distribution, IRR coefficients are significant for FractionSuccess in the range from zero to thirty. For example, the IRR at FractionSuccess20 = 0,592 (see column ‘FS20’) is the estimated rate ratio comparing whether the matched leader received the bonus, i.e., was successful, or not, while holding the message FractionSuccess at the level of 20%. Those whose matched leader was successful are expected to have an incidence rate for Puzzles 0,592 times that of subjects whose peer was not successful, which is a decrease of 41%. Thus, a low FractionSuccess is bad news, in particular if the matched leader has received the bonus; it seems to transport the message “I did it but it was so hard, you should not try it”. Low FractionSuccess of a matched leader who did not receive the bonus is in principle bad news as well, but much less so. The statement that only few reached a bonus does not seem highly credible if it comes from a person who did not manage to receive the bonus. Maybe subjects believe that their unsuccessful peer did not even try and only wants to justify her own behavior.
The IRR-coefficients at the upper end are significant for FractionSuccess in the range from 70 to 100 (with very high significance for 80-100). For instance, holding FractionSuccess at a high level of 80%, i.e., considering FractionSuccess80, the IRR coefficient is 1.786 (column ‘FS80’): Those who receive the news that their matched leader has received the bonus are expected to have an incidence rate for Puzzles 1,786 times that of subjects that receive the opposite news, which corresponds to an increase of almost 79%. This is the good-news effect; it seems to transport the message “I could do it and I am similar to the average person, then so can you”. It seems encouraging to hear that many of the subjects are able to receive the bonus from a person who did it as well.
EFFECTS ON BONUS and PAYOFF Turning to the outcome variables Bonus and Payoff,
we observe that the significance levels for the different FractionSuccess values are very similar to Poisson estimates of the outcome variable Puzzles. Effects are significant at the upper and
16
the lower end of FractionSuccess with the same direction of the effect for each outcome variable. For instance, if the peer received a bonus and reported that only 20% were successful (i.e. at FractionSuccess20) the Payoff decreases by EUR 2.01. At the other end of the spectrum, the Payoff if one’s matched leader received a bonus and reported that 80% were successful increases by EUR 2.38, while the average payoff is EUR 15.73. Hence, there is a sizeable effect, not only on the number of puzzles solved and on the likelihood to receive a bonus, but also on the Payoff.
ROBUSTNESS These results remain valid when we include variables from the questionnaire.
As a test of robustness, we rerun the regressions including all variables from the questionnaire that survived the stepwise reduction procedures. The magnitude and significance levels are virtually the same.10
As another test of robustness we exchange the variable for the message FractionSuccess with the binary variable Recommendation, which is one if the matched leader recommends to stay in the task and zero if she recommends to give up at some point. Table 5 reports the main outcome variables in dependence of whether the matched leader has recommended to give up or to stay in the task. The table gives an indication that recommendation to stay has generally a positive effect on outcome. This strongly indicates that it is indeed perseverance which is mainly required to succeed in the task. It also confirms the strong interaction between the content of the chat and the success of the peer. Recommendations of peers who received the bonus heavily affect outcome variables. In particular, the most encouraging leaders are those who have received the bonus and recommend to strive for the bonus. We have the binary variable for the recommendation which is either “stay in the task” or “quit at some point”.11
Testing for significance (by a Fisher exact test and a Wilcoxon ranksum test) confirms: Recommendation to stay in the task leads to significant increase of Puzzles and a significant increase of the fraction of bonus reached, given that the matched leader has obtained the bonus (p<0.05).
10 The magnitudes are even a bit higher and the p-values are even a bit smaller when additional variables are
included. These results can be requested from the authors.
11 The coding of the chat for the recommendation entails three categories: “stay in the task”, “work first on the
task and quit later”, and “quit immediately”. The binary variable recommendation simply distinguishes between the first and the two latter categories.
17
Figure 6: Recommendation from a peer who has reached the bonus positively affects both the number of correctly solved subtasks (Puzzles, left panel, p<0.05) and whether the bonus has been reached (Bonus, right
panel, p<0.05).
Summarizing we find both a good news effect and a bad news effect. Thereby, the signal about the peer’s performance alone is not sufficient since it is put in relation to what the peer communicates. Good news is obtained from a successful peer who communicates in an encouraging way. Bad news are obtained from a successful peer who communicates in discouraging ways.
2.2.3 Effects of Being Observed by Peers
We now compare the commitment treatment CL, in which subjects know that their performance will be shown to a peer and that they are going to chat with this peer, to the other treatments. Table 6 reports summary statistics of the variable Puzzles for CL and for all the other treatments.12 Two-sample Wilcoxon rank-sum (Mann-Whitney) tests reveal: Puzzles is
significantly higher under CL than under both newcomer treatments, and significantly higher under CL than under all other treatments pooled. The effect of commitment on Puzzles is not so strong at the mean or the median as it is at the lower end of the distribution. While the null hypothesis is not rejected for CL vs. UCL (the uncommitted-leaders treatment) when using the rank-sum test (with p=0.2643), it is rejected when considering the fraction of participants who solved at least one, respectively at least two, puzzles. Fisher exact tests reveal that a fraction of subjects who solved at least one (or at least two) puzzles correctly is significantly higher under CL than under each of the three other treatments on the 5% significance level, as well as higher under CL than under all other treatments pooled, of course. Hence, subjects who know that their
12 For the newcomer treatments, we have seen that there are positive and negative effects, depending on the peer.
These effects may well cancel each other out such that no treatment effects may be apparent when comparing the newcomer treatments with the UCL treatment.
1.75 3.7 0 1 2 3 4 Puzzles
Recommendation: "Give up" Recommendation: "Stay" 8.3% 40.5% 0% 10% 20% 30% 40% 50% Bonus
Recommendation: "Give up" Recommendation: "Stay"
18
result will be observed by a peer and that they have to justify themselves in a chat, tend to solve more puzzles on average and less often solve zero or only one puzzle.
Figure 7: Fraction who solved at least one subtask, respectively at least two subtasks, is higher in the committed leader treatment than in the uncommitted leader treatment (Fisher exact tests: p<0.05).
It seems that the fact that there will be an observer to whom the subject has to justify her performance motivates the participants to try the puzzles at least for a while. If subjects manage to solve five puzzles this behavior pays off with a bonus of 100 points. Otherwise, this is not so clear because at the same time the subjects could have earned points for surfing in the internet. In particular, subjects who solve two, three or four puzzles can neither accumulate much points in the surfing mode nor receive the bonus of 100 points. Correspondingly, we do not find that the commitment treatment significantly increases the likelihood of receiving the bonus (not reported here). In the commitment treatment the fraction is 36% and in the other treatments 33%. Hence, it is not surprising that the difference of the commitment treatment CL to the other treatments in the number of puzzles solved does not materialize in higher payoffs. The average payoffs are 15.81 for CL and 15.70 EUR for all other treatments (these numbers are not repeated in the appendix).
2.3 Summary of Experimental Results
We find that knowing in advance that one has to justify one’s own perseverance toward one’s peers prevents giving up immediately but does not necessarily have long-lasting effects on perseverance. Hence, there seems to be a commitment effect as stipulated by the empirical literature on peer effects. However, we also find effects on those who observe how their advanced peers explain their own success or justify their own failure. More specifically, both
77.4% 67.9% 90.5% 81.0% 50.0% 55.0% 60.0% 65.0% 70.0% 75.0% 80.0% 85.0% 90.0% 95.0% Frac >0 Frac >1
Puzzles by Commitment
19
motivating and de-motivating messages from the advanced peer affect own perseverance if and only if the peer had been successful in her own task. A peer’s success or failure in itself, unmediated by communication, has no effect on perseverance. Our findings provide evidence both for the direction of causality assumed by the empirical literature on peer effects and the direction of causality suggested by BBT.
3 Field Study
By randomly matching peers in our lab experiment, we have assured that who interacts with whom is exogenous. In reality, however, people actively form (friendship) ties and hence the network is endogenous. Moreover, in the field we can study less artificial tasks that are economically more relevant. Hence, we did a field study that complements the lab experiment.13
3.1 Hypotheses
Individuals who achieve their goals are typically more self-controlled than those who set the same goals but fail to achieve them. We use this insight to implement a behavioral measure of self-control in our experiment. In theory, individuals learn from their experience and adjust their goal-setting behavior to their perceived level of self-control.14 Consequently, a behavioral measure of self-control can best be obtained from goal achievement at early stages of this learning process, i.e., from observing how well individuals not yet fully informed about their own self-control relate to their early goals. Hence, we (behaviorally) equate high self-control with a high level of early goal achievement.
We are now in a position to formulate our first two hypotheses:
H1 Performance increases in self-control, i.e., in early goal achievement.
H2 Individuals with high self-control invest more effort into achieving their goals than individuals with low self-control.
Our main question is how self-control interacts with one’s position in a social network and thereby with peer effects. BBT argue that only sufficiently self-controlled individuals profit from the interaction with peers; but they profit more from peers who are similar to them in
13 A more detailed description of this field study can be found in an earlier working paper version that was
entitled “Peer Effects and Student’s Self-Control”.
20
terms of self-control. This is because teaming up is helpful only if “good news” about the level of self-control of the other team members is sufficiently likely. Hence, if social network formation is endogenous and individuals link strategically (cf. Jackson and Wolinsky, 1996), then the individuals with higher levels of prior self-control will choose to team up with each other whereas those with low levels of prior self-control will stay alone. Thus, two testable predictions of the BBT model are, first, that only sufficiently self-controlled individuals have a strictly positive number of links to others, and, second, that self-control is correlated among direct friends.
The BBT model does not account for human capital. However, it is easy to see how an extended reasoning along its lines can be used to bridge the gap between the literature on self-control and the literature on how human capital of peers can affect achievement: Since self-controlled people tend to persist in their performance plans, they tend to acquire more human capital. Consequently, they become more valuable peers with regard to the peer effects on achievement that can be expected from them. If indeed only sufficiently self-controlled individuals connect with others, as the BBT model suggests, then only sufficiently self-controlled individuals will enjoy positive peer effects on their performance. Hence, we hypothesize:
H3 Performance increases in the number of talented friends.
H4 People with high self-control (a) are more likely to connect to others, (b) have a higher overall number of friends, and (c) have a higher number of talented friends.
3.2 Study Design and Implementation
3.2.1 Procedure
We conducted our field study in a large undergraduate Microeconomics course at the University of Hamburg in the summer semester of 2013.15 In total, 117 first-year students regularly participated in the lecture and the tutorials.
Our experiment was conducted in the following five waves: 1. Survey on aspired course grades and current study time 2. Survey on intermediate goals
15 In Hamburg, like in most German cities, courses in the summer semester are taught from beginning of April to
21
3. Measurement of intermediate goal achievement 4. Elicitation of students’ social network
5. Exam
Students could not anticipate upcoming waves, and they were not told before the beginning of the fourth wave that they were part of a field study.16 Rather, they were told that some faculty wanted to analyze students' learning conditions and study behavior. Moreover, the experimenters who actually entered classes were not involved in teaching the lecture or tutorial courses.17 The teaching assistants were informed about who would enter their classes on which days and were told that the interventions they witnessed were part of a study on student behavior.18 They have never been informed about the fourth wave of the experiment or about the purpose of the first three waves before the end of the semester. Furthermore, they were instructed not to provide possible interpretations of our study to the students. Apparently students accepted our explanation of the interventions in their classes and never approached an experimenter or teaching assistant on this issue.
THE FIRST WAVE In the first wave, we conducted a survey in each tutorial, asking which grades students aspired to and how many minutes they on average studied per week for this specific course.
THE SECOND WAVE The second wave was mainly dedicated to induce students to set goals for themselves at a relatively early stage of the course, since their behavior with respect to these goals allows us to measure students’ self-control at a later point in time. This wave was conducted in the tutorials. Each teaching assistant announced that some organizational issues were to be settled within the ongoing session of the tutorial course. Two intermediate goals were elicited.
Intermediate goal with partial commitment A senior student who was not informed about the purpose or content of our study entered the tutorial course and truthfully explained to the students that they could enroll in a non-compulsory one-day micro workshop. Moreover, he mentioned that enrolment was not obligatory for participants but that each student who, though
16 We received consent of the department to conduct this study.
17 The experimental team that actually entered the classes to conduct the experiment consisted of two of the three
authors of this paper. The third author, Lydia Mechtenberg, committed both not to act as an experimenter in class and not to receive the data set in a non-anonymized form, since she was the lecturer of the Microeconomics course. Exams were graded by the teaching assistants who did not know the purpose of the study and never received access to the data set.
18 In the second wave, they announced the modalities of handing in the mid-term problem set as a natural part of
their teaching job. These modalities were designed for experimental purposes about which, however, the teaching assistants were not informed.
22
enrolled, would not show up for the workshop would have to pay a fee of 3 EUR. By contrast, participation, both with and without enrolment, was free of charge. It was also made clear that payment of the fee would be asserted.19 Hence, students were offered a pre-designed goal (participating in the workshop) together with a commitment device (the fee). Then, the senior student distributed enrolment forms that again mentioned the fee and provided the link to a website where online enrolment for the workshop was possible. Finally, he collected the enrolment forms and left the class.
Intermediate goal without commitment The teaching assistant truthfully explained to his
students that they had to submit a compulsory midterm assignment in order to be eligible for the final exam. This assignment – a standard problem set – was identical for all students. The quality of the solution was not decisive for students’ admission to the final exam; but their solution had to fulfill the minimum requirement of being a recognizable attempt to solve all problems of the problem set. The teaching assistant explained to his students that they had to choose between two submission deadlines, an early and a late one, which were neutrally framed. He distributed forms on which the two deadlines were specified and the students were asked to individually choose their preferred deadline. Hence, students were offered the possibility of regulating their own future learning behavior by choosing the goal of submitting early. Students were told that their choice was not binding but helpful for organizational purposes. They were also told that assignments handed in after the late deadline would not be considered and excluded the students from the possibility of taking the exam. This information was provided online, too, and was repeated several times in the lecture to make sure that all students enrolled would understand it. To provide a (weak) incentive for students to choose the early deadline, a weakly informative online feedback about the quality of their solution of the midterm assignment was promised to students who submitted prior to the early deadline. However, we instructed the teaching assistants not to provide the correct solutions of the midterm assignments in their online feedback. No feedback was provided to students who submitted prior to the late but after the early deadline. However, any student always – also after the early deadline – had the opportunity to approach their teaching assistant after the tutorials or during the office hours to get any information about any exercise they needed help with.
THE THIRD WAVE The organizing team of the workshop collected the data about students’ enrolments and their actual participation and passed them on to the experimental team. The workshop took place on a weekend day after the third wave of the experiment. In its course,
19In fact, teaching assistants and the experimental team collected the fee within the three weeks after the workshop
23
additional exercises related to the content of the micro course and prepared by the organizing team were discussed. The teaching assistants collected all data about students’ choices of a submission deadline and registered whether students’ actually submitted before the chosen deadline. Again, all data were passed on to the experimental team.
THE FOURTH WAVE The main purpose of the fourth wave was to elicit students’ networks. We conducted a final survey in which students were asked to name the peers with whom they had joined to prepare themselves for the exam (outside the official lectures and tutorials). These lists of names allow us to reconstruct the social network of learning relationships within class.20 For each of the listed friends some further survey questions specified the kind of relationship, e.g., since when they know each other. We also asked how they perceived their own, their peers’, and other students’ degree of self-control.21
THE FIFTH WAVE Students wrote the final exam either at the beginning or at the end of the semester break. Thereby, they could score between 0 and 90 points.22
3.2.2 Key Measures
MEASURING PERFORMANCE, TALENT AND EFFORT We use the score in the final
exam to measure performance, since it fully determines the overall course grades. We also obtained the scores (and grades) from a previous math course as a control variable for talent since a proficiency in math was important both for solving the preparatory problem sets and for doing well in the exam.
MEASURING SELF-CONTROL We constructed an indicator variable, self control, that
measures whether a student behaved in a time-consistent way, i.e., achieved her own intermediate goals. A student’s two intermediate goals are to submit the midterm assignment prior to the deadline that she herself had previously chosen and to participate in the workshop in case that she had registered for participation. Among the 63 students who signed up for the micro workshop, a share of 73% (46 students) attended it. Early midterm assignment was planned by 107 students, but only a share of 73% (78 students) actually delivered early. The binary variable self control becomes one if the student both submitted prior to her self-chosen deadline and did not fail to attend the workshop if enrolled. This variable captures self-control
20 Literally, the social network is directed because some students are mentioned by others who do not mention
them. However, it seems more reasonable to consider learning relations as bilateral and to believe that two students have learned together even if only one of them reports this, e.g., because the other learning partner was absent on the day on which we conducted the final survey. We use the two direct networks to test for robustness of the results.
21 Students reported their perceived degree of self-control on a scale between 0 and 10.
22 Students who failed to pass at the early date were automatically eligible to write a new version of the exam at
24
since it assigns low self-control to students who cannot resist the temptation to procrastinate when preparing the midterm assignment or the temptation to spend their week-end in a more agreeable way than by attending a workshop that they had planned to attend.23 The basic assumption underlying the construction of the indicator variable is that, as implied by economic theory, the economic concept of self-control can be equated with time-consistent behavior. An important alternative interpretation would be that self control captures an advantage in human capital of those students who attended the workshop and received feedback after an early submission of their midterm assignment. To test whether this is true, we conducted a Wilcoxon rank-sum test comparing the performance of those who attended the workshop and received the feedback with those who did not. The result is displayed in Table 9. There is no evidence that workshop attendance and feedback affected performance. Hence, we can be confident that self control measures time inconsistency only.
MEASURING STUDENTS’ SOCIAL NETWORK POSITION We created two different variables: friends and degree. The binary variable friends takes the value one if the student is at all connected to others, i.e., is part of a study group, and zero otherwise. The variable degree counts the student’s direct links to others, i.e. the number of learning partners.24 We computed both variables from the undirected social network. In order to check for robustness of our results we also use variables derived from the directed network.
DIFFERENTIATION OF PEERS To further substantiate friends’ peer effects we categorize them as talented or untalented according to their math score. The count variable talented friends counts the number of links to fellow students who have a math score weakly above 58 points, while the count variable untalented friends counts the number of links to fellow students who have a math score weakly below 55 points. The chosen threshold makes use of the fact that no student achieved a math score between 55 and 58; and it splits all friends in two categories of equal size.
Descriptive statistics of our most important variables are provided in Table 7.
23 In principle, we can also construct two separate indicator variables for time-consistent behavior concerning each
of the two intermediate goals. While many of our results are qualitatively unaffected, there is simply less variation in these two measures.
24 Further network statistics, such as measures of centrality, are difficult to interpret since the network is quite
25
3.3 Main Results
3.3.1 Determinants of Performance
Table 8 displays the results on how individual characteristics, including self-control, general connectedness to other students and specific connectedness to highly talented students affect performance. In all models, we tested for the presence of omitted variables with a specification-error test as well as for multicollinearity and rejected both. Moreover, ordinary least square (OLS) estimates were calculated with robust standard errors. We additionally used a two-step FGLS (feasible generalized least square) method to account for heteroskedasticity and thus to gain efficiency.
SELF-CONTROL AND TALENT Both individual self-control and talent have a positive effect on performance. Pairwise correlation of the dependent variable and these regressor variables yields a correlation coefficient of 0.66 (with a p-value smaller than 0.001) for talent and performance, while the correlation coefficient of self-control and performance is 0.30 (with a p-value of 0.003). The effect of talent is significant at the 1% level across all model specifications. Self-control is statistically significant, albeit to a lesser degree. Being highly self-controlled is associated roughly with an eight points higher micro score, which is substantial since the maximal score is 90 and the median score is 58. The standard deviation of math score, our control variable for talent, is 21 (reported in Table 7); an increase of one standard deviation in math score leads to a rise of 12 points in the micro score. These results fully support our hypothesis H1 that self-control positively affects performance.
SELF-CONTROL AND PEER EFFECTS The number of friends in general, measured by degree, has no significant effect on performance when controlling for talent and self-control (see columns 2 and 3 in Table 8). However, increasing the number of talented friends, i.e., friends with a high math score, significantly improves performance, which is fully in line with our hypothesis H3. If we control for the number of talented friends, the effect of self-control becomes weaker. Within the OLS regression the effect of self-control is of the same dimension but insignificant. In the FGLS model, the effect of self-control remains significant when controlling for the number of talented friends. Since overall model diagnostic statistics favor the FGLS model, we conclude that both self-control and being connected to many talented peers significantly improve performance. Overall, we find strong evidence in support of our hypotheses H1 and H3.
26
3.3.2 The Interaction of Self-Control and Peer Effects
SELF-CONTROL AND STUDENTS’ SOCIAL NETWORK Figure 1 displays the social network of our students and provides a first impression of the relationship between self-control and connectedness. Importantly, most students who have at least one friend also have a high level of self-control, whereas the majority of those who are unconnected to any friends also exhibit low self-control. To be more precise, only 39% of the many isolates have a high level of self-control. In contrast, 71% of the students who have at least one friend also exhibit high self-control. This observation already suggests that network formation among students could well be fully in line with the BBT model, i.e., that only sufficiently self-controlled individuals profit from teaming up with similarly self-controlled peers.
Figure 8: Students’ learning network and their self-control. Light-green (dark-red) stands for a high (low) level of self-control. Circle (box) indicates a female (male) student.
To test this hypothesis we first consider the variable friends, i.e., the binary variable measuring whether a student is connected to any friends at all (friends = 1). Indeed, students with high self-control are much more likely to have connections to peers (Pearson Chi2 = 12.159 with p-value < 0.001 and Fisher’s exact test yields p-p-value = 0.001).25 To control for other individual characteristics, we run a probit regression with friends as a dependent variable, using self-control and further individual characteristics as covariates. A Hosmer-Lemeshow specification
27
test shows that all the models are well specified. Table 11 displays the results. Self-control and talent both have a statistically significant positive impact on the likelihood of being connected in different model specifications. Indeed, the predicted probability of being connected is 21% higher for individuals with high self-control than for those with low self-control, holding all other covariates constant.
We also tested whether self-control tends to increase the number of friends a student is connected to. Since the dependent variable degree, the number of friends, is a nonnegative integer, we use Poisson and negative binomial models. Results are shown in Table 11. Since overdispersion is present, negative binomial models provide the best fit. Our results support our findings from the previous binary outcome model. Highly self-controlled students have a higher number of friends; and this effect is significant at the 5% level in both models. Specifically, a discrete change from having low self-control to having high self-control is associated with 0.64 additional friends. To check for robustness, we use the directed network and estimate the effect of self-control on outdegree and indegree, i.e. the number of friends a student nominated in the survey, respectively how often the student was nominated. Both measures from the directed network show a significant effect of similar size.26 Overall, our estimates consistently show that highly self-controlled students are more likely to have friends and also tend to have more friends than students with low self-control. This is clear evidence for parts (a) and (b) of our hypothesis H4.
To test whether highly self-controlled students are also more likely to have highly talented friends, we ran two Poisson regressions with talented friends and untalented friends as response variables. Since the equidispersion property is not violated, models fitting the Poisson distribution are used. Results are reported in column 1 of Table 12. On average, the number of highly talented friends is increasing in self-control. This effect is positive and statistically significant, which supports part (c) of our hypothesis H4. The size of the effect is also substantial: Being highly self-controlled is associated with 0.35 additional talented friends. We also tested whether self-control affects the number of lowly talented friends, i.e., the number of friends with a low math score. As can be seen from the second column of Table 12, we do not find any effect of self-control on the number of lowly talented friends. Hence, while a highly self-controlled student is more likely than a student with low self-control to have friends at all, the former also seems to be more selective in choosing her friends than the latter. Since students with more talented friends perform better in the exam, these results imply that self-control facilitates positive peer effects on performance: More self-controlled students have better