HAL Id: hal-03007145
https://hal.archives-ouvertes.fr/hal-03007145
Submitted on 16 Nov 2020
HAL is a multi-disciplinary open access
archive for the deposit and dissemination of sci-entific research documents, whether they are pub-lished or not. The documents may come from teaching and research institutions in France or abroad, or from public or private research centers.
L’archive ouverte pluridisciplinaire HAL, est destinée au dépôt et à la diffusion de documents scientifiques de niveau recherche, publiés ou non, émanant des établissements d’enseignement et de recherche français ou étrangers, des laboratoires publics ou privés.
Dissolved organic matter released by two marine
heterotrophic bacterial strains and its bioavailability for
natural prokaryotic communities
Eva Ortega-Retuerta, Quentin Devresse, Jocelyne Caparros, Barbara Marie,
Olivier Crispi, Philippe Catala, Fabien Joux, Ingrid Obernosterer
To cite this version:
Eva Ortega-Retuerta, Quentin Devresse, Jocelyne Caparros, Barbara Marie, Olivier Crispi, et al.. Dissolved organic matter released by two marine heterotrophic bacterial strains and its bioavailability for natural prokaryotic communities. Environmental Microbiology, Society for Applied Microbiology and Wiley-Blackwell, 2020. �hal-03007145�
Dissolved organic matter released by two marine heterotrophic bacterial strains 1
and its bioavailability for natural prokaryotic communities 2
Eva Ortega-Retuerta, Quentin Devresse*, Jocelyne Caparros, Barbara Marie, Olivier 3
Crispi, Philippe Catala, Fabien Joux, Ingrid Obernosterer 4
CNRS/Sorbonne Université, UMR7621 Laboratoire d’Océanographie Microbienne, Banyuls sur Mer, France
5
* Present address: Geomar Helmholtz Centre for Ocean Research Kiel, Germany
6 7
Running title: Bacterial DOM release and bioavailability 8
9
Originality-Significance Statement 10
The role of heterotrophic prokaryotes as organic matter sources in the ocean is 11
increasingly receiving attention by the scientific community in view of its importance 12
for major biogeochemical fluxes, such as carbon sequestration via the “microbial carbon 13
pump”. Here we present novel data on dissolved organic matter (DOM) production by 14
bacterial strains and how this bacterial-derived DOM is degraded by in situ prokaryotic 15
communities and how bacterial DOM shapes microbial metabolism and diversity. We 16
demonstrate that DOM quality produced by bacteria depends on their taxonomy, which 17
translates into different degradation mechanisms and the growth of different microbial 18
communities. Even though a high amount of bacterial derived DOM can be degraded 19
within days, this DOM source would lower the prokaryotic growth efficiency of 20
degrading microbial communities compared to in situ DOM. 21
23
Summary 24
Marine heterotrophic prokaryotes (HP) play a key role in organic matter processing in 25
oceans; however, the view of HP as dissolved organic matter (DOM) sources remains 26
underexplored. In this study, we quantified and optically characterized the DOM 27
produced by two single marine bacterial strains. We then tested the availability of these 28
DOM sources to in situ Mediterranean Sea HP communities. Two bacterial strains were 29
used: Photobacterium angustum (a copiotrophic gammaproteobacterium) and 30
Sphingopyxis alaskensis (an oligotrophic alphaproteobacterium). When cultivated on
31
glucose as the sole carbon source, the two strains released from 7 to 23% of initial 32
glucose as bacterial derived DOM (B-DOM), the quality of which (as enrichment in 33
humic or protein-like substances) differed between strains. B-DOM promoted 34
significant growth and carbon consumption of natural HP communities, suggesting that 35
it was partly labile. However, B-DOM consistently promoted lower prokaryotic growth 36
efficiencies than in situ DOM. In addition, B-DOM changed HP exoenzymatic activities 37
enhancing aminopeptidase activity when degrading P. angustum DOM, and alkaline 38
phosphatase activity when using S. alaskensis DOM, and promoted differences in HP 39
diversity and composition. DOM produced by HP affects in situ prokaryotic metabolism 40
and diversity, thus changing the pathways for DOM cycling (e.g. respiration over 41
biomass production) in the ocean. 42
43
Keywords: microbial carbon pump, dissolved organic matter, bioavailability, 44
heterotrophic prokaryotes, prokaryotic diversity. 45
46
Introduction 47
Heterotrophic prokaryotes (HP, bacteria and archaea) are key players in element cycling 48
in the ocean. Roughly 50% of carbon that is fixed by primary production in the ocean is 49
passing through HP (Azam et al., 1983), which can be respired into CO2 (HP 50
respiration) or used to build up new biomass (HP production). The balance between 51
these two processes, expressed as prokaryotic growth efficiency, is a key parameter to 52
estimate carbon fluxes in the ocean and predict or model its changes (delGiorgio and 53
Cole, 1998). However, it has been demonstrated that HP also release carbon in the form 54
of dissolved organic matter (DOM). Pioneering studies showed that HP growing on 55
simple substrates (i.e. glucose) could produce a myriad of different DOM compounds 56
(Stoderegger and Herndl, 1998; Ogawa et al., 2001; Kawasaki and Benner, 2006). Since 57
then, numerous studies have attempted to characterize HP-derived DOM using 58
analytical techniques such as ultra-high-resolution Fourier transform-ion cyclotron 59
resonance-mass spectrometry (FT-ICR MS), high field nuclear magnetic resonance 60
(NMR) or 3D fluorescence spectroscopy, demonstrating that HP successively process 61
labile DOM and transform it into refractory DOM in an amount enough to sustain the 62
whole oceanic refractory DOM pool (Catalá et al., 2015; Lechtenfeld et al., 2015; 63
Osterholz et al., 2015). This process, termed the microbial carbon pump (MCP, (Jiao et 64
al., 2010) is an important carbon sequestration mechanism. It has been estimated that 65
carbon stored through the MCP accounts for 0.4% of primary production on a global 66
scale; this is in the same range as carbon stored through sinking particulate organic 67
matter (0.6 to 1.3% of primary production (Legendre et al., 2015)). 68
HP release DOM as metabolic by-products or as a consequence of the uncoupling of 69
anabolic and catabolic processes (Carlson et al., 2007). Since HP in the ocean exhibit a 70
wide range of metabolisms, DOM compounds released to the media are expected to 71
differ among HP taxa, as demonstrated previously using experimental incubations 72
(Shimotori et al., 2012; Noriega-Ortega et al., 2019). HP also actively release DOM 73
compounds for different processes such as polymer enzymatic cleaving (Smith et al., 74
1992), nutrient acquisition (e.g. siderophores for iron uptake (Andrews et al., 2003), 75
cell-cell communication (e.g. homoseryl lactones for quorum sensing (Gram et al., 76
2002)) or toxins (Christie-Oleza et al., 2012). Thus, environmental variables could 77
shape the quantity and quality of the DOM released, affecting DOM fluxes. Finally, 78
DOM degradation in the ocean, including HP-derived DOM, could depend on the 79
taxonomic composition of the DOM processing community (Teeling et al., 2012). To 80
better understand and predict changes in carbon sequestration through the microbial 81
carbon pump, accurate information about DOM production by heterotrophic 82
prokaryotes and its cycling in the ocean is a priority. How HP-derived DOM is 83
degraded and cycled, and which fraction of it would be respired to CO2 or would enter 84
the oceanic refractory DOM pool, are questions that remain to be resolved. 85
In this study, we aimed to evaluate the availability of DOM released by two single 86
bacterial strains as a substrate for Mediterranean Sea heterotrophic prokaryotic 87
communities. Our working hypotheses were (1) DOM quality differs among bacterial 88
strains and (2) these differences in quality promote the growth of different prokaryotic 89
communities, translated into different DOM degradation mechanisms. 90
To test these hypotheses, two step experiments were conducted: First, two single 91
bacterial strains with contrasting lifestyles and from different taxonomical classes 92
(Photobacterium angustum and Sphingopyxis alaskensis) were axenically grown in 93
minimum media with glucose as the only carbon source, and cultures were harvested at 94
early stationary phase where DOM was extracted, quantified and characterized. Second, 95
DOM derived from the strains was used as substrate for biodegradation experiments, 96
where in situ prokaryotic communities from the Mediterranean Sea were grown either 97
on in situ DOM or on the DOM produced by the two strains (Table 1, see experimental 98
procedures). In these experiments, changes in heterotrophic prokaryotic abundance were 99
followed together with changes in carbon and nutrients, exoenzyme activities and 100
prokaryotic community composition. 101
Results 103
Bacterial strain growth: Glucose and nutrient consumption; BDOM production 104
The two single strains used in the present study to produce bacterial-derived DOM 105
exhibited contrasting patterns both in their growth rates and carrying capacities (Table 106
2, Suppl. Fig. 1): Photobacterium angustum grew fast (growth rates 1.1-1.5 d-1), this is, 107
once the exponential growth started, the stationary phase was reached about 12h later, 108
with a cell abundance of around 5 x10⁶ cell mL-1 (Suppl. Fig. 1). Conversely, 109
Sphingopyxis alaskensis grew slower (growth rates of 0.07-0.23 d-1), with a longer lag-110
phase (3 to 5 days) but higher cell abundance (12 to 17 x106 cell mL-1, Suppl. Fig. 1) 111
when the stationary phase was achieved. 112
When cells and DOM were harvested, 12 to 17 µM of carbon as glucose was remaining 113
in the cultures (6-10% of initial glucose concentrations, Fig. 1). However, there was 42 114
to 73 µM of DOC remaining (Fig. 1). Comparing the decreases in glucose and in DOC 115
at the beginning and at the end of the incubations (see Experimental Procedures), we 116
estimated the amount of DOC that was produced by the bacterial strains. This DOC 117
production was variable, ranging from 6.7% (S. alaskensis, March 2018) to 22.8% (P. 118
angustum, March 2018) of the initial DOC. Bacteria passing through the filters
119
represented less than 1% of cell abundances, and could only contribute to a tiny part of 120
the DOC measured at the end of the cultures. No clear differences between strains could 121
be observed in the %DOC produced (Table 2). However, the two strains produced 122
DOM of different quality. DOM produced by P. angustum was relatively more enriched 123
in protein-like compounds (FDOM Peak T after Coble (1996), 34.3 x10⁻³ R.U. on 124
average) as compared to DOM from S. alaskensis (8.9 x10⁻³ R.U. on average). By 125
contrast, all humic-like FDOM peaks were higher for S. alaskensis, in particular the M 126
nutrients, both strains used preferentially NH4 over NO3, but significant amounts of 128
NH4, PO4 and NO3 remained in the cultures at the end of the incubations 129
(Supplementary Table 1), indicating that carbon was the limiting substrate for the 130
bacterial growth. 131
Availability of bacterial-derived DOM for strain-derived natural heterotrophic 132
prokaryotic communities 133
Biodegradation experiments: Changes in HP abundance, DOC and growth efficiency
134
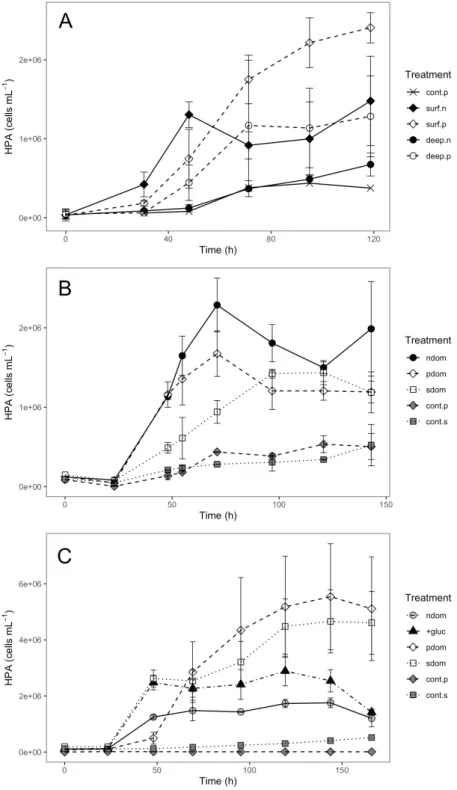
DOM originating from the bacterial strains promoted remarkable HP growth in all 135
biodegradation experiments (Fig. 2), with significant differences over time and between 136
treatments in all three experiments (repeated measures ANOVA, p < 0.05, Suppl. Table 137
2). In the open sea-March biodegradation (Table 1), DOM from P. angustum supported 138
a higher HP growth for surface and deep HP communities than their respective 139
treatments with in situ DOM (Fig. 2a), although only significant for surface 140
communities (Suppl. Table 3). In the coastal sea-April biodegradation experiment, 141
differences in the HP abundances among treatments were only significant at certain 142
timepoints (Fig. 2b, Suppl. Table 3). In the coastal sea-December biodegradation 143
experiment, as in the open sea-March one, the treatments with bacterial DOM promoted 144
significantly higher HP growth than in situ DOM (Fig. 2c, Suppl. Table 3). In the 145
coastal sea-December experiment we included a treatment with glucose (20 µmol C L -146
1), but although HP abundance was higher than that in the surface DOM treatment, it 147
was lower than HP abundances in the S. alaskensis DOM treatment (Suppl. Table 3). 148
We did not find significant differences in HP growth between treatments using P. 149
angustum vs. S. alaskensis DOM (Suppl. Table 3).
We performed controls in the degradation experiments, consisting of DOM from each 151
strain, with N and P additions similar to the treatments, but without inoculating with in 152
situ HP communities. The purpose of these controls was to check for potential growth 153
of the minimal amount of P. angustum and S. alaskensis cells that remained in the 154
filtrates. Little cell growth was observed in these controls (Fig. 2a-c). 155
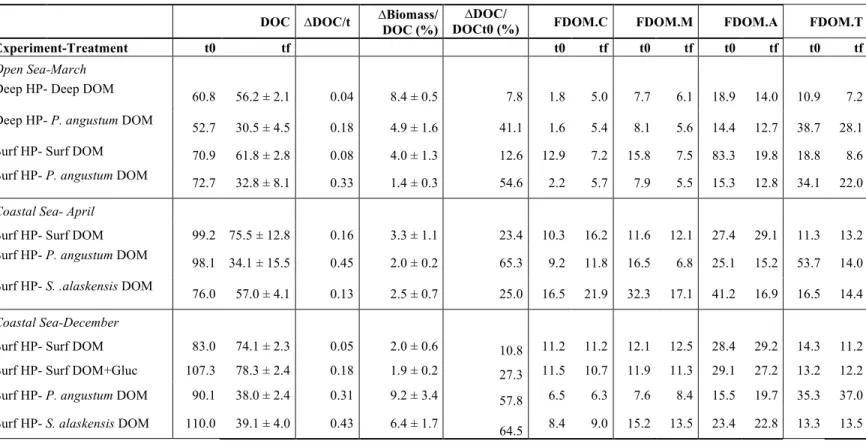
At the onset of the three biodegradation experiments, the DOC concentration was 156
slightly different between treatments (Table 3). However, the amount of DOC 157
consumed per hour (during the total incubation) was consistently higher in the 158
treatments with strain derived DOM, except for coastal sea-April experiment 159
Biodegradation experiment and S. alaskensis DOM (Table 3). Average DOC 160
consumption in the incubations with strain DOM (both P. angustum and S. alaskensis 161
DOM) was 0.30 µmol L-1 h-1, while in the treatments with in situ DOM, either deep or 162
surface, the average was 0.08 µmol L-1 h-1. In the experiments with glucose additions 163
the DOC consumption was on average 0.18 µmol L-1 h-1. When normalizing ∆DOC by 164
the initial DOC concentration in each treatment, these patterns were even more visible: 165
51% on average of the strain-derived DOC was degraded during the incubations, 166
compared to 13.6% of in situ DOC (Table 3). 167
We further wanted to elucidate whether differences in HP growth were due to different 168
initial amounts of DOC or to differences in its lability. For that purpose, we compared 169
HP biomass changes with initial DOC concentrations in every treatment (Table 3). In 170
contrast to total DOC utilization, we could not find consistent patterns in the relative 171
amount of initial DOC incorporated into HP biomass (Table 3). The %DOC invested 172
into prokaryotic biomass was lower (open sea-March), similar (coastal sea-April) or 173
higher (coastal sea-December) than in the in situ DOM (ndom) treatments. Comparing 174
the treatments with P. angustum (pdom) or S. alaskensis (sdom), the changes in HP 175
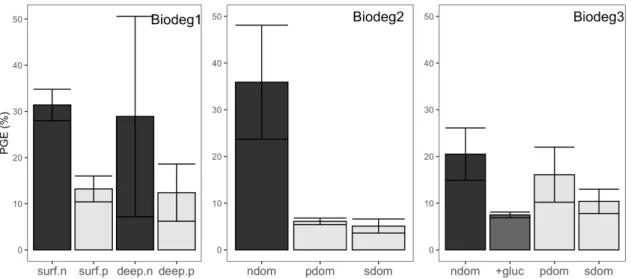
biomass compared to initial DOC were never significantly different. Interestingly, 176
prokaryotic growth efficiency (PGE) was consistently lower in treatments with strain-177
derived DOM than in the treatments with in situ DOM in all biodegradation 178
experiments by a mean factor of 3.5 (range 1.3-7.0) (Fig. 3). 179
Biodegradation experiments: Changes in FDOM and inorganic nutrients
180
The different FDOM peaks did not decrease at the same level in every incubation 181
(Table 3): The peak T (surrogate of protein-like substances) tended to decrease up to a 182
70%, while the FDOM at peak C (surrogate of humic-like compounds) tended to 183
increase in almost every experiment and treatment (Table 3). Humic-like peaks A and 184
M were more variable among experiments and treatments. 185
The inorganic nutrient concentrations, particularly those of NO3-, were also higher in 186
the treatments with bacterial-derived DOM as compared to the in situ DOM, since P. 187
angustum and S. alaskensis did not consume all inorganic nutrients during the previous
188
strain incubations and equivalent amounts of all inorganic nutrients were added to each 189
treatment of the biodegradation experiments. At the end of the incubations, substantial 190
amounts of all inorganic nutrients remained in all treatments (Supplementary Table 1). 191
Coastal biodegradation experiments: Changes in exoenzymatic activity
192
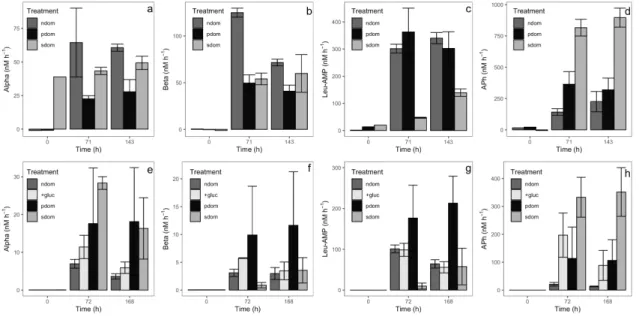
Differences in the predominant exoenzymatic activities could be observed between 193
treatments in Coastal sea-April and December experiments. In May, relatively high 194
alpha- and beta- glucosidase production rates were observed in the treatment with 195
surface DOM (Fig. 4 a,b) compared to the bacterial DOM treatments, but this result was 196
not visible in December (Fig. 4 e,f). Remarkably, in both biodegradation experiments P. 197
angustum DOM induced high rates of leucine aminopeptidase (Fig. 4 c and g), while the
198
S. alaskensis DOM always induced high rates of alkaline phosphatase (Fig. 4 d and h).
Coastal-December Biodegradation experiment: Changes in prokaryotic community
200
composition
201
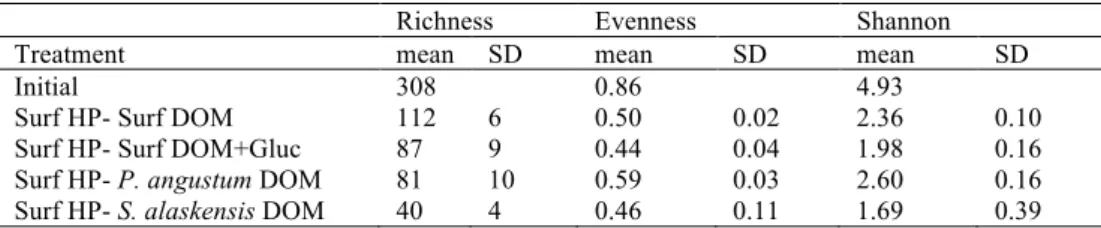
Changes in HP diversity and community composition along the incubations were 202
detected in all treatments and replicates of Coastal sea-December experiment, the only 203
experiment where these samples were taken. A decrease in diversity between the onset 204
and end of the incubations, expressed as richness, evenness or Shannon diversity, was 205
detected in all treatments. Significant differences between treatments were observed at 206
tf (ANOVA, p < 0.001 for all richness, evenness and Shannon). HP communities 207
growing on surface DOM had higher richness, evenness and Shannon than the 208
communities growing on bacterial-derived DOM (Table 4). 209
At the onset of the experiments, the HP community was distributed among different 210
orders, with Alphaproteobacteria (groups of SAR11, Rhodobacterales and 211
Rhodospirilalles), SAR86 (Gammaproteobacteria) and Flavobacteriales as the most 212
abundant groups (Fig. 5). At the end of the incubations, differences between treatments 213
could be detected (ANOSIM test, p < 0.05): The surface DOM treatment was 214
dominated by Alteromonadales, Flavobacteriales and SAR86, the surface DOM 215
+glucose was dominated by Vibrionales and Flavobacteriales (except for replicate 3 216
where Oceanospirilalles were comparatively more abundant), the P. angustum DOM 217
treatments were dominated by Alteromonadales, Rhodobacterales, Flavobacteriales (but 218
replicate 2 showed a potential contamination by Campylobacter) and the S. alaskensis 219
DOM treatment was dominated by Vibrionales, with more than half of the sequences 220
corresponding to this order, but also Rhodospirilalles. A MDS ordination based on Bray 221
Curtis similarities showed separation among treatments with replicates grouping 222
together, illustrating the significant differences (ANOSIM test, p < 0.05) in HP structure 223
(Fig. 5). 224
Discussion 225
Comparison of DOC release rates among studies (strains vs in situ communities) 226
The bacterial DOC release rates reported here (7 to 23% of initial DOC, average 12%) 227
are within those previously published for mixed/natural communities (3.5-22%) but 228
higher than the four published studies using single bacterial strains (3.7% on average, 229
Table 5). All previously published studies using single strains used 5 to 350 times 230
higher initial DOC concentrations than in the present study, and some only quantified 231
the DOM retained by solid-phase cartridges (Romano et al., 2014) or only the DOM 232
released as extracellular polysaccharide (Zhang et al., 2015), making the values lower. 233
The only study measuring DOC production by Archaea through chemoautotrophy also 234
reported DOM release within our ranges when looking at DOM produced vs. biomass 235
produced (Bayer et al., 2019). We could expect that the net DOM production by natural 236
communities would be lower than the ones recorded using single strains, since DOM 237
produced by some HP groups could be consumed by others. However, our DOM 238
production values were within the range of previous studies using mixed communities 239
(i.e., 3.5-22%, Table 5). The DOM production values obtained in our strain incubations 240
could be conservative estimates. On one hand, the method used to quantify glucose 241
(Myklestad et al. 1997) also determines other dissolved monosaccharides. Although it is 242
very unlikely that the strains would have released these compounds without making use 243
of them, their potential presence would lead to an underestimation of the DOM release 244
rates in our experiments. On the other hand, HP release DOM not only as metabolic by-245
products, but also with functional roles such as cell-signaling (Gram et al., 2002) or 246
particle degradation (Smith et al., 1992) among many others, processes that would not 247
be happening in our simple glucose-amended monocultures, so DOM production in situ 248
by HP would likely be higher than the calculated in our study. For instance, substrate 249
quality is likely crucial determining the quantity and quality of DOM produced: Ogawa 250
et. al. (2001) and Wienhausen et. al. (2017) showed higher release of dissolved amino 251
acids by heterotrophic bacterial strains when growing on glutamate than when growing 252
on glucose, even though the amino acid composition was similar among treatments. If 253
grown on complex substrates, their enzymatic degradation would likely enhance the 254
release of DOM by HP (Aparicio et al., 2015). Further work is needed to explore which 255
would be the main nutritional drivers, e.g. going beyond glucose amendments to testing 256
the effect of the DOM source, of DOM production by HP in the sea. 257
Quantity and quality of bacterial DOM 258
Even though the quantity of DOM released by our two study strains was similar, we 259
could evidence clear differences in its fluorescence signature, which suggests different 260
chemical composition. The production of protein-like FDOM observed for P. angustum 261
in the present study, has been previously reported for Alteromonas macleodii when 262
grown on glucose (Goto et al., 2017) and for mixed bacterial communities grown on 263
phytoplankton exudates (Romera-Castillo et al., 2011) or on lake water (Cammack et 264
al., 2004). By contrast, the low protein-like FDOM signature in S. alaskensis DOM 265
illustrates the importance of bacterial taxonomy for bacterial FDOM quality. P. 266
angustum (our study) and A. macleodii (Goto et al., 2017) are both fast-growing
267
copiotrophic bacteria, suggesting a link between aspects of bacterial metabolism and 268
protein-like FDOM release. This is in line with the fact that copiotrophs have a higher 269
number of secreted proteins than oligotrophs (Lauro et al., 2009), thus the quantity and 270
composition of the secreted DOM would be likely dependent on the expression and 271
production of these proteins. The production of humic-like DOM by bacteria has been 272
shown using single strains (Shimotori et al., 2012) and experimental incubations with 273
mixed communities (Rochelle-Newall and Fisher, 2002; Romera-Castillo et al., 2011). 274
Humic-like FDOM (peaks A, C and M) is released to the ambient seawater as a 275
byproduct of organic matter remineralization by HP, and has been used as a tracer for 276
refractory DOM in the ocean (Yamashita and Tanoue, 2008; Catalá et al., 2015). 277
Therefore, we hypothesized that DOM produced by S. alaskensis, more rich in humic-278
like compounds, would be less available for HP degradation in our experiments. 279
Few previous published studies have tested bacterial-DOM degradation by in situ HP 280
communities. Both Kramer and Herndl (2004) and Zhang et al. (2015), these latter 281
authors only using the exopolysaccharide fraction of bacterial DOM, concluded that 282
DOM derived from mixed communities was mostly refractory, since no significant 283
growth was detected during 2 to 14 days. However, Lønborg et al. (2009) followed 284
DOC changes over longer time periods (30 d), and concluded that at least a fraction of 285
derived DOM can be utilized by other prokaryotic communities, indicating that HP-286
DOM is semilabile. This is in accordance with our results, showing that 51% of organic 287
carbon produced by the strains was further used by in situ HP communities (Table 3). 288
Influence of HP community composition for the degradation of bacterial DOM 289
In contrast to our hypothesis, differences in the lability of P. angustum vs. S. alaskensis 290
DOM could not be demonstrated by our biodegradation experiments, as inverse growth 291
patterns on the two strain-derived DOM treatments were observed between coastal 292
communities from April and December (Fig. 2). This suggests that not only the quality 293
of the bacterial DOM, but also the in situ HP community composition would affect 294
bacterial DOM degradation, as previously shown (Nelson and Wear, 2014). Our study 295
strains released DOM that could not be used by themselves, since little bacterial growth 296
of the residual cells was observed even when reinoculating with inorganic nutrients 297
(control treatments in biodegradation experiments, Fig. 2), although this could be due to 298
the possible damage of those cells after freezing. Whether the bacterial DOM can be 299
degraded by single strains, as shown for labile in situ DOM and Alteromonas macleodii 300
(Pedler et al., 2014), or whether the complementary metabolic strategies of a diverse 301
community are required, remains to be investigated. The remarkable growth of in situ 302
HP communities was not only due to the glucose that remained in the pdom and sdom 303
treatments, since HP abundance was in both cases higher than in the +glucose 304
treatment. A possibility that we cannot exclude is that this remaining glucose boosted 305
the utilization of other substrates. Differences in HP growth among experiments can be 306
explained not only by differences in the in situ communities but also by in situ DOM 307
variability: In late spring in the Mediterranean Sea, DOM is usually enriched in labile 308
compounds after the spring phytoplankton bloom (Jones et. al., 2013, Ortega-Retuerta 309
et. al., 2018), so the in situ DOM was likely more labile than bacterial derived DOM, in 310
contrast to December, when DOM can have other signatures (i.e. terrestrial-like, 311
Sanchez-Pérez et. al., 2020). 312
In fact, despite non-significant differences in HP growth, consistent patterns of 313
exoenzyme activity were detected: P. angustum DOM always promoted high leucine-314
aminopeptidase activity rates (Fig. 4), in line with its relative enrichment in protein-like 315
FDOM compounds (Table 2). By contrast, S. alaskensis DOM consistently promoted 316
relatively high levels of alkaline phosphatase (Fig. 4). This last result was intriguing to 317
us, since inorganic phosphorus was added at the beginning of each biodegradation 318
experiments and thus HP communities were not P-limited. Although high alkaline 319
phosphatase activities have been traditionally interpreted as P limitation (Cotner et al., 320
1997; Thingstad et al., 1998), HP can use these exoenzymes to release available 321
dissolved organic carbon, as pointed out by previous studies (Benitez-Nelson and 322
Buesseler, 1999; Van Wambeke et al., 2002). Our results suggest that S. alaskensis 323
DOM could be rich in phosphorus-containing groups. We could see (only in the coastal 324
December experiment) that the S. alaskensis DOM treatment was the one with a higher 325
proportion of Rhodospirilalles. This order has been found in P-limited ocean areas 326
linked to the presence of the carbon-phosphorus lyase pathway for phosphonate 327
degradation (Sosa et al., 2019), in accordance with our hypothesis of P-rich DOM 328
produced by S. alaskensis. 329
Bacterial DOM sustained a lower HP diversity as compared to the in situ DOM (Table 330
4). In line with this, Noriega-Ortega et al. (2019) compared the solid- phase extractable 331
DOM produced by single bacterial strains with that of marine DOM from the North 332
Pacific and observed higher diversity of compounds in marine DOM respect to 333
bacterial-derived DOM. HP strains were shown to produce thousands of DOM 334
molecules when using a single carbon substrate, however, the DOM chemical diversity 335
produced by a single bacterium with respect to DOM from coastal seawater is likely to 336
be lower. In any case, the significant differences in community composition between 337
treatments suggest population-specific responses to the differences in quality of the 338
DOM produced by P. angustum and S. alaskensis. 339
Bacterial DOM, PGE and carbon fluxes 340
The growth on strain-derived DOM induced significantly lower prokaryotic growth 341
efficiency (PGE). To the best of our knowledge, our study provides the first 342
measurements of PGE on bacterial-derived DOM, demonstrating that bacterial DOM is 343
preferentially respired. HP do not only promote DOC accumulation in the ocean 344
through the production of refractory DOM (the microbial carbon pump hypothesis 345
shown in previous studies), but would also enhance carbon remineralization (therefore, 346
acting as a CO2 source). Noteworthy, we did not include DOM production by natural 347
HP communities in our PGE calculations in the biodegradation experiments, and 348
including DOM production in our calculations would lead to even lower PGE values in 349
all treatments. 350
Changing the paradigm of carbon fluxes through HP in the ocean 351
DOM release by HP has been repeatedly demonstrated, however, carbon (and other 352
elements) release by HP as DOM is still overlooked when constraining carbon budgets 353
or other elemental fluxes and models in the ocean. For instance, considering that HP 354
produce, on average, 10% of DOC as DOM (average from values in Table 5), in situ HP 355
production estimates (e.g. using isotopes incorporation such as 3H-leucine, (Kirchman et 356
al., 1985) would be underestimated. To better constrain this uncertainty, it is important 357
to know whether DOM release is linearly related to HP biomass production during short 358
incubation times. The release of DOM would also affect estimates of HP growth 359
efficiency. Prokaryotic carbon demand can be calculated as the sum of HP biomass 360
production and respiration or as differences in DOC concentrations in bottle incubations 361
(the dilution approach (delGiorgio and Cole, 1998)), but in both cases PGE would be 362
overestimated by roughly 10%, according to published results. The overestimation 363
could even be higher if, as demonstrated in our study, this 10% of DOM produced by 364
HP would enhance respiration over biomass production. More studies are needed to 365
better understand the dynamics of DOM production by HP and their drivers, and 366
therefore to constrain carbon fluxes through HP. 367
368
Conclusion and perspectives 369
In this study, we demonstrate that two marine heterotrophic bacterial strains growing on 370
glucose release remarkable amounts of DOM (compared with biomass production), and 371
that an important fraction of this bacterial derived DOM is available for Mediterranean 372
by prokaryotes in the sea would change carbon fluxes through HP towards a decrease in 374
prokaryotic growth efficiency, as well as shaping HP community and exoenzyme 375
activities. While in the present study DOM release is measured in single strains growing 376
on glucose, the uptake of other organic compounds will likely affect the quantity and 377
lability of the released DOM, hence affecting further metabolisms in the ocean. Further 378
work is needed to better constrain the main mechanisms affecting HP DOM production 379
and degradation in the ocean, thus improving our knowledge on carbon sequestration 380
processes such as the microbial carbon pump. 381
Experimental procedures 382
Bacterial strains growth 383
In order to get dissolved organic matter (DOM) produced by marine bacteria, we grew 384
axenically two strains with contrasting ecology and different taxonomical classes: The 385
first one, Photobacterium angustum S14, is a Gammaproteobacterium (Vibrionales, 386
Vibrionaceae) which was isolated from coastal waters (Humphrey et al., 1983). The 387
second strain, Sphingopyxis alaskensis RB2256 (Sphingomonoadales,
388
Sphingomonadaceae), is an Alphaproteobacterium isolated from open waters in the 389
North Pacific Ocean (Eguchi et al., 2001). These bacterial strains can be considered as 390
models of copiotrophic (P. angustum) and oligotrophic (S. alaskensis) life styles (Lauro 391
et al., 2009). The strains were selected based on their capacity to grow on glucose and 392
the laboratory’s experience in culturing them (Matallana-Surget et al., 2009; Koedooder 393
et al., 2018). Both strains were preserved in glycerol at -80ºC. The stocks were thawed 394
and grown in minimum media, modified from Fegatella et al. (1998), composed of 395
artificial seawater (salinity 35) with glucose as the sole carbon source (≈200 µM C), 396
nitrogen (50:50 mixture of NH4Cl and NO3) and phosphorus (NaHPO4) at a C:N:P ratio 397
of 45:9:1, equivalent to the internal stoichiometry of bacterial cells (Goldman et al., 398
1987), and trace amounts of metals and vitamins. In order to minimize the presence of 399
glycerol in the media and get the cells adapted to the growth conditions, two 400
acclimation steps were made, where cells were diluted on fresh media (initial 401
concentration ≈104 cell mL-1) and grown to 1-2 x10⁶ cell mL-1. Purity of the cultures 402
was controlled at each step by plating samples on Marine Agar. Experimental 403
incubations were set up in triplicate in 500 mL flasks, with two contamination controls, 404
consisting of flasks containing culture media but without bacterial inoculation. 405
Incubations were performed at 25ºC with rotary agitation (90 rpm) until the stationary 406
phase was reached (controlled several times per day by flow cytometry). No bacterial 407
growth was detected in the contamination controls. Once the stationary phased was 408
reached, the DOM was harvested by gentle filtration through pre-rinsed (Milli-Q water, 409
250 mL) 0.2 µm polycarbonate filters using an all-glass filtration system. All glass 410
material used for the incubations and filtrations was previously combusted (450ºC, 5h). 411
Previous tests (dissolved organic carbon concentration and DOM fluorescence 412
measurements on Milli-Q water filtered using the same device and filters) showed 413
insignificant DOM leaching from the polycarbonate filters (data not shown). In the 414
DOM filtrates, samples for glucose, dissolved organic carbon (DOC), inorganic 415
nutrients, DOM fluorescence and flow cytometry (to check for the presence of cells 416
passing through the filters) were taken, and the remaining DOM was kept at -20ºC 417
before being used as substrates for biodegradation experiments (see below). We chose 418
to sample in the early stationary phase to ensure that minimal amounts of glucose were 419
remaining in the DOM extracts for the biodegradation experiments, although at this 420
stage some of the bacterial DOM could derive from cell lysis. Strain cultures p1 and s1 421
(Fig. 1) were used for the biodegradation experiments 1 and 2, while strain cultures p2 422
and s2 were used for biodegradation experiment 3. Being aware that freezing could alter 423
some DOM properties, we chose this preservation method due to the inability to 424
perform the biodegradation experiments shortly after the strain incubations were 425
finished. 426
Biodegradation experiments 427
To study how DOM derived from the bacterial strains is degraded by natural marine 428
heterotrophic prokaryotic (HP) communities, re-growth cultures were performed (Table 429
1). These consisted of 10% dilutions of natural HP communities from different NW 430
Mediterranean Sea locations (water prefiltered by 0.8 µm to remove most 431
phytoplankton and grazers) with 90% DOM (0.2 µm filtrates) from the following 432
sources: DOM sampled from the same waters as the HP communities (in situ surface or 433
deep DOM, ndom treatments) or DOM harvested from the strain cultures explained 434
above: Photobacterium angustum (P. angustum DOM treatments, pdom) or 435
Sphingopyxis alaskensis (S. alaskensis DOM treatments, sdom). DOM for ndom
436
treatments was prepared by filtering seawater from the same location as the prokaryotic 437
innocula through 0.2 µm filters as for the bacterial DOM. Inorganic nutrients (nitrogen 438
(50:50 mixture of NH4Cl and NO3) and phosphorus (NaHPO4), final concentrations in 439
supplementary Table 1) were added to each treatment to force carbon limitation, and all 440
treatments were set up in triplicate in 250 mL flasks. Incubations were performed at 441
18ºC in the dark for 7-8 days. 442
Using this approach, we performed three different experiments: Open sea-March 443
experiment: We selected waters from a station located on the edge of the continental 444
shelf (hereafter termed as “open sea”) in the North Western Mediterranean Sea 445
(42°27‘205 N – 03°32’565 E, 600m depth) at two different depths: 5m (surface 446
communities) and 500m (deep communities), in March 2018. These natural HP 447
communities were grown on in situ DOM (surface or deep DOM) or on P. angustum 448
DOM, with the purpose to evaluate the differences in HP growth depending on the 449
initial community (surface vs. deep marine communities). For this experiment, samples 450
for DOC, FDOM and nutrients were taken at the onset and end of the incubations, while 451
HP abundance was monitored daily by flow cytometry. For the Coastal sea-April 452
experiment, we collected surface waters from a coastal station (42º29’3N, 3º8’7E, 20m 453
bottom depth) in April 2018 and grew HP communities on in situ DOM, DOM 454
produced by P. angustum, and DOM produced by S. alaskensis, to evaluate growth of 455
the same HP community on different DOM sources. In this experiment, we monitored 456
the same variables as in Open sea-April experiment and, in addition, we measured the 457
exoenzyme activity at the onset, day 3, and end of the experiment. For the Coastal sea-458
December experiment, we collected surface waters from the same coastal station as for 459
biodegradation Experiment 2 (42º29’3N, 3º8’7E, 20m depth), but in December 2018. 460
The treatments were the same as in May 2018 and thus allowed us to investigate 461
seasonal differences. We included an additional “+Gluc” treatment to evaluate the effect 462
of residual glucose amounts in the bacterial DOM sources. In this last experiment, we 463
monitored the same variables as in biodegradation experiment 2 (DOM, nutrients, HP 464
abundance and exoenzyme activities) and, additionally, we measured the HP 465
community structure (16s rRNA Illumina sequencing) at the onset and end of the 466
experiment. 467
Chemical and biological analyses 468
Dissolved organic carbon (DOC)
469
Samples (10 mL) for DOC were transferred into precombusted glass tubes, acidified 470
with 85% H3PO4 (final pH 2), closed with Teflon lined screw caps and stored in the 471
dark at room temperature until analysis (less than 2 months after sampling). Calibration 472
curves were made using an acetanilide solution (C8H9NO; M= 135.17 g mol-1). DOC 473
was analysed using the high temperature catalytic oxidation (HTCO) technique (Benner 474
and Strom, 1993) with a Shimadzu TOC-V-CSH analyser. Standards of 44–45 µmol C 475
L-1, provided by D.A. Hansell and Wenhao Chen (Univ. of Miami), were used to assess 476
the accuracy of the measurements. 477
Glucose
478
Glucose was quantified using a modification of the colorimetric protocol described by 479
Myklestad et al. (1997). Samples (200 µL) were stored in precombusted glass vials at -480
20°C until analysis. All reagents were downscaled to 200 µL samples, and incubations 481
after reagent A additions were performed during 20 min in a 100ºC water bath. The 482
reagents were calibrated daily using a standard curve made of D-glucose in the same 483
batch of artificial seawater used for the strain incubations. Milli-Q water and artificial 484
sea water blanks were run daily in triplicate. Glucose concentrations in µmol were 485
converted in carbon equivalent (C-Glucose). 486
Fluorescent dissolved organic matter (FDOM)
487
FDOM samples were freshly (within 1-3 h) analyzed with a Perkin Elmer luminescence 488
spectrometer LS 55 equipped with a xenon discharge lamp, equivalent to 20 kW. Slit 489
widths were 10.0 nm for the wavelengths of excitation and emission. We characterized 490
4 groups of fluorophores using the following excitation/emission (ex/em) pairs (Coble, 491
1996): 280 nm/350 nm (peak T, surrogate of protein-like substances); 250 nm/435 nm 492
(peak A); 340 nm/440 nm (peak C) and 320 nm/410 nm (peak M) the later three due to 493
humic substances of different origins (Coble, 1996). Fluorescence intensities of the 494
peaks were reported in Raman units (R.U.) obtained by dividing the fluorescence units 495
by the Milli-Q blank peak area (Raman scatter) excited at 350 nm. 496
Dissolved inorganic nutrients
497
Samples for inorganic nutrient analyses were kept frozen at -20°C. NO3+NO2, and PO4 498
were quantified with a segmented flow analyser (Bran Luebbe) with colorimetric 499
detection using methods described in Holmes (1999). The accuracy of the methods was 500
assessed using reference material (Certipur, Merck). The precisions were in the range of 501
1–4%, and the detection limits were 0.02 µM for NO3+NO2, and 0.03 µM for PO4. NH4 502
samples were collected into pre-rinsed 20 mL HDPE bottles and stored frozen at -20ºC 503
before being analysed by fluorometric detection (Holmes, 1999). 504
Bacterial and heterotrophic prokaryotic abundance
505
Cell abundances in all experiments were monitored by flow cytometry. Subsamples 506
were fixed with glutaraldehyde (0.5% final concentration) and preserved at -80ºC prior 507
to analysis (within days). Cell abundance was measured by using Beckman CytoFLEX 508
and BD FACSCanto flow cytometers equipped with lasers exciting at 488 nm. Samples 509
were thawed and stained with SYBR Green (0.025% (v/v) final concentration). 510
Fluorescent beads (1 µm) were added as internal standards. Samples were run at low 511
speed (10 to 16 µL min-1) for 60 to 90 seconds. Prokaryote communities were identified 512
in plots of side scattered light vs. green fluorescence (del Giorgio et al., 1996). 513
Extracellular enzyme activities
514
Extracellular enzyme activities were quantified with the use of fluorogenic substrates 515
(Hoppe, 1983) with the modifications for plate readers described in Sala et al. (2016). 516
Each sample was pipetted in triplicate into 96-well black plates with the following 517
substrates: methylumbelliferyl ß-D-glucopyranoside (for ß-glucosidase), 4-518
methylumbelliferyl α-D-glucopyranoside (for α-glucosidase), 4-methylumbelliferyl 519
phosphate (for alkaline phosphatase), and L-leucine-7-amido-4-methyl coumarin (for 520
leu-aminopeptidase) added (final concentration 120 µmol L-1). Fluorescence was 521
measured immediately after addition of the substrate and after incubations (up to 5h 522
with one middle timepoint) in the dark at the same temperature as for the experimental 523
incubations. Fluorescence readings were done with a Victor3 Perkin Elmer 524
spectrofluorometer at 355/450 nm ex/em wavelengths. The increase of fluorescence 525
units during the period of incubation was converted into enzymatic activity with a 526
standard curve prepared with the end products of the reactions, 7-amido-4-527
methylcoumarin (MCA) for leu-aminopeptidase and 4-methylumbelliferone (MUF) for 528
the rest of enzymes. 529
DNA extraction and sequencing
530
Samples (110 mL) for bacterial diversity were filtered onto 0.2 µm pore size 531
polycarbonate filters. The 0.2 µm filters were stored at −80 °C until analysis. For 532
analysis, frozen filters were cut with sterilized scissors into small strips and vortexed 533
briefly in 750 µL of lysis buffer (50 mmol L−1 Tris hydrochloride pH 8.3, 40 mmol L−1 534
EDTA and 0.75 mol L−1 sucrose) and then subjected to three freeze-thaw cycles 535
(immersed successively into liquid nitrogen and hot water). Cell lysis was accomplished 536
by an initial incubation for 45 min at 37 °C after adding 41 µL of freshly prepared 537
lysozyme solution (36 mg mL-1), and a second incubation at 55 °C for 1 h after adding 538
80 µL of 10% sodium dodecyl sulfate and 8 µL of proteinase K (20 mg mL-1). After 539
denaturation and degradation of proteins, DNA was purified using a Quick-DNATM 540
fungal/bacteria miniprep kit (Zymo Research, Catalog No. D6005) according to the 541
manufacturer’s instructions. 542
The V4-V5 region of the 16S rRNA gene from both fractions was amplified with the 543
primer sets 515F-Y GTGYCAGCMGCCGCGGTAA) and 926-R (5’-544
CCGYCAATTYMTTTRAGTTT) as described in Parada et al. (2016) with a 545
modification to the PCR amplification step. Triplicate 20µL reaction mixtures contained 546
2 µg DNA, 5 µl KAPA2G Fast HotStart ReadyMix, 0.2 µM forward primer and 0.2 µM 547
reverse primer. Cycling reaction started with a 3 min heating step at 95˚C followed by 548
30 cycles of 95˚C for 45 s, 50˚C for 45 s, 68˚C for 90 s, and a final extension of 68˚C 549
for 5 min. The presence of amplification products was confirmed by 1% agarose 550
electrophoresis and triplicate reactions were pooled. The pooled PCR amplicons were 551
purified using Sephadex G-50 Superfine resin (GE Healthcare Bio-Sciences, New 552
Jersey, USA) following the protocol. The purification step aims to desalt the samples 553
and eliminate unincorporated nucleotides and excess PCR primers. 16S rRNA gene 554
amplicons were sequenced with Illumina MiSeq 2 × 250 bp chemistry on one flow-cell 555
at GeT-PlaGe platform (Toulouse, France). A mock community DNA (LGC standards, 556
UK) was used as a standard for subsequent analyses and considered as a DNA sample 557
for all treatments. 558
All samples from the sequencing run were demultiplexed by GeT-PlaGe and barcodes 559
were trimmed off. Processing of sequences was performed using the DADA2 pipeline 560
(version 1.10) (Callahan et al., 2016) in R (version 3.4.2) with following parameters: 561
trimLeft=c(19, 20), truncLen=c(240, 200), maxN=0, maxEE=c(2, 2), truncQ=2. Briefly, 562
the pipeline combines the following steps: filtering and trimming, dereplication, sample 563
inference, chimera identification, and merging of paired-end reads. It provides exact 564
amplicon sequence variants (ASVs) from sequencing data with one nucleotide 565
difference instead of building operational taxonomic units (OTUs) based on sequence 566
similarity. ASVs were assigned against SILVA release 132 database (Quast et al., 567
2013). Singletons and sequences assigned to chloroplast and mitochondria were 568
removed prior to subsequent analyses. Sequences were submitted to NCBI under the 569
accession number PRJNA630555 570
571
Data analyses 572
In the strain incubations, we calculated the % of initial DOC transformed to bacterial-573
derived DOM (%DOC) as the difference between final carbon as glucose (C-Glucose) 574
and dissolved organic carbon (DOC) along the incubations as follows: 575
%DOC = '()*+ ,-./ 0-2 - )34/56.78*+ ,-./ 0-2
'()*9,-./ 0-2
1 (1)
576
This equation would be applicable only if at t0, DOC and glucose values were equal. 577
However, there were slight differences between these two pools at t0 in the S. 578
alaskensis cultures s1 and s2 (Fig. 1). Because glucose was the sole organic carbon
579
source added to the cultures (final concentration of 200 µM C-glucose), the difference is 580
likely due to the introduction of DOC contamination while manipulating the cultures, or 581
due to analytical differences between the glucose and DOC analyses. 582
Thus, we decided to consider this initial DOC excess (DOC(t0)-C-glucose(t0)) as a non-583
reactive pool and subtract it from the concentrations at the beginning and end of each 584
incubation. This is the most conservative way to calculate the %DOC released as DOM 585
by the strains, since, alternatively, the strains could have taken up some of this extra 586
DOC and then released a fraction of it back as bacterial DOM. 587
Prokaryotic growth efficiency (PGE) in the biodegradation experiments was calculated 588
as the increase in cell biomass between t0 and tf divided by the decrease in DOC 589
between t0 and tf in the incubations using this formula: 590
PGE (%) = ∆*+,-.// (0-,1 2-4) ∆567 (0-,1 2-4)
1 x100 (2)
591
using a general cell to biomass conversion factor of 20 fg cell-1 (Watson et al., 1977 ). 592
Differences in HP abundance between treatments in the biodegradation experiments 593
were tested using repeated measures ANOVA and post-hoc pairwise t-tests (package 594
“rstatix” in R). Differences in prokaryotic community structure were tested by 595
ANOSIM tests (package “vegan” in R). 596
Acknowledgements 597
This work was supported by the Caramba project (European commission, H2020-598
MSCA-IF-2015-703991). Flow cytometric analyses were performed at the BioPic 599
cytometry and imaging platform (Sorbonne University/CNRS). DNA extractions and 600
PCR amplifications were conducted at the Bio2Mar platform (Sorbonne 601
University/CNRS). Dr. Yan Liu kindly provided assistance in PCR and DNA cleaning 602
steps as well as in sequence processing. The 16s samples were sequenced in the INRAE 603
platform. We thank the crew of R/V ‘Nereis II’ and the technicians of the Banyuls 604
observation service for their assistance in getting Mediterranean Sea samples for the 605
biodegradation experiments. 606
References 607
Andrews, S.C., Robinson, A.K., and Rodríguez-Quiñones, F. (2003) Bacterial iron 608
homeostasis. FEMS Microbiology Reviews 27: 215-237. 609
Aparicio, F.L., Nieto-Cid, M., Borrull, E., Romero, E., Stedmon, C.A., Sala, M.M. et al. 610
(2015) Microbially-mediated fluorescent organic matter transformations in the deep 611
ocean. Do the chemical precursors matter? Frontiers in Marine Science 2. 612
Azam, F., Fenchel, T., Field, J.G., Gray, J.S., Meyerreil, L.A., and Thingstad, F. (1983) 613
The ecological role of water-column microbes in the sea. Marine Ecology-Progress 614
Series 10: 257-263.
615
Bayer, B., Hansman, R.L., Bittner, M.J., Noriega-Ortega, B.E., Niggemann, J., Dittmar, 616
T., and Herndl, G.J. (2019) Ammonia-oxidizing archaea release a suite of organic 617
compounds potentially fueling prokaryotic heterotrophy in the ocean. Environ 618
Microbiol 21: 4062-4075.
619
Benitez-Nelson, C., and Buesseler, K.O. (1999) Variability of inorganic and organic 620
phosphorus turnover rates in the coastal ocean. Nature 398: 502-505. 621
Benner, R., and Strom, M. (1993) A critical evaluation of the analytical blank 622
associated with DOC measurements by high-temperature catalytic oxidation. Marine 623
Chemistry 41: 153-160.
624
Callahan, B.J., McMurdie, P.J., Rosen, M.J., Han, A.W., Johnson, A.J., and Holmes, 625
S.P. (2016) DADA2: High-resolution sample inference from Illumina amplicon data. 626
Nat Methods 13: 581-583.
627
Cammack, W.K.L., Kalff, J., Prairie, Y., and Smith, E.M. (2004) Fluorescent dissolved 628
organic matter in lakes: Relationships with heterotrophicmetabolism. Limnol Oceanogr 629
49: 2034-2045. 630
Carlson, C.A., Giorgio, P.A.d., and Herndl, G.J. (2007) Microbes and the Dissipation of 631
Energy and Respiration: From Cells to Ecosystems. Oceanography 20: 89-100. 632
Catalá, T.S., Reche, I., Fuentes-Lema, A., Romera-Castillo, C., Nieto-Cid, M., Ortega-633
Retuerta, E. et al. (2015) Turnover time of fluorescent dissolved organic matter in the 634
dark global ocean. Nat Commun 6: 5986. 635
Christie-Oleza, J.A., Pina-Villalonga, J.M., Bosch, R., Nogales, B., and Armengaud, J. 636
(2012) Comparative proteogenomics of twelve Roseobacter exoproteomes reveals 637
different adaptive strategies among these marine bacteria. Mol Cell Proteomics 11: 638
M111 013110. 639
Coble, P.G. (1996) Characterization of marine and terrestrial DOM in seawater using 640
excitation-emission matrix spectroscopy. Marine Chemistry 51: 325-346. 641
Cotner, J.B., Ammerman, J.W., Peele, E.R., and Bentzen, E. (1997) Phosphorus-limited 642
bacterioplankton growth in the Sarcrasso Sea. Aquat Microb Ecol 13: 141-149. 643
del Giorgio, P.A., Bird, D.F., Prairie, Y.T., and Planas, D. (1996) Flow Cytometric 644
Determination of Bacterial Abundance in Lake Plankton with the Green Nucleic Acid 645
Stain SYTO 13. Limnology and Oceanography 41: 783-789. 646
delGiorgio, P., and Cole, J.J. (1998) Bacterial growth efficiency in natural aquatic 647
ecosystems. Annu Rev Ecol Syst 29: 503-541. 648
Eguchi, M., Ostrowski, M., Fegatella, F., Bowman, J., Nichols, D., Nishino, T., and 649
Cavicchioli, R. (2001) Sphingomonas alaskensis, Strain AF01: an abundant oligotrophic 650
ultramicrobacterium from the North Pacific. Appl Environ Microbiol 67. 651
Fegatella, F., Lim, J., Kjelleberg, S., and Cavicchioli, R. (1998) Implications of rRNA 652
Operon Copy Number and Ribosome Content in the Marine Oligotrophic 653
Ultramicrobacterium Sphingomonas sp. Strain RB2256. Appl Environ Microbiol 64: 654
4433-4438. 655
Goldman, J.C., Caron, D.A., and Dennett, M.R. (1987) Regulation of gross growth 656
efficiency and ammonium regeneration in bacteria by substrate c-n ratio. Limnology and 657
Oceanography 32: 1239-1252.
658
Goto, S., Tada, Y., Suzuki, K., and Yamashita, Y. (2017) Production and Reutilization 659
of Fluorescent Dissolved Organic Matter by a Marine Bacterial Strain, Alteromonas 660
macleodii. Front Microbiol 8: 507. 661
Gram, L., Grossart, H.P., Schlingloff, A., and Kiorboe, T. (2002) Possible quorum 662
sensing in marine snow bacteria: production of acylated homoserine lactones by 663
Roseobacter strains isolated from marine snow. Appl Environ Microbiol 68: 4111-4116. 664
Holmes, R.M., Aminot, A., Kérouel, R., Hooker, B. A., and Peterson, B. J. (1999) A 665
simple and precise method for measuring ammo- nium in marine and freshwater 666
ecosystems. Can J Fish Aquat Sci 56: 1801–1808. 667
Hoppe, H.G. (1983) Signiticance of exoenzymatic activities in the ecology of brackish 668
water: measurements by means of methylumbelliferyl substrates. Mar Ecol Progr Ser 669
11: 299-308. 670
Humphrey, B., Kjelleberg, S., and Marshall, K.C. (1983) Responses of marine bacteria 671
under starvation conditions at a solid-water interface. Appl Environ Microbiol 45:43– 672
47. 673
Jiao, N., Herndl, G.J., Hansell, D.A., Benner, R., Kattner, G., Wilhelm, S.W. et al. 674
(2010) Microbial production of recalcitrant dissolved organic matter: long-term carbon 675
storage in the global ocean. Nature Reviews Microbiology 8: 593-599. 676
Kawasaki, N., and Benner, R. (2006) Bacterial release of dissolved organic matter 677
during cell growth and decline: Molecular origin and composition. Limnol Oceanogr 678
51: 2170-2180. 679
Kirchman, D., Knees, E., and Hodson, R. (1985) Leucine incorporation and its potential 680
as a measure of protein-synthesis by bacteria in natural aquatic systems. Applied and 681
Environmental Microbiology 49: 599-607.
682
Koedooder, C., Guéneuguès, A., Van Geersdaële, R., Vergé, V., Bouget, F.-Y., 683
Labreuche, Y. et al. (2018) The Role of the Glyoxylate Shunt in the Acclimation to Iron 684
Limitation in Marine Heterotrophic Bacteria. Frontiers in Marine Science 5. 685
Kramer, G.D., and Herndl, G.J. (2004) Photo- and bioreactivity of chromophoric 686
dissolved organic matter produced by marine bacterioplankton. Aquat Microb Ecol 36: 687
239-246. 688
Jones, V., Meador, T.B., Gogou, A., Migon, C., Penkman, K.E.H., Collins, M.J., and 689
Repeta, D.J. (2013) Characterisation and dynamics of dissolved organic matter in the 690
Northwestern Mediterranean Sea. Progress in Oceanography 119: 78-89. 691
Lauro, F.M., McDougald, D., Thomas, T., Williams, T.J., Egan, S., Rice, S. et al. 692
(2009) The genomic basis of trophic strategy in marine bacteria. Proc Natl Acad Sci 693
USA 106.
694
Lechtenfeld, O.J., Hertkorn, N., Shen, Y., Witt, M., and Benner, R. (2015) Marine 695
sequestration of carbon in bacterial metabolites. Nat Commun 6. 696
Legendre, L., Rivkin, R.B., Weinbauer, M.G., Guidi, L., and Uitz, J. (2015) The 697
microbial carbon pump concept: Potential biogeochemical significance in the globally 698
changing ocean. Progress in Oceanography 134: 432-450. 699
Lønborg, C., Álvarez-Salgado, X.A., Davidson, K., and Miller, A.E.J. (2009) 700
Production of bioavailable and refractory dissolved organic matter by coastal 701
heterotrophic microbial populations. Estuarine, Coastal and Shelf Science 82: 682-688. 702
Matallana-Surget, S., Douki, T., Cavicchioli, R., and Joux, F. (2009) Remarkable 703
resistance to UVB of the marine bacterium Photobacterium angsutum explained by an 704
unexpected role of photolyase. Photochem Photobiol Sci 8: 1313-1320. 705
Myklestad, S.M., Skanoy, E., and Hestmann, S. (1997) A sensitive and rapid method for 706
analysis of dissolved mono- and polysaccharides in seawater. Marine Chemistry 56: 707
279-286. 708
Nelson, C.E., and Wear, E.K. (2014) Microbial diversity and the lability of dissolved 709
organic carbon. Proc Natl Acad Sci U S A 111: 7166-7167. 710
Noriega-Ortega, B.E., Wienhausen, G., Mentges, A., Dittmar, T., Simon, M., and 711
Niggemann, J. (2019) Does the Chemodiversity of Bacterial Exometabolomes Sustain 712
the Chemodiversity of Marine Dissolved Organic Matter? Front Microbiol 10: 215. 713
Ogawa, H., Amagai, Y., Koike, I., Kaiser, K., and Benner, R. (2001) Production of 714
Refractory Dissolved Organic Matter by Bacteria. Science 292: 917-920. 715
Ortega-Retuerta, E., Marrasé, C., Muñoz-Fernández, A., Sala, M.M., Simó, R., and 716
Gasol, J.M. (2018) Seasonal dynamics of transparent exopolymer particles (TEP) and 717
their drivers in the coastal NW Mediterranean Sea. Science of the Total Environment 718
631: 180-190. 719
Osterholz, H., Niggemann, J., Giebel, H.A., Simon, M., and Dittmar, T. (2015) 720
Inefficient microbial production of refractory dissolved organic matter in the ocean. Nat 721
Commun 6: 7422.
722
Parada, A.E., Needham, D.M., and Fuhrman, J.A. (2016) Every base matters: assessing 723
small subunit rRNA primers for marine microbiomes with mock communities, time 724
series and global field samples. Environ Microbiol 18: 1403-1414. 725
Pedler, B.E., Aluwihare, L.I., and Azam, F. (2014) Single bacterial strain capable of 726
significant contribution to carbon cycling in the surface ocean. Proc Natl Acad Sci U S 727
A 111: 7202-7207.
728
Quast, C., Pruesse, E., Yilmaz, P., Gerken, J., Schweer, T., Yarza, P. et al. (2013) The 729
SILVA ribosomal RNA gene database project: improved data processing and web-730
based tools. Nucleic Acids Res 41: D590-596. 731
Rochelle-Newall, E., and Fisher, T.R. (2002) Production of chromophoric dissolved 732
organic matter fluorescence in marine and estuarine environments: an investigation into 733
the role of phytoplankton. Marine Chemistry 77: 7-21. 734
Romano, S., Dittmar, T., Bondarev, V., Weber, R.J., Viant, M.R., and Schulz-Vogt, 735
H.N. (2014) Exo-metabolome of Pseudovibrio sp. FO-BEG1 analyzed by ultra-high 736
resolution mass spectrometry and the effect of phosphate limitation. PLoS One 9: 737
e96038. 738
Romera-Castillo, C., Sarmento, H., Alvarez-Salgado, X.A., Gasol, J.M., and Marrase, 739
C. (2011) Net production and consumption of fluorescent colored dissolved organic 740
matter by natural bacterial assemblages growing on marine phytoplankton exudates. 741
Appl Environ Microbiol 77: 7490-7498.
742
Sala, M.M., Aparicio, F.L., Balagué, V., Boras, J.A., Borrull, E., Cardelús, C. et al. 743
(2016) Contrasting effects of ocean acidification on the microbial food web under 744
different trophic conditions. ICES Journal of Marine Science: Journal du Conseil 73: 745
670-679. 746
Sánchez-Pérez, E.D., Pujo-Pay, M., Ortega-Retuerta, E., Conan, P., Peters, F., and 747
Marrasé, C. (2020) Mismatched dynamics of dissolved organic carbon and 748
chromophoric dissolved organic matter in the coastal NW Mediterranean Sea. Science 749
of The Total Environment 746: 141190.
750
Shimotori, K., Watanabe, K., and Hama, T. (2012) Fluorescence characteristics of 751
humic-like fluorescent dissolved organic matter produced by various taxa of marine 752
bacteria. Aquatic Microbial Ecology 65: 249-260. 753
Smith, D.C., Simon, M., Alldredge, A.L., and Azam, F. (1992) Intense hydrolytic 754
enzyme-activity on marine aggregates and implications for rapid particle dissolution 755
Nature 359: 139-142.
756
Sosa, O.A., Repeta, D.J., DeLong, E.F., Ashkezari, M.D., and Karl, D.M. (2019) 757
Phosphate-limited ocean regions select for bacterial populations enriched in the carbon-758
phosphorus lyase pathway for phosphonate degradation. Environ Microbiol 21: 2402-759
2414. 760
Stoderegger, K., and Herndl, G.J. (1998) Production and release of bacterial capsular 761
material and its subsequent utilization by marine bacterioplankton. Limnol Oceanogr 762
43: 877-884. 763
Teeling, H., Fuchs, B.M., Becher, D., Klockow, C., Gardebrecht, A., Bennke, C.M. et 764
al. (2012) Substrate-Controlled Succession of Marine Bacterioplankton Populations 765
Induced by a Phytoplankton Bloom. Science 336: 608-611. 766
Thingstad, T.F., Zweifel, U.L., and Rassoulzadegan, F. (1998) P limitation of 767
heterotrophic bacteria and phytoplankton in the northwest Mediterranean. Limnol 768
Oceanogr 43: 88-94.
769
Van Wambeke, F., Christaki, U., Giannakourou, A., Moutin, T., and Souvemerzoglou, 770
K. (2002) Longitudinal and vertical trends of bacterial limitation by phosphorus and 771
carbon in the Mediterranean Sea. Microbial Ecology 43: 119-133. 772
Watson, S.W., Novitsky, T.J., Quinby, H.L., and Valois, F.W. (1977 ) Determination of 773
bacterial number and biomass in the marine environment. Appl Envir Microb 33: 940-774
946. 775
Yamashita, Y., and Tanoue, E. (2008) Production of bio-refractory fluorescent 776
dissolved organic matter in the ocean interior. Nature Geoscience 1: 579-582. 777
Zhang, Z., Chen, Y., Wang, R., Cai, R., Fu, Y., and Jiao, N. (2015) The Fate of Marine 778
Bacterial Exopolysaccharide in Natural Marine Microbial Communities. PLoS One 10: 779
e0142690. 780
781 782
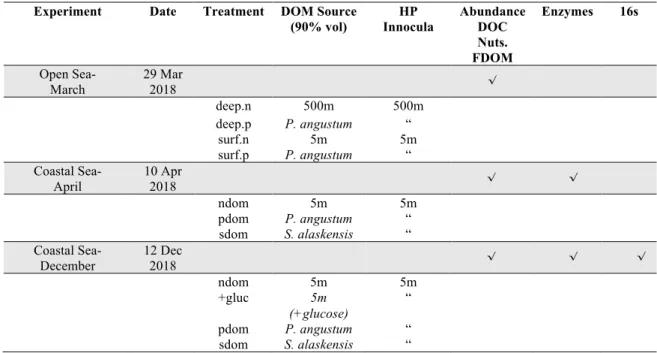
Table 1. Overview of the biodegradation experiments: Incubation date, treatment 783
abbreviations, dissolved organic matter (DOM) and heterotrophic prokaryote (HP) 784
innocula sources. deep.n: Deep DOM-Deep HP. deep.p: P. angustum DOM -Deep HP 785
surf.n: Surface DOM-Surface HP. surf.p: P. angustum DOM -Surface HP. ndom: 786
Surface DOM-Surface HP. +gluc: Surface DOM+ glucose-Surface HP. pdom : P. 787
angustum DOM -Surface HP. sdom: S. alaskensis DOM-Surface HP
788 789
Experiment Date Treatment DOM Source (90% vol) HP Innocula Abundance DOC Nuts. FDOM Enzymes 16s Open Sea- March 29 Mar 2018 √ deep.n 500m 500m deep.p P. angustum “ surf.n 5m 5m surf.p P. angustum “ Coastal Sea- April 10 Apr 2018 √ √ ndom 5m 5m pdom P. angustum “ sdom S. alaskensis “ Coastal Sea-December 12 Dec 2018 √ √ √ ndom 5m 5m +gluc 5m (+glucose) “ pdom P. angustum “ sdom S. alaskensis “ 790