HAL Id: hal-00317974
https://hal.archives-ouvertes.fr/hal-00317974
Submitted on 23 Mar 2006
HAL is a multi-disciplinary open access
archive for the deposit and dissemination of
sci-entific research documents, whether they are
pub-lished or not. The documents may come from
teaching and research institutions in France or
abroad, or from public or private research centers.
L’archive ouverte pluridisciplinaire HAL, est
destinée au dépôt et à la diffusion de documents
scientifiques de niveau recherche, publiés ou non,
émanant des établissements d’enseignement et de
recherche français ou étrangers, des laboratoires
publics ou privés.
Relation between substorm characteristics and rapid
temporal variations of the ground magnetic field
A. Viljanen, E. I. Tanskanen, A. Pulkkinen
To cite this version:
A. Viljanen, E. I. Tanskanen, A. Pulkkinen. Relation between substorm characteristics and rapid
temporal variations of the ground magnetic field. Annales Geophysicae, European Geosciences Union,
2006, 24 (2), pp.725-733. �hal-00317974�
Ann. Geophys., 24, 725–733, 2006 www.ann-geophys.net/24/725/2006/ © European Geosciences Union 2006
Annales
Geophysicae
Relation between substorm characteristics and rapid temporal
variations of the ground magnetic field
A. Viljanen1, E. I. Tanskanen1,2, and A. Pulkkinen2
1Finnish Meteorological Institute, Space Research Unit, P.O.B. 503, FI-00101 Helsinki, Finland 2NASA/Goddard Space Flight Center, Code 612.2, Greenbelt, MD 20771, USA
Abstract. Auroral substorms are one of the major causes of large geomagnetically induced currents (GIC) in tech-nological systems. This study deals with different phases of the auroral substorm concerning their severity from the GIC viewpoint. Our database consists of 833 substorms observed by the IMAGE magnetometer network in 1997 (around sunspot minimum) and 1999 (rising phase of the sunspot cycle), divided into two classes according to the Dst
index: non-storm (Dst>–40 nT, 696 events) and storm-time
ones (Dst<–40 nT, 137 events). The key quantity
concern-ing GIC is the time derivative of the horizontal magnetic field vector (dH /dt ) whose largest values during substorms occur most probably at about 5 min after the onset at stations with CGM latitude less than 72 deg. When looking at the me-dian time of the occurrence of the maximum dH /dt after the expansion onset, it increases as a function of latitude from about 15 min at CGM lat=56 deg to about 45 min at CGM lat=75 deg for non-storm substorms. For storm-time events, these times are about 5 min longer. Based on calculated iono-spheric equivalent currents, large dH /dt occur mostly dur-ing the substorm onset when the amplitude of the westward electrojet increases rapidly.
Keywords. Geomagnetism and paleomagnetism (Rapid time variations) – Ionosphere (Auroral ionosphere) – Mag-netospheric physics (Storms and substorms)
1 Introduction
Associated with geomagnetic variations, geomagnetically in-duced currents (GIC) flow in technological conductor sys-tems such as power grids and pipelines (e.g. Boteler et al., 1998; Kappenman, 1996, 2005; Molinski, 2002). The ba-sic principle follows from Faraday’s law linking temporal Correspondence to: A. Viljanen
changes of the magnetic flux to the electromotive force. So a geoelectric field is always associated with a temporally vary-ing geomagnetic field. This means that the time derivative of the ground magnetic field (dB/dt ) characterizes GIC ac-tivity. More explicitly, the horizontal component of the vec-tor (dH /dt) is the relevant quantity (Viljanen et al., 2001). Calculation of GIC is practical in two independent steps: 1) determine the (horizontal) electric field at the earth’s sur-face, 2) determine induced currents driven by this electric field in a specified conductor system. One technique used in postanalysis of GIC events is presented by Viljanen et al. (2004).
The ability to derive GIC statistics based on magnetic recordings can help utilities to estimate which parts of a con-ductor system might be susceptible to GIC effects. How-ever, this does not help in preventing immediate damages, which may develop in a few minutes during magnetic dis-turbances. The best-known cases concerning power system failures are the Qu´ebec blackout in Canada in March 1989 (Bolduc, 2002), and the Malm¨o blackout in Sweden in Octo-ber 2003 (Pulkkinen et al., 2005; Rosenqvist et al., 2005).
The present solar wind observations at the L1 point allow for a 30–60 min warning time in practice. It would be ideal if GIC forecasts could be provided at least one hour prior to anticipated large events, because certain system operating changes can take 1–2 h to complete (Molinski, 2002).
Exact local warnings would require that dB/dt could be forecasted as a time series close to the sites where GIC are of interest. The surface grid could be quite sparse (of a 100-km scale), but it would be critical to predict dB/dt accu-rately, especially concerning the largest values. Weigel et al. (2003) has attempted to forecast the 30-min average absolute magnitude of dB/dt directly from solar wind observations. The highest prediction efficiencies achieved are about 0.7. The success of the prediction is highly dependent on the spa-tial location and on the local time. Wintoft (2005) showed that the 10-min log-root-mean-square of dX/dt and dY /dt
726 A. Viljanen et al.: Substorms and large dB/dt
Figures
0 5 10 15 20 0 100 200 300 400 500 600 700 MLT [h] #timesteps with abs(GIC) > 2.5 A (Pirttikoski)
Fig. 1. Diurnal variation of the number of observations in 1999-2000 when the absolute
value of GIC (10 s data) exceeded 2.5 A at the Pirttikoski 400 kV transformer in northern
Finland. The corrected geomagnetic (CGM) latitude of this site is about 63 deg N. The
figure is taken from Viljanen et al. (2001)
55 60 65 70 75 80 0 0.5 1 1.5 2 2.5 CGM lat. [deg] mean of max(dH/dt) [nT/s]
non-storm (o), storm-time (*)
Fig. 2. Average of max(|dH/dt|) during substorms as a function of the CGM latitude.
Circles: non-storm substorms, asterisks: storm-time substorms.
15
Fig. 1. Diurnal variation of the number of observations in 1999–
2000 when the absolute value of GIC (10-s data) exceeded 2.5 A at the Pirttikoski 400-kV transformer in northern Finland. The cor-rected geomagnetic (CGM) latitude of this site is about 63 deg N. The figure is taken from Viljanen et al. (2001).
at two subauroral locations may be predicted up to 30 min in advance with a linear correlation coefficient close to 0.8.
The main difficulty in GIC forecasting is obviously the large variability of the length scales of ionospheric current systems relevant to GIC (Pulkkinen et al., 2003a,b). Viljanen et al. (1999) listed some event types in their Table 1, during which large GIC may occur. A manual rough classification of one-year GIC data indicated that rapid enhancements of large-scale auroral electrojets, substorm onsets, pulsations, and sudden impulses have caused significant GIC. The di-urnal occurrence of large GIC values at one site in northern Finland is shown in Fig. 1. There is a clear maximum around the magnetic midnight corresponding most probably to sub-storm activity. This gives the motivation for this paper to in-vestigate auroral substorms in detail from the GIC viewpoint. Since GIC measurements are not available as extensively as magnetic recordings, we use the latter ones.
An enhanced geomagnetic activity is obviously a precon-dition for the occurrence of large GIC. However, a large mag-netic variation field B itself does not necessarily imply that
dB/dt is also large, and vice versa. As shown by Viljanen
et al. (2001), large dB/dt events are nearly always related to westward ionospheric currents. However, the directional dis-tributions of the horizontal time derivative vector (dH /dt ) are much more scattered than those of the simultaneous hor-izontal variation field vector (H ). This is possible only if there are rapidly changing ionospheric current systems of a length scale of 100 km or less embedded in a smooth back-ground east-west flow. Pulkkinen et al. (2003a), Pulkkinen et al. (2003b) and Viljanen et al. (2004) have demonstrated this
Figures
0 5 10 15 20 0 100 200 300 400 500 600 700 MLT [h] #timesteps with abs(GIC) > 2.5 A (Pirttikoski)
Fig. 1. Diurnal variation of the number of observations in 1999-2000 when the absolute
value of GIC (10 s data) exceeded 2.5 A at the Pirttikoski 400 kV transformer in northern
Finland. The corrected geomagnetic (CGM) latitude of this site is about 63 deg N. The
figure is taken from Viljanen et al. (2001)
55 60 65 70 75 80 0 0.5 1 1.5 2 2.5 CGM lat. [deg] mean of max(dH/dt) [nT/s]
non-storm (o), storm-time (*)
Fig. 2. Average of max(|dH/dt|) during substorms as a function of the CGM latitude.
Circles: non-storm substorms, asterisks: storm-time substorms.
15
Fig. 2. Average of max(|dH /dt |) during substorms as a function of
the CGM latitude. Circles: non-storm substorms, asterisks: storm-time substorms.
with single events. It is obvious that GIC forecasting can-not be based on solar wind data only, but conditions in the magnetosphere and ionosphere are important too.
The main science question to which we are looking for an answer in this paper is how the GIC activity varies during dif-ferent substorm phases. We start examining characteristics of
dH /dt followed by a study of the temporal and spatial
be-haviour of ionospheric equivalent currents during substorms.
2 Results
2.1 Data description
Our database consists of 833 substorms in 1997 (around sunspot minimum) and 1999 (rising phase of the sunspot cy-cle 23) observed by the IMAGE magnetometer network in northern Europe (Tanskanen et al., 2002). IMAGE covers the magnetic latitudes where the electrojets related to sub-storms are flowing. We used the local variant of the AL in-dex (IL inin-dex) to define a substorm. We looked for nega-tive bay-type variations of IL (>100 nT) showing a clear on-set when IL rapidly decreases at least 100 nT within 10 min. We considered the periods between 16:00 UT and 02:00 UT (about 18:00–04:00 MLT), when IL gives a good estimate of the global AL. The exact timing of the onset is somewhat subjective, so there is a couple of minutes inaccuracy. We divided the events into two classes, non-storm and storm-time ones, according to the Dst index. The value of Dst is
smaller than –40 nT for storm-time substorms and larger than –40 nT for non-storm ones, respectively (Kallio et al., 2000). In this dataset, there are 696 non-storm and 137 storm-time substorms (from the original list of Tanskanen et al. (2002),
A. Viljanen et al.: Substorms and large dB/dt 727 0 10 20 30 40 50 60 70 80 90 0 10 # 696 non-storm substorms
LYR (75.12 MLAT), median = 47 min
0 10 20 30 40 50 60 70 80 90
0 20
#
SOD (63.92 MLAT), median = 22 min
0 10 20 30 40 50 60 70 80 90
0 20 40
time of max(dH/dt) after onset [min]
#
NUR (56.89 MLAT), median = 14 min
0 10 20 30 40 50 60 70 80 90 0 2 4 # 137 storm-time substorms
LYR (75.12 MLAT), median = 56 min
0 10 20 30 40 50 60 70 80 90
0 5
#
SOD (63.92 MLAT), median = 28 min
0 10 20 30 40 50 60 70 80 90
0 5
time of max(dH/dt) after onset [min]
#
NUR (56.89 MLAT), median = 25 min
Fig. 3. Time of max(|dH/dt|) after the substorm onset at three IMAGE sites: LYR, SOD,
NUR. Upper panel: non-storm substorms, lower panel: storm-time substorms.
Fig. 3. Time of max(|dH /dt|) after the substorm onset at three
IM-AGE sites: LYR, SOD, NUR. Upper panel: non-storm substorms, lower panel: storm-time substorms.
6 events were omitted). The time resolution of the magnetic data is 1 min.
We use the magnetic variation field from which the quiet-time baseline is subtracted. The baselines have been selected visually for each day separately. The time derivative of the field is the difference between two successive values divided by the sampling interval, and it is independent of the base-line. One minute is still a sufficiently short time step to reveal characteristic features of dH /dt.
2.2 Characteristics of dH /dt
The average of the maximum |dH /dt | at each IMAGE site is shown in Fig. 2. During storm-time substorms,
55 60 65 70 75 80 0 5 10 15 20 25 30 35 40 45 50 55 CGM lat. [deg]
median time of max(dH/dt) [min]
696 non-storm substorms 55 60 65 70 75 80 0 5 10 15 20 25 30 35 40 45 50 55 CGM lat. [deg]
median time of max(dH/dt) [min]
137 storm-time substorms
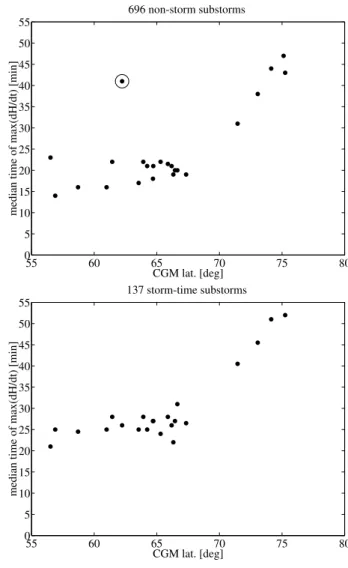
Fig. 4. The median time of max(|dH/dt|) after the onset as a function of the CGM latitude.
Upper panel: non-storm substorms, lower panel: storm-time substorms. A clear outlier is
marked by a circle.
17
Fig. 4. The median time of max(|dH /dt|) after the onset as a
func-tion of the CGM latitude. Upper panel: non-storm substorms, lower panel: storm-time substorms. A clear outlier is marked by a circle.
max(|dH /dt |) is approximately twice the value of non-storm substorms at all latitudes. The site of maximum |dH /dt | as a function of latitude is about 5 deg more southward for storm-time than for non-storm substorms. The gap between the latitudes 67 and 71 is due to the Arctic Ocean between the mainland and Bear Island.
The occurrence time of max(|dH /dt |) after the substorm onset at each available magnetometer site gives an overview of the GIC activity during substorms. Examples of oc-currence distributions at single sites are shown in Fig. 3. For non-storm substorms, distributions are sharply peaked at lower latitudes (NUR, SOD) as indicated by the maxima at about 5 min after the onset. However, there is still a clear tail in the distribution, which is typical for complex multiscale systems (Sornette, 2004). Distributions of max(|dH /dt|) are scattered for storm-time substorms at all sites, which may
728 A. Viljanen et al.: Substorms and large dB/dt 55 60 65 70 75 80 0 5 10 15 20 25 30 CGM lat. [deg]
peak time of max(dH/dt) [min]
696 non-storm substorms 55 60 65 70 75 80 0 5 10 15 20 25 30 CGM lat. [deg]
peak time of max(dH/dt) [min]
137 storm-time substorms
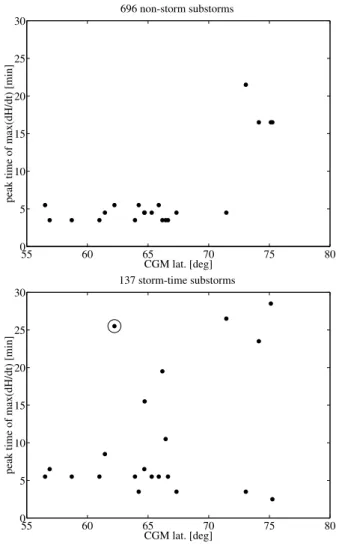
Fig. 5. The most probable time of max(|dH/dt|) after the onset as a function of the CGM
latitude. Upper panel: non-storm substorms, lower panel: storm-time substorms. A clear
outlier is marked by a circle.
18
Fig. 5. The most probable time of max(|dH /dt |) after the onset as
a function of the CGM latitude. Upper panel: non-storm substorms, lower panel: storm-time substorms. A clear outlier is marked by a circle.
also be due to the relatively small number of data. For a more quantitative comparison of the distributions, we performed a simple χ2test (e.g. Press et al., 2002) between pairs of sta-tions using time bins from 0 to 60 min. We then obtained the following χ2 values with the corresponding probabili-ties in parantheses. Non-storm substorms yield NUR-SOD 47.3 (0.86), NUR-LYR 244 (0.00), SOD-LYR 187 (0.00), and storm-time cases yield SOD 36.2 (0.99), NUR-LYR 70.1 (0.15), SOD-NUR-LYR 74.9 (0.08). This means roughly that the distributions at LYR are really different from those at SOD and NUR, whereas SOD and NUR are quite similar to each other.
The median value of the occurrence time of max(|dH /dt |) increases as a function of latitude (Fig. 4) for both non-storm and non-storm-time cases. The Svalbard stations (CGM lat
>70), including Bear Island, differ clearly from the continen-tal sites. In the non-storm case the station at CGM lat 62.23
0 20 40 60 80 100 120 0 5 10 15 20 25
std of occurrence of max(dH/dt) [min]
# 696 non-storm substorms median = 19 min 0 20 40 60 80 100 120 0 1 2 3 4 5 6 7 8 9
std of occurrence of max(dH/dt) [min]
#
137 storm-time substorms
median = 22 min
Fig. 6. Simultaneity of the occurrence of max(|dH/dt|) after the onset at the IMAGE sites.
The histogram presents the standard deviation of the maxima times. Events with data from
at least 15 stations are taken into account. Upper panel: non-storm substorms, lower panel:
storm-time substorms.
19
Fig. 6. Simultaneity of the occurrence of max(|dH /dt |) after the
onset at the IMAGE sites. The histogram presents the standard de-viation of the maxima times. Events with data from at least 15 stations are taken into account. Upper panel: non-storm substorms, lower panel: storm-time substorms.
(Rørvik) is a clear outlier due to the small amount of avail-able data.
When the most probable occurrence time of max(|dH /dt |) after onset is considered (Fig. 5), the situation becomes more complex. For non-storm substorms, the four sites in Svalbard (CGM lat >73) and the continental sites and Bear Island (CGM lat <71.5. deg) still comprise two distinct sets. The Svalbard stations are mostly north of the auroral oval around the local midnight (cf. Kauristie, 1995), so they do not show typical substorm features. Storm-time events in turn have quite an irregular behaviour as a function of latitude, evidently due to the small number of datapoints. However, also for them, the most probable maximum time is about 5 min after the onset at lowest latitudes.
A. Viljanen et al.: Substorms and large dB/dt 729 0 100 200 300 400 500 600 700 800 900 0 1 2 3 4 5 6 7 8 9 10 max(H) [nT] max(dH/dt) [nT/s] 696 non-storm substorms corr = 0.75 maxdh = 0.0060*maxh + 0.33 0 200 400 600 800 1000 1200 0 2 4 6 8 10 12 max(H) [nT] max(dH/dt) [nT/s] 137 storm-time substorms corr = 0.66 maxdh = 0.0055*maxh + 1.13
Fig. 7. max(|dH/dt|) versus |H| at the maximum times of |dH/dt| during non-storm (upper
panel) and storm-time (lower panel) substorms. The dashed line is the linear regression
curve.
Fig. 7. The max(|dH /dt |) versus |H | at the maximum times of
|dH /dt| during non-storm (upper panel) and storm-time (lower panel) substorms. The dashed line is the linear regression curve.
The characteristics of a GIC event also depend on how si-multaneously large dH /dt values occur. To quantify this, we have collected maximum times of dH /dt at all sites and calculated the standard deviation of them for each event. To have a good spatial coverage, we have only considered events with data available at least from 15 sites. A complete si-multaneity would produce a zero standard deviation, but in practice there is much scattering with a clearly tailed distri-bution as shown in Fig. 6. The simultaneity does not directly give any information about GIC values at a specific site, since the geometry of the induced geoelectric field should also be known.
An interesting open question is how closely |dH /dt | is related to |H |. Knowing the relationship may improve fore-casting possibilities. There is already quite a good success in predicting |H | or indices based on it, like AE (Gleisner
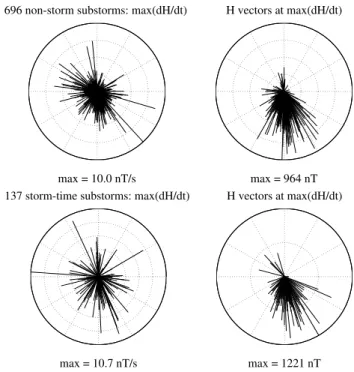
max = 10.0 nT/s
696 non-storm substorms: max(dH/dt)
max = 964 nT H vectors at max(dH/dt)
max = 10.7 nT/s
137 storm-time substorms: max(dH/dt)
max = 1221 nT H vectors at max(dH/dt)
Fig. 8. Upper row: max(dH/dt) vectors of non-storm substorms, and simultaneous H
vectors at the maximum sites of dH/dt. Lower row: the same for storm-time substorms.
The north direction is up and the east direction to the right.
Fig. 8. Upper row: max(dH /dt ) vectors of non-storm substorms,
and simultaneous H vectors at the maximum sites of dH /dt. Lower row: the same for storm-time substorms. The north direc-tion is up and the east direcdirec-tion to the right.
and Lundstedt, 1997). The relation between max(|H |) and max(|dH /dt |) for non-storm and storm-time substorms are shown in Fig. 7. These plots deal with the maximum value of |dH /dt | during each substorm with the simultaneous |H | at the maximum site of |dH /dt|. There is quite a high cor-relation between |H | and |dH /dt|, 0.75 for non-storm and 0.66 for storm-time substorms. However, for a given |H |, the range of |dH /dt| values is roughly ±2 nT/s. The slope of the regression curve is nearly the same for both types of substorms. This indicates that the (substorm) mechanism be-hind the relation between H and dH /dt may be independent of storm conditions.
A clear majority of max(|dH /dt |) is associated with a westward electrojet as shown in Fig. 8, since a southward variation field is due to a westward (equivalent) current flow in the ionosphere. The scattering of dH /dt means that rapid changes are not always due to an increase or decrease of the electrojet current, but they are often related to some smaller scale structures like vortices (Viljanen et al., 2001; Apatenkov et al., 2004).
The spatial occurrence of the maximum dH /dt is shown in Fig. 9. The average maximum site is more southward for storm-time substorms, and reflects the well-known shift of the auroral oval equatorwards during increased magnetic ac-tivity (e.g. Rostoker and Phan, 1986; Ahn et al., 2005). The same feature is obvious in Fig. 2. The dominance of some
730 A. Viljanen et al.: Substorms and large dB/dt
max = 24 %
occurrence of max(dH/dt) - non-storm substorms
10o W 5o W 0o 5oE 10oE 15oE 20oE 25oE 30oE 35oE 40oE 45oE 50oE 55 oE 60 oE 60o N 65o N 70o N 75o N HOP BJN HOP BJN HOP BJN HOP BJN HOP BJN HOP BJN HOP BJN HOP BJN HOP BJN HOP BJN HOP BJN HOP BJN HOP BJN HOP BJN HOP BJN HOP BJN HOP BJN HOP BJN HOP BJN HOP BJN HOP BJN HOP BJN HOP BJN HOP BJN HOP BJN HOP BJN HOP BJN max = 14 %
occurrence of max(dH/dt) - storm-time substorms
10o W 5o W 0o 5o E 10oE 15oE 20oE 25oE 30oE 35oE 40oE 45oE 50oE 55 oE 60 oE 60o N 65o N 70o N 75o N
Fig. 9. Spatial occurrence distribution of the maximum site of dH/dt during non-storm
(upper panel) substorms and storm-time substorms (lower panel).
22
Fig. 9. Spatial occurrence distribution of the maximum site of
dH /dt during non-storm (upper panel) substorms and storm-time substorms (lower panel).
sites is partly due to the local conductivity of the earth’s up-most crust: the larger the conductivity the larger dH /dt can be at short periods with small skin depths (Viljanen et al., 2001). Especially, the high conductivity of the ocean water has an obvious effect at BJN and HOP stations. On the other hand, H is less sensitive to the local earth conditions, since its power spectrum has largest amplitudes at longer periods
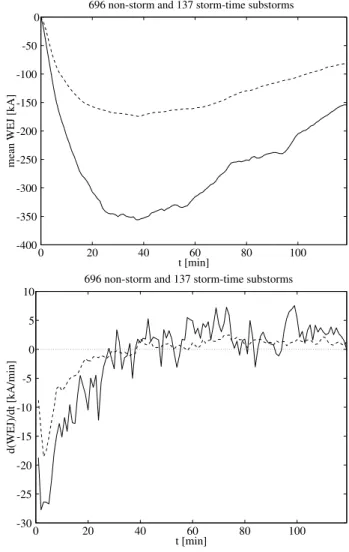
0 20 40 60 80 100 -400 -350 -300 -250 -200 -150 -100 -50 0 t [min]
mean WEJ [kA]
696 non-storm and 137 storm-time substorms
0 20 40 60 80 100 -30 -25 -20 -15 -10 -5 0 5 10 t [min] d(WEJ)/dt [kA/min]
696 non-storm and 137 storm-time substorms
Fig. 10. Mean total westward electrojet (WEJ) and its time derivative during a non-storm
(dashed line) and a storm-time substorm (uniform line). The origin of the time axis is the
substorm onset, when the current is set to zero.
23
Fig. 10. Mean total westward electrojet (WEJ) and its time
deriva-tive during a non-storm (dashed line) and a storm-time substorm (uniform line). The origin of the time axis is the substorm onset, when the current is set to zero.
than the time derivative. Consequently, relevant skin depths are larger for H than for dH /dt.
2.3 Ionospheric equivalent currents
Ionospheric equivalent currents have been calculated using the method of spherical elementary current systems (Amm, 1997; Pulkkinen et al., 2003a). The current density was de-termined along the geographic longitude 22.06 deg E from the latitude 59.02 N to 79.42 N with a 0.6-deg spacing. Since we did not separate the ground magnetic field into external and internal parts, the equivalent current actually contains the induced currents in the earth. This overestimates the iono-spheric contribution up to 40% at onset times close to the maximum current flow (Tanskanen et al., 2001). However, it is not a drawback from the viewpoint of the present study,
A. Viljanen et al.: Substorms and large dB/dt 731 0 20 40 60 80 100 120 56 58 60 62 64 66 68 70 72 74 t [min] GGM lat [deg]
mean(JY) [A/km], 696 non-storm substorms
-200 -200 -200 -200 -175 -175 -175 -175 -175 -175 -175 -150 -150 -150 -150 -150 -150 -150 -150 -150 -150 -125 -125 -125 -125 -125 -125 -125 -125 -125 -125 -100 -100 -100 -100 -100 -100 -100 -100 -100 -100 -75 -75 -75 -75 -75 -75 -75 -75 -75 -75 -75 -50 -50 -50 -50 -50 -50 -50 -50 -50 -50 -50 -25 -25 -25 -25 -25 -25 -25 -25 -25 -25 0 0 0 0 0 0 0 0 0 0 0 25 25 25 25 25 0 20 40 60 80 100 120 56 58 60 62 64 66 68 70 72 74 t [min] GGM lat [deg]
mean(JY) [A/km], 137 storm-time substorms
-400 -350 -350 -350 -350 -350 -350 -300 -300 -300 -300 -300 -300 -300 -300 -250 -250 -250 -250 -250 -250 -250 -250 -250 -250 -250 -250 -200 -200 -200 -200 -200 -200 -200 -200 -200 -200 -200 -150 -150 -150 -150 -150 -150 -150 -150 -150 -150 -150 -150 -100 -100 -100 -100 -100 -100 -100 -100 -100 -100 -100 -100 -50 -50 -50 -50 -50 -50 -50 -50 -50 -50 0 0 0 0 0 0 0 0 50
Fig. 11. Average eastward equivalent current density (JY ) during 120 minutes after the
onset at t = 0. Negative values marked by negative contour lines mean a westward current.
Dots show the location of the maximum westward current density. Upper panel: non-storm
substorms, lower panel: storm-time substorms.
Fig. 11. Average eastward equivalent current density (J Y ) during
120 min after the onset at t=0. Negative values marked by negative contour lines mean a westward current. Dots show the location of the maximum westward current density. Upper panel: non-storm substorms, lower panel: storm-time substorms.
since GIC is related to the total dH /dt at the earth’s surface. The mean temporal behaviour of the total westward cur-rent is shown in Fig. 10. We set the total curcur-rent to zero at the onset time, which does not affect the shape of the curves. The curves shown in the figures are the averages of all events. The time derivative was calculated from the average curve of the total current. As expected, the total current is more in-tense during storm-time events. The maximum of the deriva-tive occurs a few minutes after the onset, which is consistent with Fig. 3 (stations NUR and SOD). Due to using the in-tegrated total electrojet, the behaviour of the time derivative reflects mostly the large-scale characteristics of ionospheric currents.
The average equivalent ionospheric current density with respect to time and magnetic latitude is shown in Fig. 11.
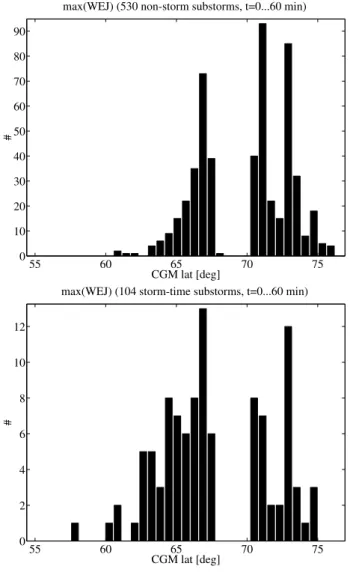
55 60 65 70 75 0 10 20 30 40 50 60 70 80 90 CGM lat [deg] #
max(WEJ) (530 non-storm substorms, t=0...60 min)
55 60 65 70 75 0 2 4 6 8 10 12 CGM lat [deg] #
max(WEJ) (104 storm-time substorms, t=0...60 min)
Fig. 12. Distribution of the latitude of the maximum of the westward equivalent current
(WEJ) density at the moment of the maximum dH/dt. Only timesteps within 60 minutes
after the onset are taken into account.
Fig. 12. Distribution of the latitude of the maximum of the
west-ward equivalent current (WEJ) density at the moment of the maxi-mum dH /dt . Only timesteps within 60 min after the onset are taken into account.
The largest westward current takes place at about geomag-netic latitude 70.5, 1 deg south of Bear Island (BJN in Fig. 9). However, during storm-time substorms, the maximum moves in a few minutes 4 deg southward above the continental coastline. The same happens for non-storm cases, but only after about 15 min after the onset. When analysing these fea-tures, we must note that there is a gap in IMAGE between latitudes 67.5 and 70.5 due to the Arctic Ocean. Further-more, the network is sparse north of Bear Island too. The method to calculate equivalent currents does not tend to pro-duce maxima of the current density in such gaps. It follows that the prominent asymmetry in the latitudinal distribution of the current density may not be true.
The latitude of the maximum westward current density at the moment of the maximum dH /dt is shown in Fig. 12. It
732 A. Viljanen et al.: Substorms and large dB/dt is very rare that the maximum takes place at CGM latitudes
lower than 60. This is in a good agreement with the results by Ahn et al. (2005). Again, the gap between latitudes 67.5 and 70.5 is an artifact due to the lack of stations. Finally, we determined the latitude of the maximum westward current density at the time of the largest |dH /dt | after onset. It is quite well linearly related to the latitude of max(|dH /dt |) with the correlation coefficient of 0.78.
3 Conclusions
The key quantity concerning geomagnetically induced cur-rents is the time derivative of the horizontal magnetic field vector (dH /dt), which is available on wide ground networks with good spatial and temporal coverages. Based on the study of 833 substorms, the largest values of dH /dt occur most probably during the substorm expansion phase at about five min after the expansion onset at stations with CGM lati-tudes less than 72 deg. However, the occurrence distribution has a long tail extending to tens of minutes. When looking at the median time of the occurrence of the maximum dH /dt after the onset, it increases as a function of latitude from about 15 min at CGM lat 56 deg to about 45 min at CGM lat 75 deg for non-storm substorms.
The maximum dH /dt can have a large east-west compo-nent compared to the north-south one, whereas the simul-taneous H is more concentrated into the southward direc-tion. This indicates that in addition to the rapid change of the main electrojet, there are often ionospheric structures of smaller scales having a comparable effect on dH /dt. In this sense, there seems to be no differences between non-storm and storm-time substorms except for in amplitudes, which are larger for the latter ones, and occur more southward. McPherron and Hsu (2002) found no qualitative distinction between the various classes of substorms, but they are likely to be caused by the same mechanism, and our results give some further support to this.
In this paper the relationship between the GIC activity, charaterised by the time derivative of the ground magnetic field, and substorm activity was examined for two years of which 1997 occurs around the sunspot minimum and 1999 at the rising phase of the sunspot cycle 23. A future study is needed to explore the GIC-substorm relationship in the descending sunspot cycle phase, when high speed streams are known to have a large effect on the substorm activity (Tanskanen et al., 2005).
Acknowledgements. IMAGE magnetometer data are collected as
an international project headed by the Finnish Meteorological In-stitute. We thank Fingrid Oyj and Gasum Oy companies for their long-term interest in GIC studies in Finland. The work of E. I. Tan-skanen was supported by the National Research Council in the US and Academy of Finland, and the work by A. Pulkkinen was per-formed when holding a National Research Council Associateship Award at NASA Goddard Space Flight Center.
Topical Editor I. A. Daglis thanks two referees for their help in evaluating this paper.
References
Ahn, B.-H., Chen, G. X., Sun, W., Gjerloev, J. W., Kamide, Y., Sigwarth, J. B., and Frank, L. A.: Equatorward expansion of the westward electrojet during magnetically disturbed periods, J. Geophys. Res., 110, doi:10.1029/2004JA010553, 2005. Amm, O.: Ionospheric Elementary Current Systems in Spherical
Coordinates and Their Application, J. Geomag. Geoelectr., 49, 947–955, 1997.
Apatenkov, S. V., Sergeev, V. A., Pirjola, R., and Viljanen, A.: Eval-uation of the geometry of ionospheric current systems related to rapid geomagnetic variations, Ann. Geophys., 22, 63–72, 2004. Bolduc, L.: GIC observations and studies in the Hydro-Quebec
power system, J. Atmos. Sol.-Terr. Phys., 64, 1793–1802, 2002. Boteler, D. H., Pirjola, R. J., and Nevanlinna, H.: The effects of
geo-magnetic disturbances on electrical systems at the earth’s surface, Adv. Space Res., 22, 17–27, 1998.
Gleisner, H. and Lundstedt, H.: Response of the auroral electro-jets to the solar wind modeled with neural networks, J. Geophys. Res., 102(A7), 14 269–14 270, 1997.
Kallio, E. I., Pulkkinen, T. I., Koskinen, H. E. J., Viljanen, A., Slavin, J. A., and Ogilvie, K.: Loading-Unloading Processes in the Nightside Ionosphere, Geophys. Res. Lett., 27, 1627–1630, 2000.
Kappenman, J. G.: Geomagnetic Storms and Their Impact on Power Systems, IEEE Power Engineering Review, May 1996, 5–8, 1996.
Kappenman, J. G.: An overview of the impulsive geomagnetic field disturbances and power grid impacts associated with the vio-lent Sun-Earth connection events of 29–31 October 2003 and a comparative evaluation with other contemporary storms, Space Weather, 3, S08C01, doi:10.1029/2004SW000128, 2005. Kauristie, K.: Statistical fits for auroral oval boundaries during the
substorm sequence, J. Geophys. Res., 100(A11), 21 885–21 895, 1995.
McPherron, R. L. and Hsu, T.-S.: A comparison of sub-storms occurring during magnetic sub-storms with those occur-ring duoccur-ring quiet times, J. Geophys. Res, 107(A9), 1259, doi:10.1029/2001JA002008, 2002.
Molinski, T. S.: Why utilities respect geomagnetically induced cur-rents, J. Atmos. Sol.-Terr. Phys., 64, 1765–1778, 2002.
Press, W. H., Teukolsky, S. A., Vetterling, W. T., and Flannery, B. P.: Numerical Recipes in C., The Art of Scientific Computing, Second Edition, Cambridge University Press, 2002.
Pulkkinen, A., Amm, O., Viljanen, A., and BEAR Working Group: Ionospheric equivalent current distributions determined with the method of spherical elementary current systems, J. Geophys. Res., 108(A2), 1053, doi:10.1029/2001JA005085, 2003a. Pulkkinen, A., Thomson, A., Clarke, E., and McKay, A.: April 2000
storm: ionospheric drivers of large geomagnetically induced cur-rents, Ann. Geophys., 21, 709–717, 2003b.
Pulkkinen, A., Lindahl, S., Viljanen, A., and Pirjola, R.: Geomag-netic storm of 29–31 October 2003: GeomagGeomag-netically induced currents and their relation to problems in the Swedish high-voltage power transmission system, Space Weather, S08C03, doi:10.1029/2004SW000123, 2005.
A. Viljanen et al.: Substorms and large dB/dt 733 Rosenqvist, L., Opgenoorth, H., Buchert, S., McCrea, I., Amm, O.,
and Lathuillere, C.: Extreme solar-terrestrial events of October 2003: High-latitude and Cluster observations of the large ge-omagnetic disturbances on 30 October, J. Geophys. Res., 110, doi:10.1029/2004JA010927, 2005.
Rostoker, G. and Phan, T. D.: Variation of auroral electrojet spatial location as a function of the level of magnetospheric activity, J. Geophys. Res., 91, 1716–1722, 1986.
Sornette, D.: Critical phenomena in natural sciences: chaos, frac-tals, selforganization, and disorder: concepts and tools, Springer, 2nd ed., 2004.
Tanskanen, E. I., Viljanen, A., Pulkkinen, T. I., Pirjola, R., H¨akkinen, L., Pulkkinen, A., and Amm, O.: At substorm on-set, 40% of AL comes from underground, J. Geophys. Res., 106, 13 119–13 134, 2001.
Tanskanen, E., Pulkkinen, T. I., Koskinen, H. E. J., and Slavin, J. A.: Substorm energy budget during low and high solar activity: 1997 and 1999 compared, J. Geophys. Res., 107, doi:10.1029/2001JA900153, 2002.
Tanskanen, E. I., Slavin, J. A., Tanskanen, A. J., Viljanen, A., Pulkkinen, T. I., Koskinen, H. E. J., Pulkkinen, A., and East-wood, J.: Magnetospheric substorms are strongly modulated by interplanetary high-speed streams, Geophys. Res. Lett., 32, L16104, doi:10.1029/2005GL023318, 2005.
Viljanen, A., Amm, O., and Pirjola, R.: Modelling Geomagneti-cally Induced Currents During Different Ionospheric Situations, J. Geophys. Res., 104, 28 059–28 072, 1999.
Viljanen, A., Nevanlinna, H., Pajunp¨a¨a, K., and Pulkkinen, A.: Time derivative of the horizontal geomagnetic field as an activity indicator, Ann. Geophys., 19, 1107–1118, 2001.
Viljanen, A., Pulkkinen, A., Amm, O., Pirjola, R., Korja, T., and BEAR Working Group: Fast computation of the geoelectric field using the method of elementary current systems and planar Earth models, Ann. Geophys., 22, 101–113, 2004.
Weigel, R. S., Klimas, A. J., and Vassiliadis, D.: Solar wind coupling to and predictability of ground magnetic fields and their time derivatives, J. Geophys. Res., 108(A7), 1298, doi:10.1029/2002JA009627, 2003.
Wintoft, P.: Study of the solar wind coupling to the time difference horizontal geomagnetic field, Ann. Geophys., 23, 1949–1957, 2005.