HAL Id: hal-01803761
https://hal.archives-ouvertes.fr/hal-01803761
Submitted on 30 May 2018
HAL is a multi-disciplinary open access
archive for the deposit and dissemination of
sci-entific research documents, whether they are
pub-lished or not. The documents may come from
teaching and research institutions in France or
abroad, or from public or private research centers.
L’archive ouverte pluridisciplinaire HAL, est
destinée au dépôt et à la diffusion de documents
scientifiques de niveau recherche, publiés ou non,
émanant des établissements d’enseignement et de
recherche français ou étrangers, des laboratoires
publics ou privés.
Building a Knowledge-Based Tool for Auto-Assessing
the Cardiovascular Risk
Adrien Ugon, Amel Imene Hadj Bouzid, Marie-Christine Jaulent, Madeleine
Favre, Catherine Duclos, Emmanuel Jobez, Hector Falcoff, Jean-Baptiste
Lamy, Rosy Tsopra
To cite this version:
Adrien Ugon, Amel Imene Hadj Bouzid, Marie-Christine Jaulent, Madeleine Favre, Catherine Duclos,
et al.. Building a Knowledge-Based Tool for Auto-Assessing the Cardiovascular Risk. Studies in
Health Technology and Informatics, IOS Press, 2018, �10.3233/978-1-61499-852-5-735�. �hal-01803761�
Building a Knowledge-Based Tool for
Auto-Adrien UGONa,1, Amel Imene HADJ BOUZIDb, Marie-Christine JAULENTb,
Madeleine FAVREc, d, Catherine DUCLOSb, Emmanuel JOBEZc, d,
Hector FALCOFFc, d, Jean-Baptiste LAMYb, Rosy TSOPRAb
aESIEE-Paris, Cité Descartes, 2 Boulevard Blaise Pascal, 93160 Noisy-le-Grand. bLIMICS, INSERM UMRS 1142, Université Paris 13, Sorbonne Paris Cité, 93017 Bobigny, France UPMC Université Paris 6, Sorbonne Universités, Paris.
cSociété de Formation Thérapeutique du Généraliste, France. d Collège de la Médecine Générale, France.
Abstract. The prevention of cardiovascular diseases needs first to quantify the
cardiovascular risk. To estimate this risk, French national health authorities provided clinical practice guidelines extending the existing European SCORE, which doesn't include all the cardiovascular risk factors (e.g. diabetes). Hence, French national clinical practice guidelines to quantify the cardiovascular risk is able to deal with more clinical situations than the SCORE. The goal of this paper is to formalize knowledge extracted from these guidelines and implement the rules so that they can be used into an auto-assessing tool of cardiovascular risk. Formalization followed five steps and was conducted under the guidance of medical experts. It resulted into a decision tree fed by eight decision variables. Evaluation of the accuracy of the decision tree showed 80% of agreement with an expert in medical informatics in predicting the cardiovascular risk level for 15 different clinical situations. Discrepancies correspond to the knowledge gaps within Clinical Practice Guidelines. We intend to extend the implementation of the decision tree to a complete tool, for allowing patient to auto-assess their cardiovascular risk. This tool will be integrated into a platform providing recommendations adapted to the calculated level of cardiovascular risk.
Keywords. Cardiovascular risk, Clinical Practice Guidelines, Formalization
1. Introduction
Cardiovascular (CV) Diseases are the most common cause of death in Europe [1]. Many risk factors are associated with CV diseases and can be controlled by prevention actions. To trigger prevention, many scores exist to auto-evaluate CV risk, proposed by international, national or local groups. Framingham-D'Agostino CV risk scale [2] is used to assess the global CV morbidity and mortality risk. It was validated for United States population, and needs calibration to be transposed to other countries [2]. In Europe, the Systematic Coronary Risk Estimation (SCORE) [3], provided by the European Society of Cardiology, gives an estimation of ten-year risk of fatal CV disease given the patient profile. But this score is restricted to patients in a specific age range (40-65 y), and
1 Corresponding author: [email protected]
Assessing the Cardiovascular Risk
© 2018 European Federation for Medical Informatics (EFMI) and IOS Press.
This article is published online with Open Access by IOS Press and distributed under the terms of the Creative Commons Attribution Non-Commercial License 4.0 (CC BY-NC 4.0). doi:10.3233/978-1-61499-852-5-735
shouldn’t be used for patients with risk factors such as blood pressure over 180/110 or diabetes. Discrepancies were also observed between the Framingham-D'Agostino and SCORE results on patient profiles associated to a high CV risk [4]. French national health authorities provided clinical practice guidelines (CPGs) to estimate the CV risk. In these guidelines, the cardiovascular risk is assessed by the SCORE, and when SCORE cannot not be applied (e.g. if diabetes), others parameters are used [3]. However, French CPGs are textual and complex documents dedicated to General Practitioners (GPs) [5]. Their use by patients within an computerized tool require their formalization [6]. The goal of our work was to build and implement an algorithm to auto-assess the CV risk by formalizing knowledge contained in CPGs.
2. Methods
2.1. Formalization of Clinical Practice Guidelines
To formalize the recommendations related to the assessment of the CV risk, we followed 5 steps [7]:
x Step 1: Identification of the decision variables.
x From textual recommendations, we manually extracted all the terms related to the decision making and grouped them into categories of variables for which we associated a set of values. For each variable, the set of values was built from the values found in CPGs, and was completed with the help of medical experts. For example, we extracted “moderate renal failure”, and “serious renal failure” and then grouped them into the variable “renal failure” for which we associated the following set of value {absent, moderate, serious}. x Step 2: Definition of the hierarchy of decision variables in the decision tree.
x The hierarchy of decision variables was first established according to the level of risk: the decision variables leading to a “very high CV risk” were put on the top, followed by those leading to a “high risk”, then those leading to a “moderate risk” and then to a “low risk”. The hierarchy was then validated by medical experts. They could decide to change the hierarchy according to the order in which the variables are usually tested in clinical practice.
x Step 3: Creation of a decision matrix.
x A decision matrix including all the combinations of the values of the decision variables was built to check if all situations were well taken into account.
x Step 4: Creation of the decision tree.
x The decision tree was created by ordering the decision variables resulting in a given output, as it was identified in previous steps.
x Step 5: Checking by medical experts.
x Medical experts checked whether the decision tree was compliant with textual recommendations from CPGs.
A. Ugon et al. / Building a Knowledge-Based Tool for Auto-Assessing the Cardiovascular Risk
2.2. Evaluation of the accuracy of the decision tree
We simulated a set of 15 clinical cases by attributing randomly some values for each decision variable, based on the prevalence of each risk factor in the population. For each clinical case, we compared the level of CV risk suggested by our tool to a gold standard. The gold standard was derived by a medical informatics expert – not involved in the building of the decision tree – from the reading of the guidelines in blind. For each clinical case, the expert was asked to give the clinical risk level associated by following faithfully the CPGs. For each clinical situation, the level of accuracy of the decision tree was considered as “exact” if it matched exactly to the gold standard. We determined the percentage of clinical situations for which the match was “exact”.
3. Results
3.1. Decision variables taking part in the assessment of the cardiovascular risk
Eight decision variables were identified and ordered as taking part in the assessment of the CV risk (See Table 1). Some variables share the same rank in the evaluation order, to be in accordance with the decision of the medical experts.
Table 1. Sets of values of decision variables. Variables are described according to their type, universe of discus,
and position in the hierarchy.
Variable Type Universe of discourse Hierarchical position Heterozygote Familial Hypercholesterolemia Boolean {yes, no} 1 Cardiovascular disease documented
Boolean {yes, no} 2
Chronic renal failure Enumeration {severe, moderate, absent} 3 Diabetes and related
complications
(Boolean, Boolean)
{(yes, yes) ;(yes, no), (no, no)}
4
Age Integer <40 ; ≥40 and ≤65 ; >65 5
Blood Pressure (BP) (Integer, Integer) ≥180 or ≥110 ; <180 and <110 5 At least one risk
factor
Boolean {yes, no} 6
SCORE Integer <1 ; ≥1 et<5 ; ≥5 et <10 ; ≥10 6
3.2. Decision matrix
All 1728 variables combinations were generated and associated to the devoted risk level according to the CPGs. This allowed us to identify the CPGs gaps. For instance, the CV risk level of a patient over 65 years old with no risk factor is not made explicit.
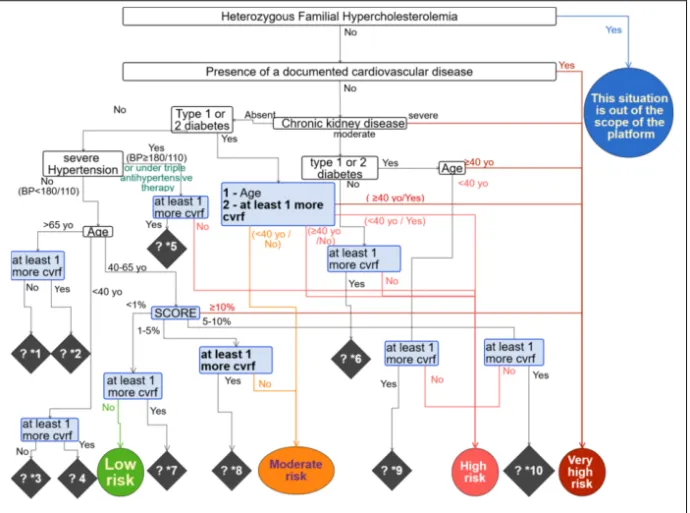
3.3. Decision tree
The decision tree is showed in Figure 1. Compliantly with the guidelines, it can lead to five levels of CV risk: “very high”, “high”, “moderate”, “low” and “Unknown”. “Unknown” corresponds to clinical situations for which there was a gap in CPGs. Nine gaps were found.
3.4. Accuracy of the decision tree
The accuracy of the decision tree was 80%. For three clinical cases, the level of CV risk calculated with the decision tree didn’t fully match with the gold standard because of knowledge gap within CPGs. In these situations, the decision tree considered that the risk was “unknown” because it could only be assessed at least at the level given in the CPG, whereas the evaluator gave a specific value for these situations. For example, for one clinical situation, the CV risk was calculated at “at least high level” (gap “?*5”) because it could be “high” or “very high” depending on the existence or not of risk factors which were not considered in CPGs, but taken into account by our panel of medical experts when building the decision tree (e.g. smoking or unbalanced food intake). By considering all outputs, without the “at least” mention, we obtain 100% of matching.
Figure 1. Decision tree of "Cardiovascular risk assessment". The decision tree shows levels of cardiovascular
risk in circle, decision variables in rectangle and knowledge gaps in lozenge. *cvrf stands for “cardiovascular risk factor”
4. Discussion
We formalized CPGs as a decision tree in order to build an algorithm for assessing the CV risk. The formalization considers the European SCORE, to which other risk factors were added among which diabetes, chronic renal failure, severe hypertension or age over
A. Ugon et al. / Building a Knowledge-Based Tool for Auto-Assessing the Cardiovascular Risk
65 years old. Including more risk factors and their relationships in the algorithm is important for an overall appreciation of the CV risk [8].
Yet the formalization has still limitations. Some CV risk factors, like overweight and inactivity weren’t considered, since CPGs ignore some of them. Thus, the estimation cannot be global; overall recommendations are still in discussion. But the formalization can follow evolution of knowledge because the method may update decision tree according to upgraded recommendations. Formalizing CPGs allowed to identify gaps [9]. Submitted to medical experts, a recommendation can be provided in all cases.
Our study has limitations. First, our formalization depends on a subjective interpretation of CPGs content. This was reduced by including six experts with different background: four general practitioners, two computer scientists. Second, the evaluation was limited by the number of clinical situations considered (n= 15) and the derivation of the gold standard by a single expert. However, the tree had been previously formally validated and, the expert had a good experience in reading CPGs and derived the gold standard blindly of the decision tree. A more robust evaluation should be conducted combining static and dynamic testing methods [10].
We intend to implement the algorithm in a tool, integrated into a platform, allowing people to get recommendations adapted to the calculated level of CV risk.
Acknowledgement
This work was funded by the French National Research through the PEPS DS0412 – 2016 project (ANR-16-CE19-0018).
References
[1] N. Townsend, L. Wilson, P. Bhatnagar, K. Wickramasinghe, M. Rayner, M. Nichols, Cardiovascular disease in Europe: epidemiological update 2016, Eur Heart J 37(42) (2016), 3232–45.
[2] R.B. D’Agostino, R.S. Vasan, M.J. Pencina, P.A. Wolf, M. Cobain, J.M. Massaro, et al., General Cardiovascular Risk Profile for Use in Primary Care: The Framingham Heart Study, Circulation 117(6) (2008), 743–53.
[3] Haute Autorité de Santé, Fiche mémo Évaluation du risque cardio-vasculaire, 2017.
[4] M.A. Gómez-Marcos, C. Martínez-Salgado, C. Martin-Cantera, J.I. Recio-Rodríguez, Y. Castaño-Sánchez, M. Giné-Garriga, et al., Therapeutic implications of selecting the SCORE (European) versus the D’AGOSTINO (American) risk charts for cardiovascular risk assessment in hypertensive patients, BMC
Cardiovasc Disord 9(1) (2009), 17.
[5] M. Lugtenberg, J.M. Zegers-van Schaick, G.P. Westert, J.S. Burgers, Why don’t physicians adhere to guideline recommendations in practice? An analysis of barriers among Dutch general practitioners,
Implement Sci IS 4 (2009); 54.
[6] M. Peleg, Computer-interpretable clinical guidelines: A methodological review, J Biomed Inform 46(4) (2013), 744–63.
[7] I. Colombet, A.-R. Aguirre-Junco, S. Zunino, M.-C. Jaulent, L. Leneveut, G. Chatellier, Electronic implementation of guidelines in the EsPeR system: a knowledge specification method, Int J Med Inf
74(7–8) (2005), 597–604.
[8] P. Meneton, C. Lemogne, E. Herquelot, S. Bonenfant, M.G.Larson, R.S Vasan, et al., A global view of the relationships between the main behavioural and clinical cardiovascular risk factors in the GAZEL prospective cohort, PLoS ONE 11(9) (2016), 1–20.
[9] R.N. Shiffman, G. Michel, A. Essaihi, E. Thornquist, Bridging the Guideline Implementation Gap: A Systematic, Document-Centered Approach to Guideline Implementation, J Am Med Inform Assoc 11(5) (2004), 418–26.
[10] J.B. Lamy, A. Ellini, J. Nobécourt, A. Venot, J.D. Zucker, Testing methods for decision support systems,