LETTER
Emission metrics under the 2 °C climate stabilization target
Katsumasa Tanaka
&Daniel J. A. Johansson
&Brian C. O
’Neill
&Jan S. Fuglestvedt
Received: 31 July 2012 / Accepted: 27 December 2012 / Published online: 6 February 2013 # Springer Science+Business Media Dordrecht 2013
Abstract In multi-gas climate policies such as the Kyoto Protocol one has to decide how to
compare the emissions of different greenhouse gases. The choice of metric could have
significant implications for mitigation priorities considered under the prospective
negotia-tions for climate mitigation agreements. Several metrics have been proposed for this task
with the Global Warming Potential (GWP) being the most common. However, these metrics
have not been systematically compared to each other in the context of the 2 °C climate
stabilization target. Based on a single unified modeling framework, we demonstrate that
metric values span a wide range, depending on the metric structure and the treatment of the
time dimension. Our finding confirms the basic salient point that metrics designed to
represent different aspects of the climate and socio-economic system behave differently.
Our result also reflects a complex interface between science and policy surrounding metrics.
Thus, it is important to select or design a metric suitable for climate stabilization based on an
interaction among practitioners, policymakers, and scientists.
1 Introduction
Deep cuts in the emissions of various climate forcers are necessary if the world aims to
achieve the 2 °C stabilization target (Meinshausen et al.
2009
; Rogelj et al.
2011
). The
Electronic supplementary material The online version of this article (doi:10.1007/s10584-013-0693-8) contains supplementary material, which is available to authorized users.
K. Tanaka (*)
Institute for Atmospheric and Climate Science, ETH Zurich (Swiss Federal Institute of Technology), Zurich, Switzerland
e-mail: [email protected] K. Tanaka
:
J. S. FuglestvedtCICERO (Center for International Climate and Environmental Research– Oslo), Oslo, Norway D. J. A. Johansson
Division of Physical Resource Theory, Department of Energy and Environment, Chalmers University of Technology, Gothenburg, Sweden
B. C. O’Neill
importance of this target has been recognized in the global policy arena since the
Copenhagen Accord in 2009. In climate policies that include emissions of multiple
com-pounds, the relative importance of these different types of emission needs to be placed on a
common scale. This is done by converting emissions of different compounds to CO
2-equivalent emissions through emission metrics (e.g., (Fuglestvedt et al.
2003
; Lashof and
Ahuja
1990
; Tanaka et al.
2010
)). Different metrics can give rise to substantial differences in
the composition of CO
2-equivalent emissions and will affect mitigation priorities. Issues
associated with metrics have been investigated in the scientific community for decades
(Fuglestvedt et al.
2003
,
2010
; O’Neill
2000
,
2003
; Shine
2009
; Tanaka et al.
2010
), and
there has been a renewed interest in metrics among stakeholders from industries,
policy-making, and science during the past few years. Two recent examples of the international
science and policy communities discussing metric issues are: i) the Intergovernmental Panel
on Climate Change (IPCC) Expert Meeting on the Science of Alternative Metrics (IPCC
2009
) held in Oslo, Norway in March 2009 and ii) the workshop on common metrics to
calculate the CO
2equivalence of anthropogenic greenhouse gas emissions by sources and
removals by sinks (UNFCCC
2012
) in Bonn, Germany in April 2012 initiated by the
Subsidiary Body for Scientific and Technological Advice (SBSTA) to the United Nations
Framework Convention on Climate Change (UNFCCC).
We address emission metrics under stabilizations (Berntsen et al.
2010
).
1Given a
stabilization level (e.g., 2 °C target), an emissions scenario consistent with the stabilization
level can be derived from an Integrated Assessment Model (IAM) under certain climatic and
socio-economic assumptions. The IAM (assuming that it is based on an intertemporal
optimization framework) also gives a specific level of tax or price on the emissions that
underlies the emissions scenario. This price serves as the basis for the price ratio approach to
metric design (Manne and Richels
2001
) (Table
1
). Simpler but more transparent metrics—
which are not directly derived from an IAM—can be constructed given a stabilization
emissions scenario. The emissions pathway provides background concentrations and
radia-tive efficiencies of CO
2and other relevant components, on which metric values are
estimat-ed. A variety of approaches to the metric structure are available (Table
1
). The treatment of
the time horizon for metrics offers multiple choices (Table
2
). Constructing a metric
involves, however, scientific underpinnings and policy considerations as well as value
judgments (Tanaka et al.
2010
).
The Global Warming Potential (GWP)
– the current metric used in the Kyoto Protocol –
has been criticized from many angles since its inception (Fuglestvedt et al.
2010
; O
’Neill
2000
; Shine
2009
; Smith and Wigley
2000
; Wigley
1998
). Arguably the principal criticism
is: the GWP is not designed to guide emissions toward any stabilization target. One
prominent example along this line is the criticism that the time horizon of 100 years used
to compute the Kyoto GWP
– which seems to have been arbitrary chosen (Shine
2009
)
– is
irrelevant to any particular climate policy (Manne and Richels
2001
; Shine et al.
2007
) even
though metric values are sensitive to the selected time horizon. In light of various criticisms,
alternative metrics have been put forward (Table
1
). Many proposed metrics are substantially
different from each other in construction. However, these metrics have not been
systemat-ically compared in the context of a 2 °C stabilization target, leading to the following
questions: How differently do the various proposed metrics behave in a 2 °C target context?
1
The link between metrics and stabilization targets may either be direct in the sense that the target is taken into account in the construction of the metric, indirect in that the path towards stabilization is used in calculating the values of the metric, or both.
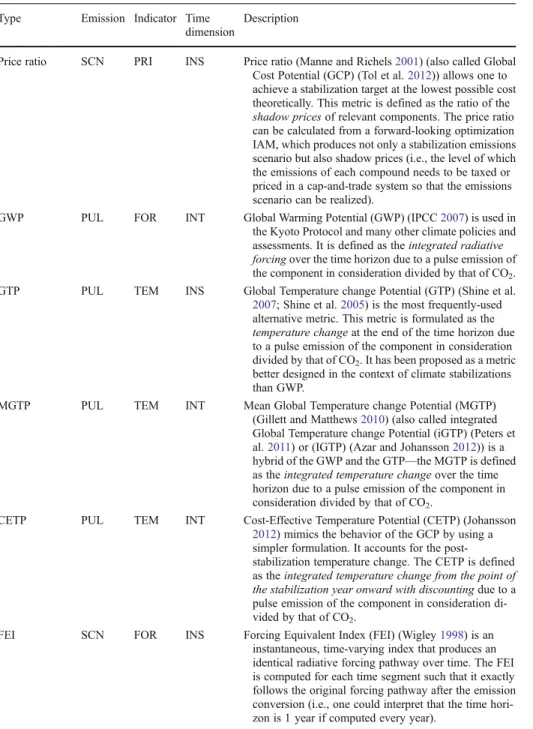
Table 1 Approaches to the metric structure design. Metrics are classified according to the following three entities: i) emission, ii) indicator, and iii) time dimension. i) PUL and SCN indicate pulse emissions and emissions scenarios, respectively that are used to define the corresponding metrics. ii) FOR, TEM, and PRI denote radiative forcing, temperature change, and price, respectively, which are the indicators for the respective metrics. iii) INT and INS mean that a time-integrated and instantaneous indicator, respectively are used for the associated metrics. Note that the integration for the CETP accounts for discounting. A discounting of 0 % is implicitly assumed for other integrated metrics over the time horizon and an infinite discounting beyond the end of the time horizon
Type Emission Indicator Time dimension
Description
Price ratio SCN PRI INS Price ratio (Manne and Richels2001) (also called Global Cost Potential (GCP) (Tol et al.2012)) allows one to achieve a stabilization target at the lowest possible cost theoretically. This metric is defined as the ratio of the shadow prices of relevant components. The price ratio can be calculated from a forward-looking optimization IAM, which produces not only a stabilization emissions scenario but also shadow prices (i.e., the level of which the emissions of each compound needs to be taxed or priced in a cap-and-trade system so that the emissions scenario can be realized).
GWP PUL FOR INT Global Warming Potential (GWP) (IPCC2007) is used in the Kyoto Protocol and many other climate policies and assessments. It is defined as the integrated radiative forcing over the time horizon due to a pulse emission of the component in consideration divided by that of CO2.
GTP PUL TEM INS Global Temperature change Potential (GTP) (Shine et al.
2007; Shine et al.2005) is the most frequently-used
alternative metric. This metric is formulated as the temperature change at the end of the time horizon due to a pulse emission of the component in consideration divided by that of CO2. It has been proposed as a metric
better designed in the context of climate stabilizations than GWP.
MGTP PUL TEM INT Mean Global Temperature change Potential (MGTP)
(Gillett and Matthews2010) (also called integrated Global Temperature change Potential (iGTP) (Peters et
al.2011) or (IGTP) (Azar and Johansson2012)) is a
hybrid of the GWP and the GTP—the MGTP is defined as the integrated temperature change over the time horizon due to a pulse emission of the component in consideration divided by that of CO2.
CETP PUL TEM INT Cost-Effective Temperature Potential (CETP) (Johansson 2012) mimics the behavior of the GCP by using a simpler formulation. It accounts for the post-stabilization temperature change. The CETP is defined as the integrated temperature change from the point of the stabilization year onward with discounting due to a pulse emission of the component in consideration di-vided by that of CO2.
FEI SCN FOR INS Forcing Equivalent Index (FEI) (Wigley1998) is an instantaneous, time-varying index that produces an identical radiative forcing pathway over time. The FEI is computed for each time segment such that it exactly follows the original forcing pathway after the emission conversion (i.e., one could interpret that the time hori-zon is 1 year if computed every year).
Here we illustrate how diverse metric values could behave on a 2 °C stabilization
pathway. Our study explores the variety of approaches to the metric structure (Table
1
)
and the distinct treatments of the time horizon (Table
2
).
Our study is most related to Johansson (
2012
) and Reisinger et al. (
2011
). While Reisinger et
al. (
2011
) investigates only the GWP with constant time horizons under four forcing
stabilization scenarios and (Johansson
2012
) considers just one stabilization level and three
metrics, we address seven different metrics (Table
1
) with constant and time-dependent time
horizons (Table
2
) under a 2 °C stabilization scenario (as well as different stabilization
targets (
Supplementary Material
)). While the forcing stabilization scenarios used in
Reisinger et al. (
2011
) are generated elsewhere, our approach consistently uses the same
modeling framework to compute the emissions scenarios and metric values. In other words,
our approach is, like Johansson (
2012
), consistent and transparent in the sense that the
underlying climatic and economic assumptions are simultaneously considered in the
Table 1 (continued)
Type Emission Indicator Time dimension
Description
TEMP SCN TEM INT TEMperature Proxy index (TEMP) (Tanaka et al.2009a) is to ensure a climatic equivalency (Shine2009). The TEMP is a numerical index that allows an emission exchange between two components over time such that the temperature pathway after the emission conversion is kept as close as possible with the original temperature pathway. The TEMP is, in contrast to the FEI, calcu-lated over the entire time horizon. Unlike the FEI, the best-fitting temperature pathway after the emission conversion is not necessarily identical with the original pathway. However, the TEMP can be updated by re-fitting based on a revised time horizon, which makes the TEMP time-dependent. The TEMP presented here uses the forward-looking approach (in contrast to the backward-looking approach mainly shown in Tanaka et al. (2009a)), which is equivalent to the time-dependent time horizon (Table2).
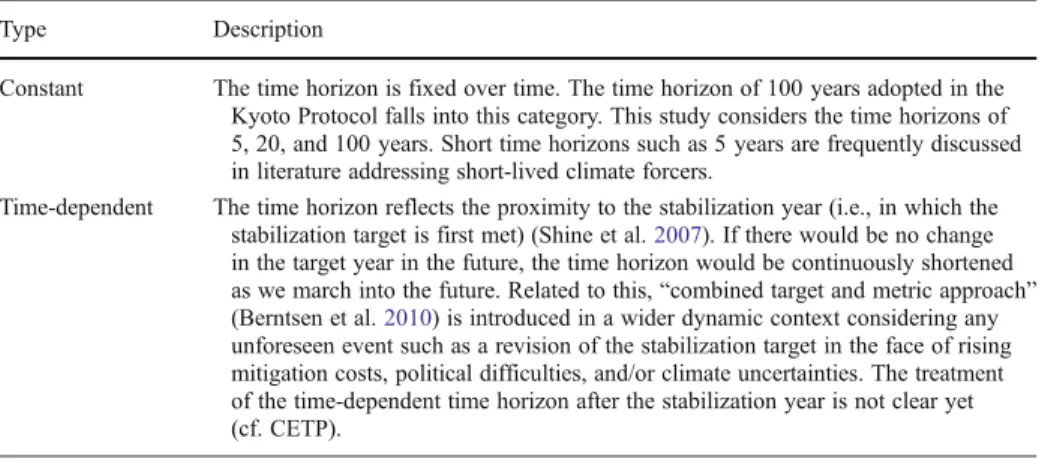
Table 2 Treatments of the metric time horizon
Type Description
Constant The time horizon is fixed over time. The time horizon of 100 years adopted in the Kyoto Protocol falls into this category. This study considers the time horizons of 5, 20, and 100 years. Short time horizons such as 5 years are frequently discussed in literature addressing short-lived climate forcers.
Time-dependent The time horizon reflects the proximity to the stabilization year (i.e., in which the stabilization target is first met) (Shine et al.2007). If there would be no change in the target year in the future, the time horizon would be continuously shortened as we march into the future. Related to this,“combined target and metric approach” (Berntsen et al.2010) is introduced in a wider dynamic context considering any unforeseen event such as a revision of the stabilization target in the face of rising mitigation costs, political difficulties, and/or climate uncertainties. The treatment of the time-dependent time horizon after the stabilization year is not clear yet (cf. CETP).
scenario calculations and metric computations. Note that our economic model is simpler
than those in many IAMs (cf. (Reisinger et al.
2012
; Smith et al.
2012
)) and we use a
reduced-complexity climate and carbon cycle model (cf. (Gillett and Matthews
2010
)). Our
study does not consider metrics that explicitly require a cost-benefit framework (e.g.,
(Marten and Newbold
2012
)) such as the Global Damage Potential (GDP) (Fankhauser
1994
).
2 Method
Calculations of the stabilization scenarios and metric values are based consistently on the
Aggregated Carbon Cycle, Atmospheric Chemistry, and Climate model (ACC2) (Tanaka et
al.
2007
; Tanaka et al.
2009a
,
b
), which comprises a box model of the global carbon cycle,
simple parameterizations of the atmospheric chemistry, and a land-ocean energy balance
model. For further details, see
Supplementary Material
.
Our experimental setup can be summarized in the following two steps:
i)
Compute a stabilization emissions scenario by minimizing the total abatement costs
such that global warming is capped at 2°C: The total abatement costs are derived
from the Marginal Abatement Cost functions for CO
2, CH
4, and N
2O, which are
adopted from the Multi-gas Mitigation Climate model (MiMiC) ((Johansson
2011
);
see
Supplementary Material
). The abatement levels are defined relative to the baseline
emission levels (i.e., no mitigation involved) provided by the International Institute for
Applied Systems Analysis (IIASA) Greenhouse Gas Initiative (GGI) A2r baseline
scenario (Riahi et al.
2007
). The 2 °C stabilization emissions scenario we obtained is
shown in Figure
S1
of
Supplementary Material
.
ii)
Estimate the values of various metrics on the stabilization emissions scenario: We use
the same modeling framework for the calculations of metric values. The price ratio is
directly obtained from the calculation of the stabilization emissions scenario. Other
metrics such as GWP, Global Temperature change Potential (GTP), Mean Global
Temperature change Potential (MGTP), Cost-Effective Temperature Potential
(CETP), Forcing Equivalent Index (FEI), and TEMperature Proxy index (TEMP)
(Table
1
) are computed separately, given the stabilization emissions scenario. The
treatment of the time horizon is explained in Table
2
. Further details are described in
Supplementary Material
.
With regard to key assumptions, this study uses standard assumptions of 3 °C climate
sensitivity for CO
2doubling and 5 % discount rate and is confined to the case of 2 °C
stabilization. Different stabilization levels are considered in
Supplementary Material
.
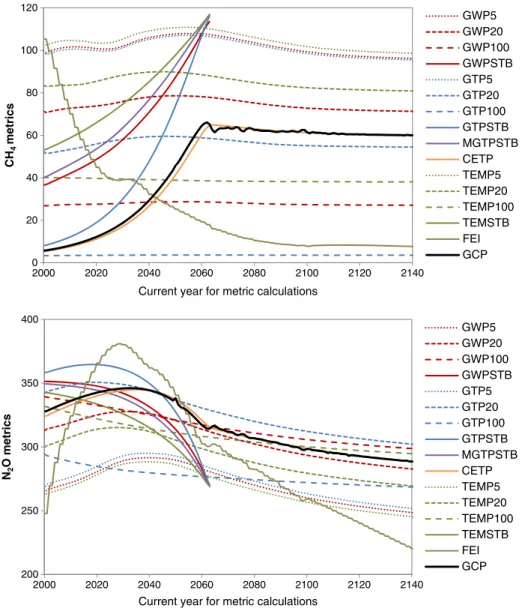
3 Results and discussion
A first impression through visual inspection of metric values for CH
4and N
2O
(Fig.
1
) is: a metric can take a wide range of values toward the 2 °C target,
depending on the choices of the metric structure and the time horizon. This result
shows that the attempts to improve metrics by proposing alternatives to the GWP
resulted in divergent metric values, which becomes apparent when metrics are
numer-ically compared in the context of the 2 °C target. These results do not indicate that
any particular metric is invalid, nor that uncertainty in the representation of the
climate system is large. Rather, the difference in the metric values reflects the fact
that each metric is designed to represent different aspects of the climate and
socio-economic system and treats the time dimension differently. Earlier studies (Johansson
2012
; Reisinger et al.
2011
; Shine et al.
2007
) demonstrate what would correspond to
some parts of Fig.
1
. Our study is a first attempt to synthesize various ideas involving
the metric structure and the time horizon in the stabilization context within a single
modeling framework.
0 20 40 60 80 100 120 2000 2020 2040 2060 2080 2100 2120 2140 CH 4 metricsCurrent year for metric calculations
GWP5 GWP20 GWP100 GWPSTB GTP5 GTP20 GTP100 GTPSTB MGTPSTB CETP TEMP5 TEMP20 TEMP100 TEMSTB FEI GCP 200 250 300 350 400 2000 2020 2040 2060 2080 2100 2120 2140 N2 O metrics
Current year for metric calculations
GWP5 GWP20 GWP100 GWPSTB GTP5 GTP20 GTP100 GTPSTB MGTPSTB CETP TEMP5 TEMP20 TEMP100 TEMSTB FEI GCP
Fig. 1 Behaviors of emission metrics of CH4(top) and N2O (bottom) under a 2 °C stabilization pathway. In
the legend, each line is designated by the name of the emission metric (Table1) and the treatment of the time horizon (Table 2). 5, 20, and 100 indicate the use of a constant time horizon of 5, 20, and 100 years, respectively. STB indicates the use of a time-dependent time horizon that shrinks toward the stabilization year (2064)
Furthermore, examinations of the behaviors of individual metrics offer the following
insights:
& The CETP closely reproduces the price ratio both before and after the stabilization year
(Johansson
2012
) as it is designed to do. If the metric should reflect the price ratios that
generate the most cost-effective path, the CETP serves the best for this aim among other
metrics.
& Metrics using a time-dependent time horizon toward the stabilization year show
direc-tions of changes that are largely consistent with the price ratio—namely, a rising trend in
the case of CH
4and also a rising trend initially but followed by a falling trend in the case
of N
2O (Manne and Richels
2001
; Shine et al.
2007
).
2However, the levels of these
metrics are substantially different from each other.
& The value of the GWP with the 100-year time horizon varies slightly over the
stabili-zation time period, which is caused by the changes in the background concentrations
leading to changes in the radiative efficiencies and atmospheric perturbation times
(Reisinger et al.
2011
). These (together with model revisions) explain the past minor
revisions of the GWP values in the IPCC assessment reports (IPCC
2001
,
2007
; Joos et
al.
2012
). Note that these updates in the GWP values in the IPCC assessment reports are
not reflected in the GWP values used in the Kyoto Protocol (which are taken from the
IPCC Second Assessment Report).
& Values of the GWP, GTP, MGTP, and TEMP converge with a shorter time horizon.
The MGTP is numerically similar to the GWP (Azar and Johansson
2012
; Peters et
al.
2011
).
& Metrics with a constant time horizon do not change significantly relative to those with a
time-dependent time horizon. This indicates that a change in the time horizon affects
metric values more strongly than changes in background concentrations.
& The FEI, unlike other metrics, decreases over time before the stabilization year in the
case of CH
4(Manning and Reisinger
2011
; Wigley
1998
). The opposite trend of the CH
4FEI may be related to the distinct way in which the FEI is computed (Table
1
).
& The TEMP, which is designed to capture the temperature consequence of emissions, is
inconsistent with the CETP, which is constructed to reproduce the price ratio. This serves
as an example to suggest a need to choose a metric suitable for a specific purpose.
4 Concluding remarks
Our study demonstrates the diversity of metric values in the context of the 2 °C climate
stabilization
—metric values are sensitive to the metric structure (Table
1
) and the time
horizon (Table
2
). The diversity of the metrics (Fig.
1
) may reflect the complexity of
the task at hand to represent the behavior of the climate and socio-economic system
through a simple metric. A sensitivity analysis carried out for 3 °C and 4 °C targets
does not change the nature of our conclusions (Figures
S2
and
S3
in
Supplementary
Material
). However, our main finding clearly indicates a need for research to provide a
set of well-designed metrics that support the societal aim of achieving a climate
stabilization target. In particular, on the basis of Aaheim et al. (
2006
), Johansson et
2
The trend of the CH4metrics is predominantly due to the effect of the shortening time horizon. In the case of
N2O, it is a combined effect of several factors including the shortening time horizon, background
al. (
2006
), O’Neill (
2003
), Reisinger et al. (
2012
) and Smith et al. (
2012
), further research is
required on the economic aspects of choosing metrics by applying the metric values
within the same stabilization framework and calculating differences in costs (also emissions and
temperature outcomes).
In the context of emission metrics, the boundary between science (including economics)
and policy is not just intimately close but overlapping. On one hand, the choice of metric for
climate agreements and policy making is contingent on political decisions on policy targets
(Berntsen et al.
2010
) and the principles on which the target should be met (e.g.,
cost-effectiveness (Tol et al.
2012
)). On the other hand, even given such decisions from the policy
arena, the science does not indicate a single best metric. Rather, it offers a set of possible
metrics as exemplified by Fig.
1
. Not all the elements considered in the design of metrics are
purely scientific, and a clear separation between scientific and policy-relevant elements is
not possible (Tanaka et al.
2010
). This situation implies a need for dialogue among scientists,
policymakers, and practitioners to improve the joint understanding of the complexity of
issues behind metrics and to move from arbitrary choices to informed consent on a metric
that serves the goals of climate policies.
Acknowledgments This study was presented at the Sixth International Symposium on Non-CO2Greenhouse
Gases (NCGG-6), Amsterdam, The Netherlands. November 2–4, 2011. This project is supported by Norwe-gian Research Council under the project“Climate feedback uncertainty and its policy implications (ClimUP)” (Project number: 203807). K. Tanaka is funded by a Marie Curie Intra-European Fellowship within the 7th European Community Framework Programme (Proposal N° 255568 under FP7-PEOPLE-2009-IEF). Con-tributions by J. S. Fuglestvedt are supported by Norwegian Research Council under the project“Climate and health impacts of Short-Lived Atmospheric Components (SLAC)” (Project number: 208277). Contributions by D. J. A. Johansson are supported by the Swedish Energy Agency.
References
Aaheim A, Fuglestvedt JS, Godal O (2006) Costs savings of a flexible multi-gas climate policy. Energy J, 27 (S13):485–502
Azar C, Johansson DJA (2012) On the relationship between metrics to compare greenhouse gases—the case of IGTP, GWP and SGTP. Earth Syst Dynam Discuss 3:113–141
Berntsen T, Tanaka K, Fuglestvedt J (2010) Does black carbon abatement hamper CO2abatement? Clim
Chang 103:627–633
Fankhauser S (1994) The social costs of greenhouse gas emissions: an expected value approach. Energy J 15:157–184 Fuglestvedt JS, Berntsen TK, Godal O, Sausen R, Shine KP, Skodvin T (2003) Metrics of climate change:
assessing radiative forcing and emission indices. Clim Chang 58:267–331
Fuglestvedt JS, Shine KP, Berntsen T, Cook J, Lee DS, Stenke A, Skeie RB, Velders GJM, Waitz IA (2010) Transport impacts on atmosphere and climate: Metrics. Atmos Environ 44:4648–4677
Gillett NP, Matthews HD (2010) Accounting for carbon cycle feedbacks in a comparison of the global warming effects of greenhouse gases. Environ Res Lett 5:034011
IPCC (2001) Climate Change 2001: The Scientific Basis. In: Houghton JT, Ding Y, Griggs DJ, Noguer M, van der Linden PJ, Dai X, Maskell K, Johnson CA (eds) Contribution of Working Group I to the Third Assessment Report of the Intergovernmental Panel on Climate Change, Cambridge University Press, Cambridge, United Kingdom and New York, NY, USA, p 881
IPCC (2007) Climate Change 2007: The Physical Science Basis. In: Solomon S, Qin D, Manning M, Chen Z, Marquis M, Averyt KB, Tignor M, Miller HL (eds) Contribution of Working Group I to the Fourth Assessment Report of the Intergovernmental Panel on Climate Change, Cambridge University Press, Cambridge, United Kingdom and New York, NY, USA, p 996
IPCC (2009) IPCC Expert Meeting on the Science of Alternative Metrics: Meeting Report. In: Plattner G-K, Stocker T, Midgley P, Tignor M (eds) IPCC Working Group I Technical Support Unit, University of Bern, Bern, Switzerland, p 75
Johansson D (2011) Temperature stabilization, ocean heat uptake and radiative forcing overshoot profiles. Clim Chang 108:107–134
Johansson D (2012) Economics- and physical-based metrics for comparing greenhouse gases. Clim Chang 110:123–141
Johansson D, Persson U, Azar C (2006) The cost of using Global Warming potentials: analysing the trade off between CO2, CH4and N2O. Clim Chang 77:291–309
Joos F, Roth R, Fuglestvedt JS, Peters GP, Enting IG, von Bloh W, Brovkin V, Burke EJ, Eby M, Edwards NR, Friedrich T, Frölicher TL, Halloran PR, Holden PB, Jones C, Kleinen T, Mackenzie FT, Matsumoto K, Meinshausen M, Plattner G-K, Reisinger A, Segschneider J, Shaffer G, Steinacher M, Strassmann K, Tanaka K, Timmermann A, Weaver AJ (2012) Carbon dioxide and climate impulse response functions for the computation of greenhouse gas metrics: a multi-model analysis. Atmos Chem Phys Discuss 12:19799–19869 Lashof DA, Ahuja DR (1990) Relative contributions of greenhouse gas emissions to Global Warming. Nature
344:529–531
Manne AS, Richels RG (2001) An alternative approach to establishing trade-offs among greenhouse gases. Nature 410:675–677
Manning M, Reisinger A (2011) Broader perspectives for comparing different greenhouse gases. Phil Trans R Soc A 369:1891–1905
Marten AL, Newbold SC (2012) Estimating the social cost of non-CO2 GHG emissions: Methane and nitrous oxide. Energy Policy 51:957–972
Meinshausen M, Meinshausen N, Hare W, Raper SCB, Frieler K, Knutti R, Frame DJ, Allen MR (2009) Greenhouse-gas emission targets for limiting global warming to 2 °C. Nature 458:1158–1162 O’Neill BC (2000) The Jury is still out on Global Warming potentials. Clim Chang 44:427–443
O’Neill BC (2003) Economics, natural science, and the costs of Global Warming potentials. Clim Chang 58:251–260 Peters GP, Aamaas B, Lund MT, Solli C, Fuglestvedt JS (2011) Alternative“global warming” metrics in life
cycle assessment: a case study with existing transportation data. Environ Sci Technol 45:8633–8641 Reisinger A, Meinshausen M, Manning M (2011) Future changes in global warming potentials under
representative concentration pathways. Environ Res Lett 6:024020
Reisinger A, Havlik P, Riahi K, Vliet O, Obersteiner M, Herrero M (2012) Implications of alternative metrics for global mitigation costs and greenhouse gas emissions from agriculture. Clim Chang, 1–14. doi:10.1007/ s10584-012-0593-3
Riahi K, Grübler A, Nakicenovic N (2007) Scenarios of long-term socio-economic and environmental development under climate stabilization. Technol Forecast SocChang 74:887–935
Rogelj J, Hare W, Lowe J, van Vuuren DP, Riahi K, Matthews B, Hanaoka T, Jiang K, Meinshausen M (2011) Emission pathways consistent with a 2 °C global temperature limit. Nature Clim Change 1:413–418 Shine K (2009) The global warming potential—the need for an interdisciplinary retrial. Clim Chang 96:467–472 Shine KP, Fuglestvedt JS, Hailemariam K, Stuber N (2005) Alternatives to the Global Warming Potential for
comparing climate impacts of emissions of greenhouse gases. Clim Chang 68:281–302
Shine KP, Berntsen TK, Fuglestvedt JS, Skeie RB, Stuber N (2007) Comparing the climate effect of emissions of short- and long-lived climate agents. Phil Trans R Soc A 365:1903–1914
Smith SJ, Wigley ML (2000) Global Warming potentials: 1. Climatic implications of emissions reductions. Clim Chang 44:445–457
Smith S, Karas J, Edmonds J, Eom J, Mizrahi A (2012) Sensitivity of multi-gas climate policy to emission metrics. Clim Chang, 1–13. doi:10.1007/s10584-012-0565-7
Tanaka K, Kriegler E, Bruckner T, Hooss G, Knorr W, Raddatz T (2007) Aggregated Carbon Cycle, Atmospheric Chemistry, and Climate Model (ACC2)– description of the forward and inverse modes, Reports on Earth System Science. Max Planck Institute for Meteorology, Hamburg, p. 188.http:// pubman.mpdl.mpg.de/pubman/item/escidoc:994422:1
Tanaka K, O’Neill BC, Rokityanskiy D, Obersteiner M, Tol R (2009a) Evaluating Global Warming potentials with historical temperature. Clim Chang 96:443–466
Tanaka K, Raddatz T, O’Neill BC, Reick CH (2009b) Insufficient forcing uncertainty underestimates the risk of high climate sensitivity. Geophys Res Lett 36:L16709
Tanaka K, Peters GP, Fuglestvedt JS (2010) Policy Update: multicomponent climate policy: why do emission metrics matter? Carbon Manag 1:191–197
Tol RSJ, Berntsen TK, O’Neill BC, Fuglestvedt JS, Shine KP (2012) A unifying framework for metrics for aggregating the climate effect of different emissions. Environ Res Lett 7:044006
UNFCCC (2012) Report on the workshop on common metrics to calculate the carbon dioxide equivalence of greenhouse gases. UNFCCC, Bonn, Germany, p 14