HD28 .M414 no.
91
gevEv
- -.t5-« -..::9'WORKING
PAPER
ALFRED
P.SLOAN
SCHOOL
OF
MANAGEMENT
Development
of
Tools
toRepresent Design Procedures
David
A.Gebala
Steven D. Eppinger Daniel E.Whitney
WP#
3281-91-MS
April 1991MASSACHUSETTS
INSTITUTE
OF
TECHNOLOGY
50MEMORIAL
DRIVE
CAMBRIDGE,
MASSACHUSETTS
02139Development
of
Tools
toRepresent Design
Procedures
David
A.Gebala
Steven D. Eppinger
Daniel E.
Whitney
Development
of
Tools
to
Represent Design Procedures
David
A.Gebala
Steven D. Eppinger
Daniel E.
Whitney
Massachussetts Institute ofTechnology Cambridge,
MA
02139
Abstract
This paper is based
upon
the premise that in practice, designprocedures are rather methodical
and
can therefore be studiedand
improved.
We
present model-based approachestoward
understanding such design activities in order toimprove
design practices. Severalmodeling
methodologies are presentedand compared on
their ability tocapture relevant information about design activities
and
their ability toprovide insight into the performance ofdesign processes.
A
detailed description of these modelsand examples
of each are provided forcomparison.
These
models contribute significantly to our understanding of current design practiceand
yield to analytical toolswhich
facilitateformulation
and
implementation ofimproved
procedures. In the course of the discussion, limitations of the currently usedmodels
are identified,and
an enhanced
representation is proposed toovercome
these limitations.Introduction
International competition has heightened the need to develop high
quality products
which
can compete in the global marketplace.As
a result ofthis increased competition, the pace ofproductdevelopment
hasquickened, forcing manufacturers into
an
era inwhich
continuous qualityimprovement
is a matter of survival, not simply competitive advantage.As
the time scale ofthe product life cycle decreasesand
thedemand
for quality increases, one area ofattention has been improving products through better designs.The
integrativeand
definitive nature ofthe design activityisresponsible for determining as
much
as80%
of a product's functionalityand
cost [4].The
high leverage available during the design activity can completely determine a product's success or failure. Design's central roleas
an
important engineeringand
business concern has recently gainedattention in
companies
and
universitiesaround
the world.In the past,
many
researchersmay
have
dismissed design because itlacks the scientific rigor of
some
other disciplines.However,
asacademia
and
industry investmore
effort into improving the design process, there isan
increasedneed
for a better understanding ofthe activity to facilitate the formulation ofnew
design paradigms.We
believe that whilemost
design2
activities performed in industry are well established,they are, nevertheless, poorly understood.
We
seekimproved
understanding ofbothnew
and
established designprocedures to provide at least two distinct opportunities: (1) to allow
engineers to execute the design activity with
more
insight into difficulties encountered during design,and
(2) to providean
opportunity for bettermanagement
ofthe design activity, including implementation ofnew
design strategies. Specifically, this
work
addresses design processimprovement
questionswhich
engineersand
theirmanagers
should be asking:1)
Why
does it take so long to develop eachnew
generation ofour product?2) Wh'-^h engineering functions might be
combined
to acceleratedesign progress?
3)
Where
iscommunication most
important in design?4)
What
are the driving factors in our designproblem?
5)
How
canwe
implement
concurrent engineering?The
approach in thiswork
is to facilitate theimprovement
ofproductdesign procedures through formulating
and
testingmodels
of the designactivity.
Models
are constructed by first observing the design processand
formulating representations
which
capture the aspects consideredimportant.
A
model
serves its purpose ifit is able toanswer
importantquestions about the subject it represents. Ifthe model's behavior reflects
the system's behavior, the
model
can be used insome
predictive capacity toexplore the effects
which
altering the system can produce. Iftherepresentation is not able to
answer
such questions, anothermodel
must
be formulatedand
tested.The
models sui'veyed below will be judged on theirability to accurately represent design activities
and
their ability to facilitateexploration of
new
design strategies.In choosing a
model
ofthe design process, it is important to keepsome
objectives in mind.Winston
proposes several requirementswhich
problem
representations should attempt to satisfy [24].Good
representations
•make
the important things explicit;•expose natural constraints, facilitating computations;
•are complete; •are concise;
•are transparent to its users;
and
These
criteria can serve as guidelines for representationswhich
canadvance
our undei'standing ofthecomplex
activitieswhich
are collectivelyknown
as design.The
first section ofthis paper presents three models of the design activitycommonly
used in practice.We
review the historicaldevelopment
ofthe
Program
Evaluationand Review
Technique (PERT), StructuredAnalysis
and
DesignTechnique
(SADT
or IDEF),and
the use ofDesignStructure Matrices
(DSM).
We
also presentexamples
of their use in designmodeling
and
surveythem
critically to identifyany
shortcomings. In particular,we
examine
their ability to reveal the difficult iterationsencountered in execution ofthe design activity.
In the following section,
we
compare
the representational capacity of thetwo
techniques best able to capture the iterative flow ofdesigninformation.
Using
precedence data describing the design ofan
automotive component, alternate representations of a design processwere
constructed.We
then use the precedence matrices tomodel
several other designactivities,
and
to provide valuable insight intohow
information flowsduring these design procedures.
We
close the section withan
overview of analysis toolswhich
are able to suggestimproved
design procedures.Finally,
we
will address the issueswhich
the representations are not able to model.Our
work
in modelingand
analyzing design has identifiedimportant aspects ofthe design process
which
are not incorporated intoany
ofthe present models. For example, the existing models only represent interdependence, but do not specify the extent ofinterdependence.
A
possible solution is proposed to incorporate
much
more
information into themodels to
enhance
their utility.One
type ofquantitativemodel
based on theExisting
Representations
As
the importance of product design inmanufacturing
competitionbecomes
widely recognized, the need to understandand improve
the designactivities also
becomes
evident.The
first attempts tomodel
and answer
questions about design procedures used simple project planning techniques
(PERT)
which
had
proven useful in the schedulingand
management
of large researchand development
projects.However,
these simple tool did not contribute to understanding design iteration because they failed torepresent such flows. This need to represent iteration explicitly
was
met
by
techniques such as
SADT.
Finally,we
have
found that precedencematrices such as
DSM
allowcomplex
interactions to beshown more
easily.These
threemost
commonly
used representations are discussed below.1.
Program
Evaluationand
Review
Technique
The Program
Evaluationand Review
Technique(PERT)
is one ofthemost
widely used projectmanagement
tools.PERT
was
developed in thelate 1950's to plan
and
manage
thedevelopment
ofthe Polaris missile [23].A
project is represented as a series ofactivities, each with a set of predecessorswhose
results are required before thenew
activity can bestarted.
The
PERT
chartwhich documents
the project is anetwork
ofnodesinterconnected by arcs.
Although
there issome
flexibility in defining thenodes
and
arcs, it ismost
common
to associate one activity with each nodeand
to denote precedence using a directed arcbetween
nodes.To
add
thetime to the
PERT
chart,we
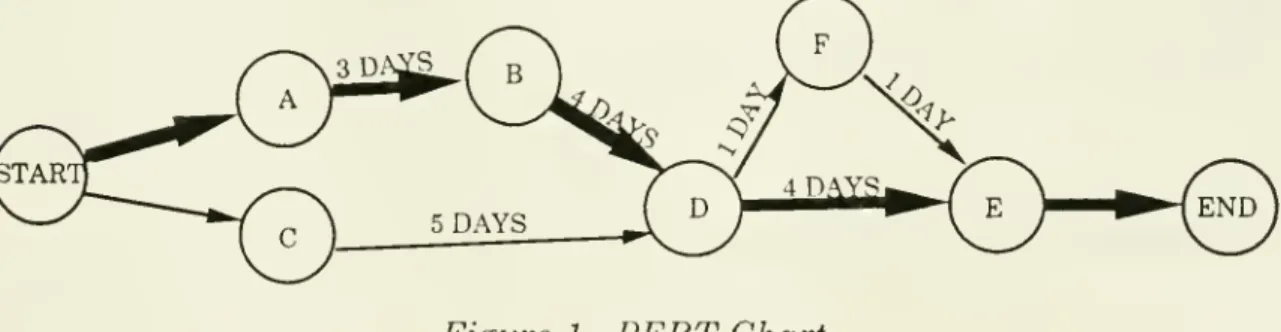
ca label the arcs with the task durations.Uncertainties in these time estimates can be considered in the calculation ofthe overall project completion time.
An
example
ofaPERT
chart withdeterministic time estimates is presented in Figure 1.
Figure 1.
PERT
ChartIfthe time required for each of the activities has a small variability,
the
PERT
chart can be subjected directly to CriticalPath
Method
(CPM)
analysis.CPM
allows themanager
to identifywhich
activities affect thecompletion date (activities on the critical path)
and which
activities are irrelevant to accelerating project completion (activities with slack).By
analyzing the critical path, the
manager
can perform cost vs. time trade-off analysis [12].The
cost ofapplyingmore
resources toan
activity can beevaluated by the effect on the project completion date.
The
critical path isthe one
marked
byheavy
arcs in Figure 1.The
PERT
methodology is well suited for certain processeswhich
involve sequential flows of well characterized steps. For example,
PERT
isa popular planning tool for construction
and assembly
operationswhich
typically involve little flexibility in their precedence relations. In order to
make
a particular subassembly, one needs all ofits components.The
strong
dependency which
is found in the assemblyand
constructionactivities is easily represented by the series of arcs
and
nodes in aPERT
chart.PERT
chartshave
also found widespread application in large scaleresearch
and development
projects requiring coordination ofnumerous
activities. Again, the projects flow sequentially: before a certain task is
activated, the previous task
must
be completed.The
success of this technique in thedevelopment
ofthe Polaris missileprompted
the U.S.Government
to require its use on all majorgovernment
projects [23].Using
PERT
tomodel
the design activityseems
to be a logical choice since design,too, is a large project requiring coordination of
many
effortsand
many
different activities.
Using
PERT
toModel
Design
ActivitiesUsing
PERT
charts tomodel
the design processseems
astraightforward application ofthis technique.
The
design activitymust
bedecomposed
into smaller activitiesand
their precedences noted.The
duration ofeach activity can be used toenhance
the chart's informationcontent.
However,
the technique is not able to capture the complexities of the design activity;PERT
is limited by the implicit requirement that allactivities are sequentially dependent.
Once an
activity hasbeen
performed,it is not performed again. In a
PERT
chart, suchan
occurrencewould
create a cycle in the path.
Such
cycles in thePERT
chart represent logicalinconsistencies
which
must
beremoved
beforeany
criticalpath
calculations can be
made.
In practice design is often
an
iterative activity. Design tasksmay
nothave
strict startand
stop dates. Rather, a design decisionmade
downstream
ofan
activitymay
force thisupstream
activity to bere-activated.
The
iterative nature of the design process alsomeans
thatincomplete information
may
be used to performan
activitywhich
will be performed againwhen
more
complete informationbecomes
available.These
cycles arecommon
inmost
design activitiesand
should not be ignored in our models. In fact, it is this iteration using incompleteinformation
which
presents the challenge in design. Ifwe
choose to"force-fit" the design process into the
PERT
representation,we
are forced to ignorethese cycles,
and
instead ofmaking
the important things explicit,we
have
simplified design into a trivial sequence of straightforward activities.
Clearly,
any
useful representationmust
be able to represent cycles in thedesign process explicitly.
2.StructiiredAnalysis
and
Design
Technique
Another
popular techniquewhich
is used extensively in practice isthe Structured Analysis
and
DesignTechnique
(SADT). Thismethod
is a graphicalmeans
of describing large systems ofinteracting units.SADT
shares
some
common
background
withPERT.
Both were
motivatedby
theneed
to coordinate a largenumber
ofactivitieswhich
may
occur at differenttimes
and
at different locations.The
derivative ofSADT
which
is widelyused today is one
promoted
by the U.S. Air Force in the early 1970's inan
attempt to standardize
manufacturing
process descriptions acrossmany
different aerospace contractors [13].The
IntegratedComputer-Aided
Manufacturing
DefinitionMethod
(IDEFO)
isan
automated, graphicaladaptation of
SADT
aimed
at standardizing contractorcommunications
and
reviews [17].The
SADT/IDEFO
technique is based on a basic unit, the StructuredAnalysis (SA) box,
and
afundamental
descriptive languagewhich
dictateshow
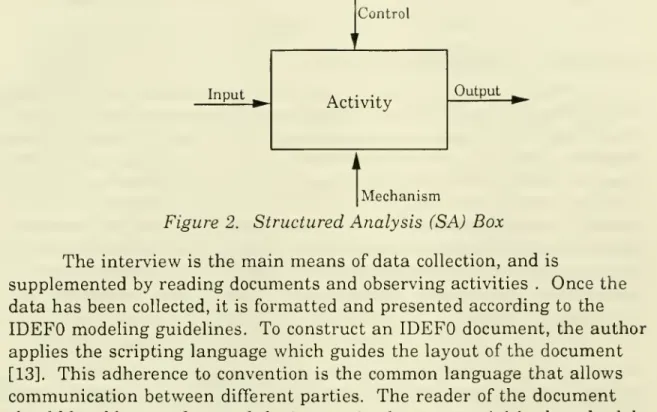
these boxes can be interrelated [16]. Figure 2 presents theSA
building block oftheIDEFO
models.Each
box in themodel
representsan
activity.An
activity is defined asan
act which,under
control, transforms input intooutput using a
mechanism.
Each
box canhave
any
number
ofarrowsleading into
and
out ofit, following the convention pictured.Arrows
directed into the box
from
the right represent input.Arrows
directed out of the box represent output.The
arrows entering the top of the activity boxrepresent control.
Those
entering from thebottom
representmechanisms
used, but notchanged
during the activity.Any
SA
boxmay
be acomponent
ofanother, higher-levelSA
box,and
may
itselfbe decomposable intomore
component
boxes.The
approach is tomodel
from the topdown,
specifying asmuch
detail,and
creating asmuch
depth as necessary to completelyControl
Input
Mechanism
Figure 2. Structured Analysis (SA)
Box
The
interview is themain
means
ofdata collection,and
issupplemented
by readingdocuments
and
observing activities .Once
thedata has
been
collected, it is formattedand
presented according to theIDEFO
modeling guidelines.To
constructan
IDEFO
document, the authorapplies the scripting language
which
guides the layout ofthedocument
[13]. This adherence to convention is the
common
language that allowscommunication between
different parties.The
reader of thedocument
should be able to understand the interaction
between
activities based solely on the graphical contentand
SA
labels (although textdocuments
can beadded
for clarification).An
example
ofan
IDEFO
document
is presented in8
Necessary modifications are
made
and
the cycle proceeds through anumber
of iterations before amodel
is approved.Using
SADT
toModel
Design
ActivitiesModels
ofnumerous
design procedureshave been
constructed usingthe
IDEFO
technique.To
do so, the design activity tobemodeled
ishierarchically
decomposed
and documented
on asmany
different levels as required.There
is a strict limit to theamount
ofinformation that can beplaced on each page ofthe
IDEFO
document. This restriction isan
attempt to limit the degree ofcomplexitywhich
the reader ofthedocument
isexposed to at
any
one time.The
documents
themselves consist ofmultiple sheets, with each pagedocumenting
all the inputs, outputs, controlsand
mechanisms
which
affect a particular set ofactivities.Note
that these interrelations are often notfrom
boxes at thesame
level ofdecompositionand
are not necessarily on thesame
sheet oftheIDEFO
document.Most
largemanufacturing
firmswe
know
of, including Boeing,General Motors,
Kodak
and
Motorola, have used theIDEFO
softwareand
methodology
to create models of existing design procedures. Often the tasksto be
modeled
areenormous and
must
bedecomposed
into functional areas.Each
area ismade
responsible for collecting informationand
creating a validIDEFO
document
which
can be used to study its existing design practice.At
General Motors,the complete processmodel
for automobile designis still being constructed, but
some
parts have been completed.The
resulting
documents
representhuge
investments in resources,and
are rich in information; however, in practice, the size ofthesedocuments
has proven to be one ofthemost
significant drawbacks.Because
the software does not perform it automatically, verification ofinterrelationsbetween
activities requires
much
effort tracing arrowsbackwards
and
forwards through multiple levels of decomposition.Because
the overall design activity is largeand
complex, thedocuments
themselvesbecome
a tanglednetwork which
is laborious to read.The
IDEFO
procedure is indeed able to capture thecomplex
requirements ofthe design process, but the result does not lend insight into the design process. This representation ofthe design activity serves as a
documentation
ofthe design process, but because ofits complexityand
unwieldy size, it is not particularly good at suggesting
improvements.
The
IDEFO
document
does not facilitate computation nor does itmake
difficulties explicit. This shortcoming renders it inadequate for
improving
the design process.
A
usefulmodel
must
be able toanswer
questions with3.
Matrix
RepresentationsBeginning
in the 1960's,some
researchershave
used matrixrepresentations in place ofgraphs to display systems ofequations
and
precedences. Adjacency matrices are square matrices
whose
elements, aij,are unity if
nodej
is a precedent ofnode i,and
blank otherwise [22].The
matrix is easily constructed from the
network diagrams
or directlyfrom
precedence information.
The
size ofthe matrixdepends upon
thenumber
ofactivities or tasks intowhich
the system is broken.The
number
ofnon-blank elements reflects the
number
ofprecedences in the system. Figure 4 depicts a typical adjacency matrix.One
would
read the precedencerelations
from
the matrix by reading across therows
ofthe matrix. For example, in Figure 4,Task
D
isdependent
upon
inputfrom
Tasks
A
and
E.The
name,
adjacency matrix, reflects the fact that the non-blank elementsidentify
which
nodes are adjacent (connected) to each other [8].No
speciallanguage is required to construct the matrix,
and
the results are easilyunderstood by both the creator
and
the user.ABCDEFGH
IJKL
Figure 4. Adjacency Matrix
The
matrix representation hasbeen
used tomodel
many
different processesand
systems.Mathematicians have
used this matrixform
tosolve simultaneous equations [11, 22].
Chemical
engineershave
used the matrix representation tomodel
process flow sheets [9]. Engineershave
documented
the interdependence toexamine
themost
efficient order inwhich
to determine system parameters [2, 3, 15, 20].Using Precedence
Matrices toModel
Design
ActivitiesIn a similar
manner,
matrix representationshave been
used to10
information used in the other techniques is collected for each
component
task. If one interprets the task ordering as a time sequence, the timing of
information flow
becomes
explicit:marks
below the diagonal represent information transferred to later tasks;marks
above the diagonal depict information fed back to earlier tasks.The
matrixembodies
the structure of the underlying design activity bymapping
the relationsbetween
tasks in a precise orderwhich
makes
interdependence explicit.Steward
refers to amatrix
model
ofdesign activities as a Design Structure Matrix(DSM)
[20]. This representation hasbeen
used in anumber
ofdesign projects tosuccessfully
map
dependenciesbetween
functional areas of the design endeavor.The work
doneby
Black exposes, on aparameter
level, theinformation requirements ofbrake system design [2]. This
work
allows thedesigners to see the entire design activity from a global perspective.
The
order inwhich parameters
are determined canhave
a significant effecton
the execution ofthe design
and
these features are revealed in the matrix.The
details ofthiswork
are presented in the next section.Most
recentlywe
have
used the matrix representation as amanagement
aid to analyze the organizational structure of design projectsusin? the individual information requirements ofthe engineering tasks [6,
19].
As an
aid to better designmanagement,
we
have
used the matrix toidentify tasks
which
are constrained to be serialby
nature oftheinformation flow connecting them. Conversely, the matrix also allows quick identification of tasks
which
can be performed in parallel. Thisrepresentation has proven useful in studying the changes required in the
implementation of concurrent engineering strategies [5].
These
results are11
Comparison
of
Representations
To compare
the design models constructed by the different techniques,we
modeled
design activities using theIDEFO
and
matrixmethods
presented above.We
found that theIDEFO
methodology
has beenapplied extensively to represent the design
and manufacturing
activities atGeneral Motors.
The C4
program
atGM
hasformed
Lead
Groups which
are responsible for
documenting
the design procedures for each ofthe sevenmajor
functional areas ofthe automobile: 1) Powertrain, 2) Chassis, 3) Electrical, 4) Body-in-White, 5) Paint, 6)Assembly and
7) Interior.The aim
of this endeavor is to understand the design
and
production activities asthey are currently performed
and
to then suggestimprovements
for futureperformance.
The
precedence information gathered while studyingand
documenting
the production of thesecomponents
is valuable informationwhich
could, if representedand
analyzed correctly, aid in improvingand
accelerating the design activity.
At
present, all ofthis precedenceinformation for the activities is contained in
IDEFO
charts.These
charts are constructed by authorswho
interview engineers in the organizations, are reviewed for completenessand
validity,and
are eventually approved asan
accurate representation of the current design practice at General Motors.These
IDEFO
models are largeand
complex, reflecting the processes they model.However,
the large size ofthe models is a disadvantage ofthe representation.The
sizeand
complexity of thedocuments
are barriers totheir use in facilitating
improvements
of the processes they represent.Although
the description is complete, it is not conciseenough
to serve as a beneficial overview tool. This representation fails to suppressesenough
detail to render it transparent to users.
The
vastamount
ofinformationpresented only one
page
at a time provides only limited glimpses into the global interactions of designand manufacturing which
are often crucial.The
same
precedence data used in theIDEFO
charts can bemapped
into the matrix format
and compared
to theSA
box notation. Figure 5 is a12 format.
13 detailed
down
to theparameter
level to includemeasurable
quantities suchas pressure, diameter,
and
torque.The
model
was
constructedand
verified in the matrix form pictured in Figure 6A.Notice that the design task is decomposable into three distinct phases.
The
information flow in the early design stage is a mixture of sequentialand
parallel activities. In the second phase ofthe designactivity, the information flow
becomes
iterative as representedby
the large block oftaskswhich
are coupled. Following this block is final group of sequentialand
parallel tasks.The
decisionswhich
are resolved iteratively in the middle ofthe design process are presented in Figure 6B.These
tasks could be analyzed in further detail using themethods
described in [7, 20].Some
ofthesewere
performedand
the results are reported in [2, 21].Certain aspects ofthis
model
should be noted.The
information flowduring certain stages of design is critical while during
much
of the activity,itis a simple sequence.
The
coupled block of iterative information flow in the middle of the design matrix iswhat
we
consider the challenge ofthe design activity.We
expect that all but themost
trivial design activities willhave
some
degree ofiteration.We
investigate belowwhether
this overall structure iscommon
to other design activities.14
'^-15
Knuckleenvelope&attach pis33 PressureatrearwheellocKup 34
Brake lorquevs. skidpoint35
Drum malerial36
Line pressurevs.brake lorque 37
DnjmmaleriaJ
—
composiie/cast 38Drum—thermalaspecis39
Splashshieldgeometry
—
Ironi40 Bearing—
rear—
heatinio 4iBearing—(ronl
—
heatinIo 42Dnjmbrakesize 43
Drumerrvelope&attach pts 44
Bearingenvelope&attach pis45 Splashshieldgeometry
—
rear 46ABSsensorlocation47 Airflowunder car/wheelspace 48
Wheelmaterial 49
Wheeldesign 50
Tirelype/material 51
Vehicle decelerationrate 52
Temperatureatcomponents 53
Rotor cooling coedcient 54 Lining
—
rear volandarea 55Floiorwidth 56 Pedalanachpts57
Dashdeflection58
Pedalforce (required) 59 LiningcoeMicient
—
rear60 Pedalmechanicaladvantage 6i Lining—
(rontvol&swept area 62Lining coellicient—front 63 Boosterreactionratio 64 Rotordiameter 65 Rotorenvelope&attach pts66
16
IS 18W ! liTO ?' 77?3 ?* 25?* 37 JKfl 30 3i3! 33 3*3* n 37 int Conceptual. Crankshaft
-Supervise Shaft Des. ;
RanforDesign i
PerforrnDesign Process *
DetailPans &
CheckDetail •
Plan Analysism
Transform2Ddatato3D j
TranslaleData i
BuiW3DFEMModel
SolveStress, Deflec.. Vib. >o
Display Results " EvaluatearidReport >;
ModifyDesignu
Est.Process Sequence -*
Coordinate Engine Builds <&
CoordinatewithSources n
Eval.PurchaseReq's t?
ObtainVendorQuotes n
EvaJ.andSelectVendors <9
IssuePurchase Order jo
EstimateCostartdTiming r^
ReviewInformation j?
EstablishSequence 23
SelectMachines 2*
kJent.Supp. Resourcesi&
EvaluateProcessSheet 2*
Develop Schedules7'
OrderResources 21
Prep.Supp. Resources7s
Set-upMachine 30
ExecuteOperation31
InspectPrototypeCrank w TestPrototypeCrank33
Re!.CrankshdlDesign 3*
Anal,andConcept. Proc.as
DesignProcess sa
ValidateProcess 37
Release Process3i
Prep.ToolsandEquip.39
PrepareFacility*o
SetupProd.Resources*>
Venfy Prod.Resources*?
ProduceCrankshafto X 1 1 1 X c 1 C X 1 X 1 1 1 1 X 1 C 1 X
xccccccc
1 C X 1CIX
1CIX
1 C 1 X C 1 X C 1 1 X 1 1 c 1 ex17
design for manufacturing.
The
implications ofthis structureand
the strategies formanaging them
are discussed in detail in [5],and
aresummarized
at theend
ofthis section.Camshaft
Design
In a final exercise, complete design
and
production activities for camshaftdevelopment
were
documented
down
to similar levels of detail.The
previousmodel
for the crankshaft included only the designcomponents
ofthe process,
whereas
thismodel expands
the steps both beforeand
after design. This camshaft matrixwas
constructed from theIDEFO
charts exactly as described previously for the crankshaft model. In thismore
complete model, it
was
possible tomake
many
more
observationsand
comments
regarding the representationand
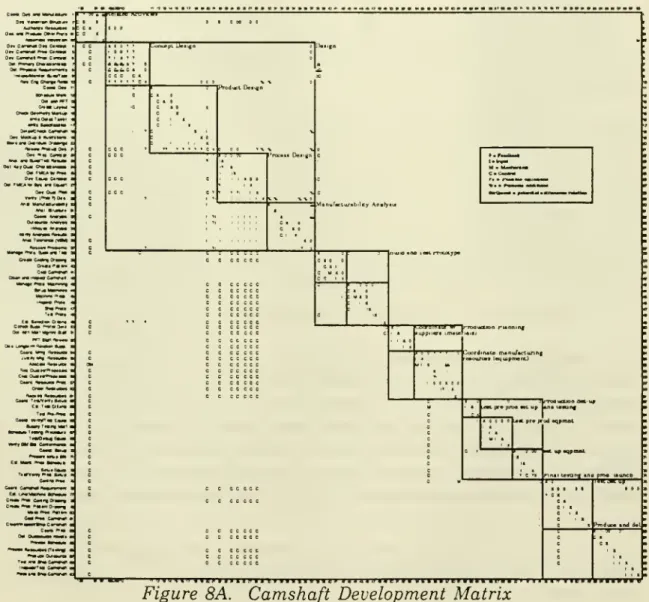
about the process it reflected.The
matrix is reproduced in Figure 8A.18
First, notice that the design activity (Tasks 4-37) is
by
far themost
iterative ofthe major tasks.
Much
more communication
is required in thisstage of the activity than in the production stages
which
appear to proceed withmore
sequential tasks (theband
ofmarks
just below the diagonal represents a sequential flow).The
design activityfrom
this matrix isenlarged in Figure 8B.
4 5 6 7 8 9 10 11 12 13 14 15 1617 18 1920g1 2223Z't2526 e738 29X 31 3g 33 34 3536
Dev.CamshaftDes.Concept 4
Dev.CamshaftProc.Concept 5
Dev.CamshaftProd.Concept 6
Del.PrimaryCharacteristics 7
Det.PhysicalRequirements 8 Initiate/MonitorBuild/Test 9
Rev.EngChange Reqs lO
Coord. Des. 11
ScheduleWork 12
Dis.withPFT 13
CreateLayout 14
Check Geometry Markup 15
Write Detail Ticket 16
WriteSpeaficaiion 17
Detail/CheckCamshaft is
Dev.Mockup& Illustrations 19
StoreandDistributeDrawings 20
ReviewProduct Des. 21
Dev.Proc.Concept 22
Anal,andBuild/TestResults 23 Del.KeyQual Characteristics 24
Det.FMEAforProc 25
Dev.Equip.Concept 26 Det.FMEAforSys.andEquip'! 27
Dev.Qual.Plan 28 Verify (Proc?) Des. 29 Anal. Manufacturability 30 Anal. Structure 31
Coord. Analysis 32
OutsourceAnalysis 33
Inhouse Analysis 34
VerifyAnalysis Results 35
Anal.Tolerance(VSM) 36
Resolve Problems 37
9 10 11 12 13 1415 16 17 18 192021 22 23 24 2526 272829X 31 3233 34 3536 :
Figure 8B. Design Block of
Camshaft Development
MatrixAgain, the precedence information
was
discovered to be incomplete,but in this case,
we
ventured to classifysome
ofthe errors.We
identifiedprecedences
which
shouldhave
existed, butwere
not present in theIDEFO
model.These were
conjectured based on the task descriptionsand
the flow ofinformation expected to be required. For example, task 21Review
Product Design should
have
input from several Product Design tasks.A
number
of these possible omissions are denoted in the matrix using the '?'symbol.
We
also identified extraneous precedenceswhich
seemed
superfluous
and
labeled these asmarks
with a strikeout.Although
these19
modeled, they
were
based onan
engineering interpretation ofthe task definitionsand
the expected sources ofinputsand
destinations ofoutputs.For example,
we
questionwhether
determination ofprimary
characteristics
and
physical requirements ofthe camshaft (Tasks 7and
8)require the
development
ofthe designand
production concepts (Tasks 4, 5,and
6).We
suspect that the relation should bemodeled
in reverse.That
is,the determination ofthe
primary
characteristicsand
physicalrequirements should drive the design ofthe product
and
the process.The
remaining
marks
in the matrix are suggestions for additional feedback. In contrast to the '?' labelswhich
represent a logical relationwhich
may
have
been overlooked in the modelling, the '%'marks
represent opportunitieswhere
strategic feedback does not yet exist, but could beimplemented.
These
include suggestions such as includingmanufacturability analysis (Task 30) in the review ofthe product design
(Task 21).
The
most
significant shortcoming exposed in constructing thesemodels
was
the degree ofthe interdependencebetween
tasks. Inmany
cases, theIDEFO
model
denotedan
interdependencewhich
seemed
more
appropriatelytermed
a feedback or verificationdependence
ratherthan
a tight interdependencewhich
is resolved inan
iterative process ofnegotiation.
For
example, in the crankshaft model,we
expect toconceptualize the
manufacturing
process, design it,and
then validate it(Tasks 35-37).
However,
their precedence relation indicates that they areexecuted simultaneously. It
makes
sense to do it in the present order, butnot the other
way
around.What
isneeded
isan
explicitmeans
ofdifferentiating
between
the various types ofinterdependent relationships. In this case,we
expect that there issome
feedbackfrom
the design tasks tothe conceptualization tasks, but not complete precedence. This type of
information is important to capture in the design
model and
ameans
for doing so is suggested below.These
matrixmodels
of actual designand manufacturing
activitiesdisplay the critical dependencies explicitly.
When
information is requiredbefore it is available, the precedence appears as
an
above-diagonal element.The
insight provided in these matrix models allow the designmanager
tochoose
which
dependencies to address based on the potential for overallimprovement.
Itmay
be possible to eliminatesome
iteration by re-ordering the activities orby
building coordination into the early steps ofthe process.These and
other strategies are discussed in detail in [6],and
are20
Matrix
Analysis ToolsThe
tools available for analyzing design matrices are detailed in [7],but are
summarized
here.One
ofthe first analysis techniqueswhich
thematrix representation facilitates is a re-sequencing ofdesign activities using precedence relations as a guide. This is referred to as partitioning
[18]. This procedure attempts to
maximize
the availability ofrequisiteinfc
mation
and
identifies cases inwhich
not all requisite information can bemade
available.When
this occurs, there is a cycle ofinformation flowwhich
appears as a block centered about the diagonal ofthe matrix. This procedure identifieswhich
tasks are involved in cyclesand
are performed iteratively. In exposing the structure of dependence, it alsomakes
explicitthe relation
between
the activities. For example, taskswhich
must
beperformed
in series are differentiatedfrom from
taskswhich
can occur inparallel. Figure 9 depicts a precedence matrix both before
and
after partitioning.ABCDEFGHIJKL
BCAKLJF
lEDHG
21
The
matrix representation easily identifies opportunities foraccelerating the design process using a concurrent engineering approach.
The
precedence information contained in the matrix immediately exposesthe earliest start times for each ofthe activities relative to one another. Certain dependencies
may
be eliminated byupstream
coordination inwhich
the interfacebetween
two activities is agreed upon.We
call this artificial decoupling [6]which
is intended to reduce long iterations found in design activities. For example, ifthe nature ofthedependence
between
activities
E
and
H
above is such that it can be coordinated upstream, theiterative block is reduced to three serial tasks. Strategically decoupling the design into smaller sub-tasks can reduce the size ofthe
working
design groups,and
canhave
a dramatic impact ondevelopment
performance [1,14].
A
related issue involves puttingmore
feedback into the matrix, resulting inmore
inputsand
coupling.An
increased coupling strategy isthe essential basis of simultaneous engineering
and
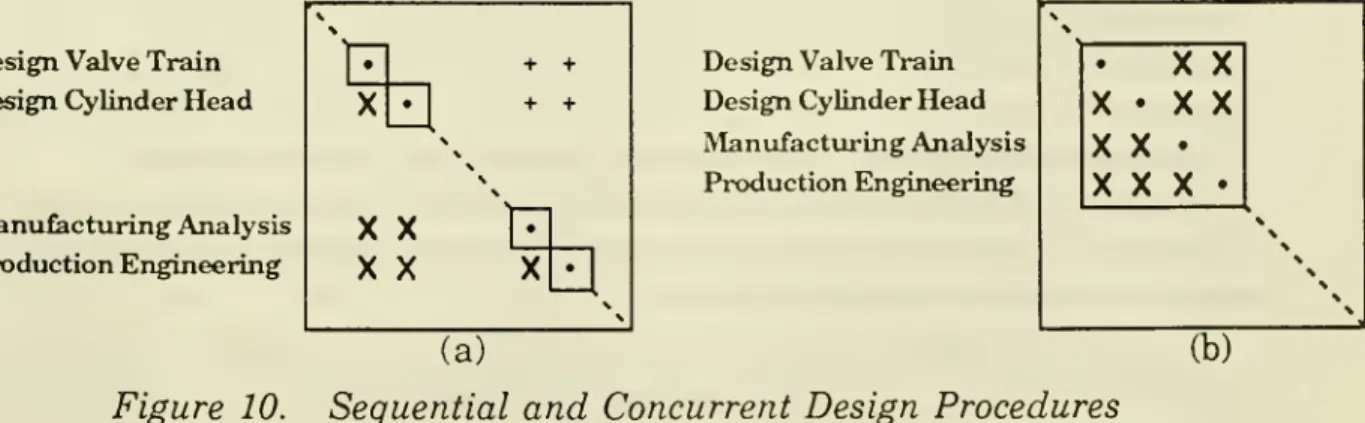
design formanufacture (DFM).
In the traditional (sequential) design process,depicted
by
the matrix in Figure 10a, the product designerswould
performtheir design tasks
somewhat
independently from themanufacturing
engineers. In the
modern
(concurrent) design process. Figure 10b, the practice ofDFM
mandates
that these two activities be performedsimultaneously. This is beneficial because the production expertise is brought into the early design stages (often causing
much
iteration),resulting in designs
which
are simpler to manufacture.However,
theadded
coupling in the design process in fact slows productdevelopment
considerably. Advocates ofthis philosophy
would
argue that overall designtime can still be reduced because the
need
for later (more lengthy) iterationis therefore lessened. This is particularly true ifthe feedback from
manufacturing
engineering to designwas
indeed present in the original design procedure. This feedback isshown
in Figure 10aby
the +marks
which
depict redesign activity addressing the productionproblems
which
inevitably arise.
Design Valve Train DesignCylinderHead
ManufacturingAnalysis Production Engineering \ \ • + + \ \ \ X X
pi
XX
X • \Design Valve Train DesignCylinderHead
ManufacturingAnalysis Production EIngineering I '' \ \ X • X X X
X
• IX X X I \ \ \ % \ \ % (a) (b)22
Matrix
Improvements and
Applications
One
shortcoming ofthe representationsand
techniques presented above is theassumption
that all task relations are equal.No
attempt ismade
to quantifyamounts
ofinformation transferredbetween
tasks in the matrix. It is reasonable to expect that certain dependencies will be strongerthan
others, or that certain transfers ofinformation will be critical. In the design precedence matrix, task interactions are not differentiated from oneanother.
We
aim
toembody
some
information about the tasks'interdependencies into the matrix itself
and
to incorporate this dimensioninto the analysis techniques applied to the design process.
The
binary design structure matrix can be vastlyimproved
by having the matrix elements reflectany
ofanumber
of differentmeasures
about the relationbetween
tasks or the task's relation to the entire design process.These
numerical
measures
can reflect quantity of information transferredbetween
tasks, sensitivity oftasks to incomplete data, or other quantities.One
such numerical scoring is based onan
estimate ofthe quantity ofinformation transferred
between
tasks. Thiswould
allow us to differentiatebetween
different degrees ofinterdependenceand would
significantlyclarify the models. Simple verifications
and
feedbacks can be differentiatedfrom
strict precedencewhich
requires iterationand
negotiation.By
attaching numerical data to the precedence data, the matrix can represent
more
informationthan
it presently does.The
additional advantage to thisquantitative
model
is thenumber
ofanalysis toolswhich
can be applied toit.
With
theenhanced
representationcomes
additional capability to suggestimprovements.
For example, a sequence can be scored based on the quantity of
information that
must
be approximated because it is not availablewhen
it isrequired. If a particular ordering requires too
much
information to beassumed,
other sequences can be generatedand
scored.These
scores allowcomparisons of different design structures using a
common
metric.A
numerical algorithm can be
aimed
atminimizing
a certain score.The
score can be tailored to use a particular metric
most
appropriately. For example, ifonewere
tomeasure
the certainty withwhich
a particular piece ofinformation could beapproximated
(perhaps based on previousexperience), it
would
be best tomaximize
theminimum
above diagonal element.These
heuristics can easily bechanged
toaccommodate
variousmeasures
of task interdependence.An
example
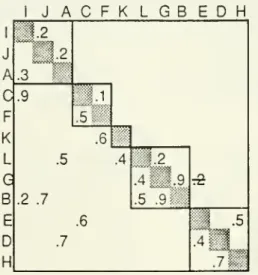
of a numerical design structure matrix is presented in Figure 11. In this example, a matrix hasbeen
constructed to demonstrate23
matrix has
been
converted from binary dependencies to numerical metrics ofinterdependence. Analysiswas
performed on the matrix usingtwo
methods: (1) standard algorithms
which
consider all dependencies equaland
(2) numerical algorithmswhich
relyupon
an
enhanced
informationcontent. Standard Partitioning Algorittims
•^
ABCDEFGHI
JKL
JACFKLGBEDH
Numerical Partitioning AlgorithmsFigure 11.
Numerical
Design Structure MatrixIn this example, the numerical goal
was
tominimize
thesum
oftheabove diagonal elements weighted by the distance
from
the diagonal.Compare
the results from standard partitioning to the outputfrom
thenumerical algorithms.
The
results are significantly differentand
lead todifferent conclusions.
The
different results suggest different designmanagement
strategies. In the binary matrix,
Task
G'sdependence
onTask
E
would
notbe considered a strategic one
which
could impact the execution ofthedesign activity.
However,
the numerical matrix provides additional insightwhich
could lead to a design organization pictured in Figure 12.24 insight or experimentation, while in the numerical matrix, the leverage of this tear is
more
apparent.JACFKLGBEDH
Figure 12. Tear Suggested by
Numerical
MatrixThe
enhanced
matrix representation will capture significantlymore
information in
an
easily usable form.The enhanced
representation capable ofhandlingmeasures
of task interdependence providesenough
flexibility to be used in
many
scenariosand
at different levels.A
parameter
level matrix
might
measure
sensitivity ofaparameter
to its input.These
numerical matrix representations can be analyzed using
any
number
ofnumerically based tools
which
utilize the information appropriately to25
Conclusion
The work
reported here is a comparison of existing designrepresentation techniques.
The
need for good models hasbeen
prompted by
an
increasing interest in executingand
managing
the design activity in themost
effectivemanner.
As
different representations ofdesignhave been
utiHzed, limitations with existing techniques
have been
exposed.Using
a precedence matrix tomodel
design activities at GeneralMotors
has aidedour understanding ofthe
complex
interactionswhich
occur during the design process.As
the study of the design hasbecome
more
sophisticated,we
have
found thatenhancements
to this representation are necessary.The
proposed representation based on a numerical precedence matrixincorporates the qualities ofa good representation outlined above.
The
flexibility
and
clarity ofthe numerical matrix format provide a platformfrom
which
to address questionswhich
are relevant to improving thedesign process.
Acknowledgements
This research is funded jointly by several sources including the
National Science Foundation, the General
Motors
Corporation,and
theMIT
Leaders forManufacturing Program,
a partnership involving elevenmajor
US
manufacturing
firmsand
MIT's engineeringand
management
26
References
[I] D. G.
Ancona
and
D. E. Caldwell."Demography
and
Design:Predictors of
New
ProductTeam
Performance",Working
Paper,MIT
Sloan School of
Management,
no. 3078-89,September
1989.[2] T. A. Black.
A
Systems
DesignMethodology
Applied to AutomotiveBrake
Design, S.M. Thesis,MIT,
1990.[3] T. A. Black, C. H. Fine
and
E.M.
Sachs. "AMethod
forSystems
Design
Using
Precedence Relationships:An
Application toAutomotive
Brake
Systems",Working
Paper,MIT
Sloan School ofManagement,
no. 3208-90, October 1990.[4] J. Corbett. "Design for
Economic
Manufacture",Annals
of C.I.R.P.vol. 35, no. 1, pp. 93, 1986.
[5] S. D. Eppinger.
Model-Based Approaches
toManaging
ConcurrentEngineering. International Conference on Engineering Design, Zurich, 1991.
[6] S. D. Eppinger, D. E. Whitney, R. P.
Smith
and
D. A. Gebala.Organizing the Tasks in
Complex
Design Projects.ASME
Design
Theory
and Methodology
Conference, Chicago, IL, 1990.[7] D. A.
Gebala
and
S. D. Eppinger. 'Methods for Analyzing DesignProcedures",
Working
Paper,MIT
Sloan School ofManagement,
no. 3280-91, April 1991.[8] F. Harary.
Graph
Theory. Addison-Wesley, Reading, Mass., 1969.[9] D.
M.
Himmelblau.
"Decomposition ofLarge Scale Systems, Part 1:Systems
Composed
ofLumped
Parameter
Elements",Chemical
EngineeringScience, vol. 21, pp. 425-438, 1966.
[10] G. Kron. 'Diakoptics', Piecewise Solution of
Large
ScaleSystems
ofEquations, Ph.D. Thesis, University ofTexas, Austin, 1963.
[II]
W.
P. Ledetand
D.M. Himmelblau.
"Decomposition Procedures forthe Solving ofLarge Scale Systems",
Advances
inChemical
Engineering, vol. 8, pp. 185-254, 1970.
[12] F. K. Levy, G. L.
Thompson
and
J. D. Wiest. "TheABC's
of theCritical
Path
Method",Harvard
Business Review, vol. 41, 5, pp. 98-108, 1963.
[13] D. A.
Marca
and
C. L.McGowan. SADT:
Structured Analysisand
27
[14] J. B. Quinn.
"Managing
Innovation: Controlled Chaos",Harvard
Business Review, pp. 73-84,
May-June
1985.[15] J. L. Rogers.
DeMAID:
A
DesignManager's Aide
for IntelligentDecomposition User's Guide.
NASA
TechnicalMemorandum
101575, March, 1989.
[16] D. T. Ross. "Structured Analysis (SA):
A
Language
forCommunicating
Ideas",IEEE
Transactionson
SoftwareEngineering, vol. SE-3, no. 1, January, pp. 16-34, 1977.
[17] D. T. Ross. "Douglass Ross Talks about Structured Analysis",
IEEE
Computer
Magazine. 1985.[18] R.
W.
H. Sargentand
A.W.
Westerberg. "'Speed-Up' inChemical
Engineering Design", Trans. Instn.
Chem.
Engrs. vol. 42, T190-T197, 1964.[19]
M.
Sequeira. Use ofthe Design Structure Matrix in theImprovement
of a Vehicle
Development
Process, Master's Thesis,MIT,
1991.[20] D. V. Steward.
Systems
Analysisand Management:
Structure, Strategy,and
Design. Petrocelli Books,New
York, 1981.[21] D. V. Steward. Using Information
Flow
toManage
the Design ofSystems. Portland International Conference on
Management
ofEngineering
and
Technology, Portland, Oregon, October, 1991.[22] J. N. Warfield. "Binary Matrices in
System
Modeling",IEEE
Transactions
on
Systems,Man, and
Cybernetics, vol.SMC-3,
no. 5, September, pp. 441-449, 1973.[23] J. D. Wiest
and
F. K. Levy.A
Management
Guide
toPERT/CPM.
Prentice-Hall,
Englewood
CHffs,New
Jersey,2nd
Edition, 1977.[24] P. H. Winston. Artificial Intelligence. Addison-Wesley, Reading,
Date
Due
w^
(Vll*^'oO
NOV. 19
1992 ' APR.08
IS93 f^DV 1 8 200! Lib-26-67MIT LIBRARIES DUPl