HAL Id: hal-01630686
https://hal.archives-ouvertes.fr/hal-01630686
Submitted on 8 Nov 2017
HAL is a multi-disciplinary open access
archive for the deposit and dissemination of
sci-entific research documents, whether they are
pub-lished or not. The documents may come from
teaching and research institutions in France or
abroad, or from public or private research centers.
L’archive ouverte pluridisciplinaire HAL, est
destinée au dépôt et à la diffusion de documents
scientifiques de niveau recherche, publiés ou non,
émanant des établissements d’enseignement et de
recherche français ou étrangers, des laboratoires
publics ou privés.
Impact of switching of the electrical harvesting interface
on microbial fuel cell losses
Armande Capitaine, Gaël Pillonnet, Thibaut Chailloux, Adrien Morel, Bruno
Allard
To cite this version:
Armande Capitaine, Gaël Pillonnet, Thibaut Chailloux, Adrien Morel, Bruno Allard. Impact of
switching of the electrical harvesting interface on microbial fuel cell losses. 2017 IEEE SENSORS,
Oct 2017, Glasgow, United Kingdom. �10.1109/ICSENS.2017.8234189�. �hal-01630686�
Impact of switching of the electrical harvesting
interface on microbial fuel cell losses
Armande Capitaine
1,2, Gael Pillonnet
1, Thibaut Chailloux
1, Adrien Morel
1and Bruno Allard
21 Univ. Grenoble Alpes, CEA, LETI, DACLE, LGECA, F-38000 Grenoble, France 2 Univ. de Lyon, INSA Lyon, Ampère, UMR CNRS 5005, F-69621 Villeurbanne, France
Abstract—Microbial fuel cells (MFCs) are sources harvesting energy from organic matters and showing great promise in powering environmental sensors. Because of the low power and voltage issues (100µW at 0.3V for 20 cm² electrodes), an electrical interface is required to extract the maximum power delivered by the MFC and boost the output voltage. However the switching operation of most converters induces a pulsed sinking current which may cause additional dynamic losses inside the MFC. Following a previous study on a flyback converter in discontinuous conduction mode, this paper analyzes the effect of switching of the converter on the MFC internal losses. A dynamic model of the MFC is deduced from an impedance spectroscopy characterization: it reveals a double RC behavior, one with a time constant of 10s of s, the other one of 100s of µs. Then in the frequency-domain, the MFC dynamic losses, induced by a previously optimized flyback, are calculated: they represent 50% of the maximum power that can be extracted from the MFC. Eventually in order to reduce these losses, we study the impact of three flyback parameters (primary inductance, duty cycle and decoupling capacitance). Adding a capacitance of 10 µF at the converter input, the MFC dynamic losses become negligible.
Keywords—microbial fuel cell; flyback converter; energy harvesting; dynamic electrical model; impedance spectroscopy
I. INTRODUCTION
Discovered in the last decades, microbial fuel cells (MFCs) are promising sources for scavenging energy from organic substrates (e.g. compost, sediment, wastewater…) by converting chemical energy into electricity thanks to catalysis properties of electro-active bacteria [1]. They can be seen as an attractive alternative to polluting batteries to power sensors in hardly reachable areas (e.g. seafloors). Regarding the low voltage and low power the MFCs generate (100 µW at 0.3 V for 20 cm² electrodes [2]), an electrical interface, i.e. a DC/DC converter, is required to extract the maximum power, PMPP, from the MFC
and boost the voltage to the level required by the sensor. However these converters, because of their inherent switching operation, impose a pulsed sinking current which may cause additional losses inside the MFC, on top of the well-known losses due to the DC current (static losses). These additional losses due to AC currents are called MFC dynamic losses. The paper follows a previous work [3, 4] where the MFC interface is a flyback converter in discontinuous conduction mode (DCM) extracting energy from a benthic MFC with 20 cm² electrodes and a maximum power of 90 µW. So far only the MFC static losses have been considered in literature. The paper studies the MFC additional dynamic losses induced by the switching operation of the flyback converter.
First a dynamic model of the MFC will be determined from experimental data obtained with electrochemical impedance spectroscopy (EIS) [5]. Then we will study the impact of the dynamic current imposed by the converter on the MFC dynamic losses. After developing a calculation method of the MFC dynamic losses, we will analyze the influence of three converter parameters (primary inductance, duty cycle, input capacitance) on these losses for minimization, i.e. avoid inefficient consumption of the organic substrate.
II. ELECTRICAL MODELING OF MFC
A. Static behavior
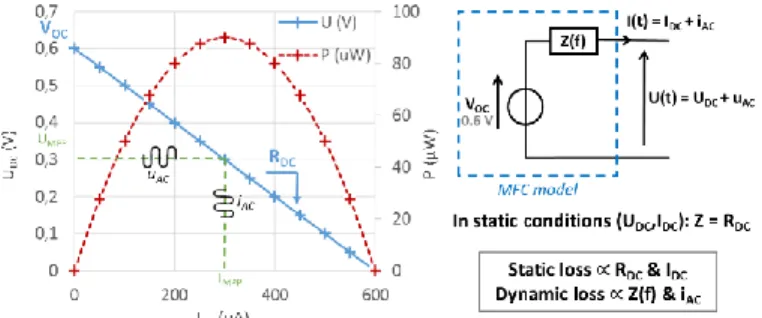
A typical way to model the MFC static behavior is shown in Fig. 1. The polarization curve is comparable to a straight line corresponding to a Thevenin circuit. Our lab-scale MFC generates PMPP = 90 µW at the maximum power point (MPP)
and corresponds to an open-circuit voltage source VOC of 0.6 V
and a series resistance RDC of 1 kΩ [2]. However this model does
not reflect the dynamic behavior of the MFC when an AC stimuli is applied.
Fig. 1. Static characteristic of the MFC associated to the MFC electrical model B. Dynamic characterization
The EIS method is adopted in order to to appreciate the MFC dynamic behavior at different DC operating point (UDC, IDC).
This method consists in adding a sinusoidal perturbation uAC
with variable frequency f to the polarization voltage UDC (as
schematized in Fig. 1). The amplitude of uAC is fixed to 50 mV
so that the MFC can accurately be apprehended as a linear system. The resulting current, expressed as the sum of the static current IDC and a sinusoidal perturbation iAC, is then measured.
From these measurements, we can deduce an MFC equivalent dynamic impedance Z(f) at different frequency f for a specific DC point (UDC, IDC). Its amplitude |Z| and phase φ, when
working at MPP (UDC = 0.3V), are represented in Fig. 2. Similar
AC characteristic is obtained for other polarization voltages. Weassume the MFC dynamic behavior is independent of the
polarization point. Moreover the frequency range is large since some physical aspects characterized at low frequency (e.g. mHz) may have a significant impact even when using a kHz switching frequency converter.
Fig. 2. Amplitude and phase of the MFC dynamic impedance obtained experimentally with the impedance spectroscopy method (blue solid line) and of the deduced dynamic model of the MFC (red dashed line). C. Dynamic electrical model
Fig. 3. Dynamic model of the MFC
The dynamic electrical circuit deduced from the previous characterization is represented in Fig. 3. To the static model is added two parallel RC branches, one (R1C1) being associated to
the low cut-off frequency fBF, the other (R2C2) to the higher one
fHF (Fig. 2). The circuit components are calculated using
equations in Fig. 3 in which {RBF, RHF, fBF, fHF} are evaluated
from AC measurements (Fig. 2). RDC is not readable in Fig. 2
as extended AC measurements at lower frequencies is very time consuming. RDC is thus deduced from a previous static
characterization (Fig. 1). The results are listed in Table I..It shows an accurate fit with the experimental data (Fig. 2).
TABLE I. VALUES OF THE DYNAMIC MODEL COMPONENTS
RDC R1 C1 R2 C2
1 kΩ 347 Ω 30 mF 35 Ω 3 µF The first branch R1C1 has a time constant of the order of 10s
of seconds and can be associated to the transport mechanisms of the organic matter to the electrodes [6]. Whereas the second branch R2C2, having a time constant of the order of 100s
of microseconds may be due to the double layer electrical behavior at the electrodes’ surface [6]. Therefore the MFC presents two dynamic resistances R1 and R2 that may engender
additional intrinsic losses.
III. INFLUENCE OF THE HARVESTING INTERFACE ON THE
MFC DYNAMIC LOSSES A. Harvesting interface
Using the previous work presented in [3], the flyback in DCM is chosen as an harvesting interface mainly for its isolation capability. As explained in [3], to work at the DC-MPP and extract the maximum DC energy from the MFC, the flyback input impedance RIN has to meet the following constraints:
𝑅𝐼𝑁=2𝐿𝐷1𝑓2𝑠𝑤= 𝑅𝐷𝐶 (1)
L1 is the primary inductance, D the duty cycle and fsw the
switching frequency of the flyback. This means the three parameters {L1, D, fsw} are linked. In [4] it was chosen to work
with a coreless transformer to avoid converter losses due to saturation and hysteresis and thus maximize the converter efficiency. The same experimental set-up {L1, D, fsw} = {583 µH, 0.07, 4.23 kHz} will be used in the
following study to evaluate the additionnal AC losses due to R1
and R2.
B. Calculation of the MFC dynamic losses
Transient simulations may be very time consuming regarding the 10s of second time constant at stake in the MFC dynamic model compared to kHz flyback switching operation and so the time needed to reach steady-state operation. An analytical frequency approach based on the Fourier decomposition is thus preferred. For the sake of simplification, the flyback input current, called Iflyback in Fig. 4, is considered of
constant at the flyback input and independent of MFC energy production. In frequency domain, we calculate the Fourier series of currents I1 and I2 in Fig. 3 using the respective transfer
functions regarding Iflyback and the Fourier series of Iflyback. Again
in the time-domain, the losses P1 and P2 induced respectively by
the branch R1C1 and R2C2 are deduced. The method is
summarized for P1 in Fig. 4.
Fig. 4. Method of the dynamic losses calculation, example of P1 calculation
C. Results
Following this calculation process, in the chosen conditions {L1, D, fsw} = {583 µH, 0.07, 4.23 kHz}, P1 is equal to 4.4 µW
and P2 to 42.9 µW, representing respectively 5% and 48% of the
extracted DC power PMPP (equal to 90 µW). Therefore the
dynamic part of the MFC undergoes non-negligible losses compared to the 90 µW corresponding to the DC losses due RDC.
This means a power equivalent to 53% of the one usefully delivered to the converter is lost inside the MFC, contributing to a useless depletion of the organic matter resources. In order to reduce these losses, we will vary different flyback parameters, e.g. L1 and D, to change the frequency spectrum of the currents
I1 and I2 and thus the energy dissipation in respectively in R1 and
R2.
Influence of L1: fixing D to 0.07, P1 and P2 are calculated
for L1 varying from 2 µF to 200 mF. In order to respect (1) and
work at the DC-MPP, fsw is constantly adapted (from 1.23 MHz
to 12.3 Hz). The results are shown in Fig. 5. When increasing L1, i.e. decreasing fsw, I1 increases (|G1| increases in the lower
frequencies, Fig. 4) while I2 decreases. Regarding the high value
of R1 compared to R2, the increase in P1 is more significant than
the decrease in P2, hence the total dynamic losses explode,
especially for L1 > 100 mH. For lower values, L1 variations have
no impact on the dynamic losses which remain equal to 52.6% of PMPP. Therefore considering our previous working conditions
(L1= 583 µH), no minimization of the dynamic losses can be
made by varying L1.
Fig. 5. Influence of L1 choice on the MFC dynamic losses (D=0.07)
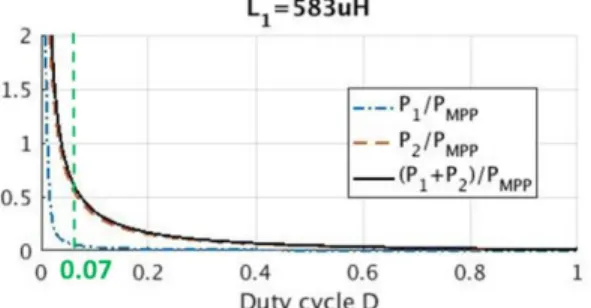
Influence of D: L1 is fixed to 583 µH and D varies from 0
to 1 while adapting fsw according to (1) as it was done in the
previous case. The results are shown in Fig. 6. When decreasing D, i.e. decreasing fsw, the dynamic losses increase exponentially.
These losses are particularly important when working with D lower than 0.2. Then working with a D higher than 0.5, i.e. fsw
higher than 214 kHz, ensures negligible dynamic losses. However [3] has shown that such an increase in fsw causes
critical switching losses inside the flyback and thus drastically reduces its conversion efficiency. Therefore another way to reduce P1 and P2 without impacting on the conversion efficiency
is needed.
Fig. 6. Influence of D choice on the MFC dynamic losses (L1=583µH)
Influence of CIN: using the initial parameters given in
section III.A, a capacitance is added at the input of the flyback converter. The results are displayed in Fig. 7. We observe that the inclusion of this capacitance decreases the MFC dynamic losses. This decrease becomes significant for CIN larger than
few µF for which the dynamic losses represent less than 1% of the extracted power PMPP. With CIN = 10 µF (which represents a
negligible extra surface on a PCB), these losses are equal to 0.1% of PMPP and may be neglected. Indeed all the AC current is
flows in CIN, causing no loss as ESR is neglected.
Fig. 7. Influence of a capacitance CIN at the input of the flyback on the MFC
dynamic losses ({L1, D, fsw} = {583 µH, 0.07, 4.23 kHz})
IV. CONCLUSION
The paper analyzes the influence of the flyback converter in DCM on the intrinsic losses of an MFC. Because of the switching behavior, the converter imposes dynamic currents to the MFC which may induce dynamic losses inside the MFC. First a dynamic model composed of two parallel RC branches associated to time constants of the order of 100s of µs and 10s of s was deduced from measurements obtained with EIS. Second we analyzed the influence of the flyback design (always working at MPP) on the losses induced by these two dynamic branches. Varying L1 offers no possible optimization, while
increasing D may significantly reduce the dynamic losses. However increasing D means increasing f which drastically reduces the flyback efficiency. Eventually we show that inserting a decoupling capacitance larger than 10 µF at the input of the converter reduces the MFC dynamic losses from 52.6% to 0.1% of the extracted power PMPP.
REFERENCES
[1] B.E. Logan et al., Microbial fuel cells: methodology and technology, Environ. Sci. Technol., 40 (2006) 5181-5192.
[2] T. Chailloux et al., Autonomous sensor node powered by cm-scale benthic microbial fuel cell and low-cost and off-the-shelf components, Energy Harvesting and Systems, 3 (2016) 205-212.
[3] A. Capitaine et al., Loss analysis of flyback in discontinuous conduction mode for sub-mW harvesting systems, IEEE Proceedings of new Circuits and Systems Conference (NEWCAS), 2016.
[4] Y. Wanderoild et al., 100 µW coreless flyback converter for microbial fuel cells energy harvesting, New generation of circuits and systems (NGCAS), 2017, in press.
[5] X. Z. Yuan et al., Electrochemical impedance spectroscopy in PEM fuel cells, Springer, 2010
[6] A. Dhirde et al., Equivalent electric circuit modeling and performance analysis of a PEM fuel cell stack using impedance spectroscopy, IEEE Transactions on energy conversion, 25 (2010) 778-786.