HAL Id: hal-00296528
https://hal.archives-ouvertes.fr/hal-00296528
Submitted on 24 Apr 2008
HAL is a multi-disciplinary open access
archive for the deposit and dissemination of
sci-entific research documents, whether they are
pub-lished or not. The documents may come from
teaching and research institutions in France or
abroad, or from public or private research centers.
L’archive ouverte pluridisciplinaire HAL, est
destinée au dépôt et à la diffusion de documents
scientifiques de niveau recherche, publiés ou non,
émanant des établissements d’enseignement et de
recherche français ou étrangers, des laboratoires
publics ou privés.
site in Northern China
P. Yan, J. Tang, J. Huang, J. T. Mao, X.J. Zhou, Q. Liu, Z. F. Wang, H. G.
Zhou
To cite this version:
P. Yan, J. Tang, J. Huang, J. T. Mao, X.J. Zhou, et al.. The measurement of aerosol optical properties
at a rural site in Northern China. Atmospheric Chemistry and Physics, European Geosciences Union,
2008, 8 (8), pp.2229-2242. �hal-00296528�
www.atmos-chem-phys.net/8/2229/2008/ © Author(s) 2008. This work is distributed under the Creative Commons Attribution 3.0 License.
Chemistry
and Physics
The measurement of aerosol optical properties at a rural site in
Northern China
P. Yan1,2, J. Tang1, J. Huang3, J. T. Mao2, X.J. Zhou1, Q.Liu4, Z. F. Wang4, and H. G. Zhou4
1Chinese Academy of Meteorological Sciences of CMA, Beijing, China 2Department of Atmospheric Sciences, Peking University, Beijing, China
3Guangzhou Institute of Tropical and Marine Meteorology of CMA, Guangzhou, China 4Beijing Meteorological Bureau, Beijing, China
Received: 15 June 2007 – Published in Atmos. Chem. Phys. Discuss.: 6 September 2007 Revised: 1 February 2008 – Accepted: 7 March 2008 – Published: 24 April 2008
Abstract. Atmospheric aerosols constitute one of the largest
sources of uncertainty in the estimation of radiative forcing for climate. From April 2003 to January 2005, in situ mea-surements of aerosol optical properties were conducted at a rural site in Northern China, Shangdianzi Global Atmo-sphere Watch (GAW) regional station (SDZ), about 150 km from Beijing. Mean values (standard deviation, S.D.) of scat-tering and absorption coefficients for the entire period are 174.6 Mm−1 (189.1 Mm−1)and 17.5 Mm−1 (13.4 Mm−1), respectively. These values are approximately one third of the reported values for scattering coefficients and one fifth of those for absorption coefficients obtained in the Beijing ur-ban area. The mean single scattering albedo (SSA) for the entire period was estimated as 0.88 (0.05), which is about 0.07 higher than the values reported for the Beijing urban area, and also higher than the values (0.85) used in a re-ported climate simulation for China and India. Both the ab-sorption and scattering coefficients showed a seasonal cycle with the lowest values in winter, while the highest values occurred in summer for absorption coefficients and in fall for scattering coefficients. The mean SSA values were low-est in spring and highlow-est in winter. The daily variations of aerosol absorption and scattering coefficients were strongly influenced by synoptic changes throughout the observation period. A trajectory cluster analysis was applied to dis-cern the source characteristics of aerosol optical properties for different air masses. The cluster-mean aerosol scattering coefficients, absorption coefficients and SSA were all high when the air masses moved from SW and SE-E directions to the site and aerosols were influenced with heavy pollution
Correspondence to: P. Yan
(yanpeng@cams.cma.gov.cn)
from the dense population centers and industrial areas. The cluster-mean SSA for air masses coming from the polluted areas was not only higher than those with trajectories from the “clean” directions, but also higher than the reported val-ues for the regions with high pollution emissions (such as the Beijing urban area). This fact might reflect the substantial secondary aerosol production during transport. The charac-teristics of aerosol optical properties measured at this rural site suggest significant impacts of human activities on the re-gional aerosol.
1 Introduction
Aerosols perturb the radiation balance of the Earth directly through scattering and absorbing solar radiation, and indi-rectly by acting as condensation nuclei in cloud formation, thus affecting the optical properties and lifetimes of clouds (Rosenfeld, 1999, 2000; Twomey, 1977). The optical prop-erties of aerosols are related to both their chemical compo-sition and particle size distributions. Atmospheric aerosols in different regions consist of varying composition and size modes, which lead to different radiative impacts on regional climate. Black carbon (BC) aerosol is particularly impor-tant due to its characteristics of strong light absorption, be-cause the absorbing aerosols heat the air, which can alter re-gional atmospheric stability and vertical motions and affect the large scale circulation and precipitation with significant regional climate effects (Jacobson, 2002; Menon et al., 2002; Ramanathan et al., 2001). As opposed to the well mixed greenhouse gases, aerosol has a highly inhomogeneous ge-ographic distribution. The effect of aerosols is so far very poorly taken into account in climate models (Anderson et
# # # # # # # # $
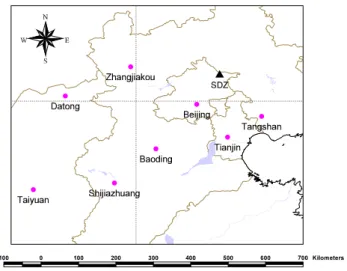
Fig. 1. Map of SDZ station and the major cities in the region.
al., 2003). The spatial and temporal variations of radiative forcing by aerosols are strongly influenced by variability of aerosol concentration distribution and optical properties on local to regional scales. For this reason, the characterization of aerosol properties in various regions around the globe is essential to understand the role of aerosols on climate.
In China, as a result of the rapid population and eco-nomic growth, emissions of anthropogenic pollutants have increased dramatically in recent years. Emissions of SO2and
NOxin China are similar in magnitude with those of Europe
and eastern North America (Akimoto and Narita, 1994), but aerosol sources in China have their unique features. The mix-ture of heavy air pollution from urbanization and industrial activities and desert dust particles from the frequent wind storms result in a rather complex nature of aerosol optical properties in China (Holler et al., 2003). The high rate of coal and biofuels usage and lower combustion efficiency has made China a significant source of BC. It was estimated that BC emitted in China accounted for roughly one-fourth of global anthropogenic emissions, although a significant un-certainty exists in estimations of the submicron BC emission inventory (Cooke et al., 1999; Street et al., 2001). Uncer-tainties in the measurement of optical properties of aerosols in China and other Asian countries present one of the largest sources of uncertainty in the estimation of aerosol radiative forcing (Holler et al., 2003). In the past 20 years, many stud-ies have focused on the mass concentration and physical and chemical properties of aerosols in China, but few measure-ments were conducted focusing on aerosol radiative proper-ties (Xu et al., 2002, 2004).
In this paper, a 16–21 month study of in situ measurements of aerosol properties at a rural site in northern China is pre-sented, and the characteristics and variation of aerosol op-tical properties are reported. Filter analysis was performed to provide insight on the chemical composition of aerosols,
and the influence of air mass transport on the optical proper-ties of aerosol was determined through trajectory clustering analysis.
2 Experiment
2.1 Site descriptions
Shangdianzi station (SDZ, 117◦07′E, 40◦39′N, 293.3 m a.s.l.) is located in Miyun County, a suburb of the greater Beijing metropolis. The site is on the gentle slope of a small hill. The geography surrounding the station is characterized by rolling hills with farmland, orchards and forests. On the foot of the hills about 2 km south of the station is Shang-dianzi village with about 1200 inhabitants. The major lo-cal economilo-cal activities within Miyun County are farming and fruit growing. Since Miyun reservoir is the major water supply to the Beijing metropolitan area, Miyun County has been designated as a “Preservation Area”, which means that there are only minimal natural and anthropogenic pollution sources within a 30 km range surrounding the SDZ site.
Figure 1 shows the map of the SDZ station and some cities and regions with dense population and high industrial activi-ties. For example, Beijing and Tianjin are the two most pop-ulated cities in Northern China; Shijiazhuang and Taiyuan are the provincial capital cities of Hebei province and Shanxi province, respectively; Datong (in Shanxi province) is one of the largest coal production regions in China; and Baod-ing, Zhangjiakou and Tangshan in Hebei province are all large industrial cities in northern China. They are all regions with high pollution emissions (Cao et al., 2006; Streets and Carmichael, 2003). It can be seen from the map that the ma-jor cities and industrial areas with high pollution emissions in this region are located predominantly in the sectors from the west to the southeast of the site. Areas in the northern sector are much less inhabited, comprised of the vast grassland of Inner Mongolia (or Nei Mongol) and mountainous rural re-gions of Hebei province, where the population is relatively sparse and industrial activities less prevalent.
2.2 Measurements and instrumentation
During the period from April 2003 to January 2005, an in-tensive campaign of aerosol measurement was conducted at the SDZ GAW station in Northern China. The experiment in-cluded the measurement of aerosol scattering and absorption coefficients, size-resolved aerosol mass, chemical composi-tions, and meteorological observations.
Table 1 lists the measured parameters and instruments used in the experiment. Aerosol scattering coefficient (σsca)
was measured with an integrating Nephelometer (Model M9003, EcoTech, Australia). This instrument used LEDs as the light source at a wavelength of 525 nm. The scattering integration angle is from 10◦ to 170◦. The truncation error correction was not applied to the data in the study since there
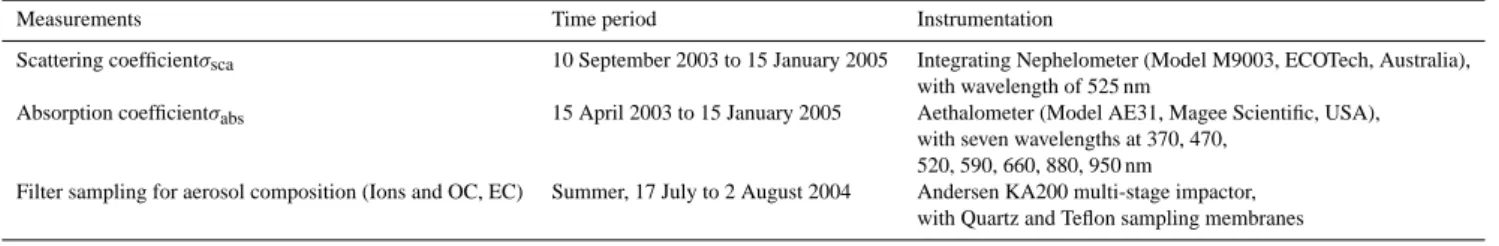
Table 1. The measurements and instrumentation.
Measurements Time period Instrumentation
Scattering coefficientσsca 10 September 2003 to 15 January 2005 Integrating Nephelometer (Model M9003, ECOTech, Australia),
with wavelength of 525 nm
Absorption coefficientσabs 15 April 2003 to 15 January 2005 Aethalometer (Model AE31, Magee Scientific, USA),
with seven wavelengths at 370, 470, 520, 590, 660, 880, 950 nm
Filter sampling for aerosol composition (Ions and OC, EC) Summer, 17 July to 2 August 2004 Andersen KA200 multi-stage impactor, with Quartz and Teflon sampling membranes
was no dust storm during the entire observation period and the truncation errors are small for submicrometer aerosols. A theoretical estimation based on Mie-theory indicated that the truncation error was less than 10% for fine particles. A back-ground (zero) check was done automatically by pumping in particle-free air once each day and a weekly span check was performed manually by the operator using particle-free HFC-R134a gas recommended by the manufacturer. The results indicated that the bias was less than 2 Mm−1for zero checks, and less than 10% for span checks. The relative humidity (RH) in the cell of the instrument was controlled below 60% by an automatic heating inlet provided by the manufacturer. This heating inlet could cause evaporation of volatile inor-ganic species (such as nitrate) and volatile orinor-ganic matters. Bergin et al. (1997) studied the decrease of the scattering co-efficient caused by the evaporative loss of aerosols in a neph-elometer, and it was generally less than 20% for pure nitrate aerosol. Therefore, the reduction of the measured aerosol scattering coefficient due to the loss of nitrate by the heating of our inlet was estimated to be small because nitrate repre-sents only a small fraction of the total mass in fine particles in northern China (Zhang et al., 2003). A precise estimation on the loss of organic matters due to the inlet heating was dif-ficult, however, because of the lack of information on organic species in our measurements.
The BC aerosol concentration was measured with an Aethalometer (Model AE31, Magee Scientific, USA). The AE31 Aethalometer measured the optical attenuation of light from LED lamps with seven different wavelengths (370, 470, 520, 590, 660, 880, and 950 nm) transmitted through the aerosols deposited continuously on a quartz fiber filter (Hansen et al., 1984). The difference in light transmission through the particle-laden sample spot and a particle free ref-erence spot of the filter is attributed to the absorption caused by aerosol. The attenuation of light is converted to the BC mass concentration using wavelength dependent calibration factors as recommended by the manufacturer (Aethalome-ter Manual, Magee Scientific). As discussed below, the Aethalometer light attenuation measurement was used to cal-culate the aerosol light absorption coefficient (σabs).
The inlets of the instruments were located on the roof of the monitoring room, at about 6 m above the ground and 3 meters above the roof. The sample air passed through
0.95 cm i.d. black conductive tubing into the room without any aerosol size cut-off.
All of the scattering and absorption coefficient data and relevant ancillary parameters were recorded at 5-min inter-vals. The datasets have been manually edited to remove in-valid data resulting from instrumental or sampling problems. The size-resolved aerosol filter sampling was taken only for some specific time periods during the experiment. The analysis included mass concentrations and some of the ma-jor chemical species, such as ions, organic carbon (OC) and elemental carbon (EC) of aerosols. The procedure for mass gravimetric and chemical analysis was identical to those de-scribed in previous work (Bergin et al., 2001; Yan et al., 2006).
2.3 Method for aerosol absorption coefficient (σabs)
calcu-lation
Aerosol light absorption coefficient (σabs)can be directly
cal-culated from the attenuation measured by the Aethalome-ter or indirectly calculated based on the BC concentrations recorded by the instrument. The direct calculation of aerosol light absorption at any wavelength uses the following for-mula (Bodhaine, 1995; Weingartner et al., 2003):
σabs= A Q× 1AT N 1t × 1 CR (1)
where,A is the filter spot area, Q the volumetric flow rate and 1AT N is the change in attenuation during the time in-terval 1t, and C is a wavelength-independent empirical cor-rection factor, which corrects for the enhancement of the op-tical path in the filter due to multiple scattering of the light beam at the filter fiber, R is the correction factor describing the changes in instrumental response with increased particle loading on the filter (shadowing effect). The C factor was found to vary with different aerosol types and mixing state, and R is equated to unity for aged particles (Weingartner et al., 2003).
The indirect way to obtain the light absorption coefficient from the recorded BC concentration is based on the following equation:
a
b
c d
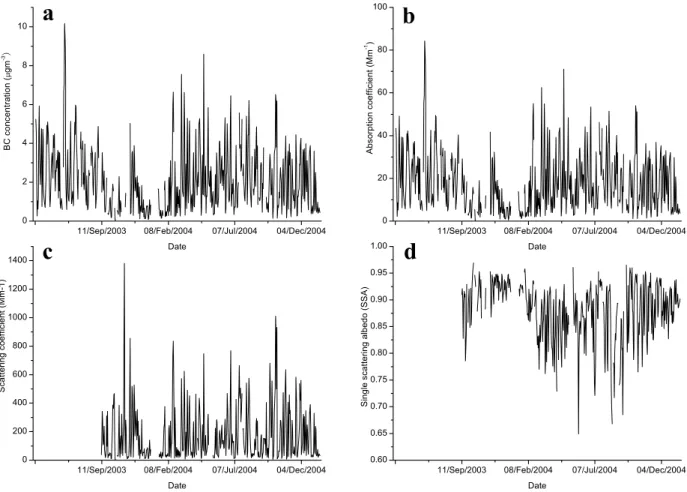
Fig. 2. The time series of daily averaged BC mass concentration, aerosol absorption and scattering coefficient, and single scattering albedo at SDZ (a) BC concentration; (b) Absorption coefficient; (c) Scattering coefficient; (d) Single scattering albedo (SSA).
where, α is the conversion factor or the BC absorption efficiency, which can be determined theoretically from Mie-theory or empirically from linear regression of the Aethalometer BC concentration data against the aerosol absorption coefficient measured from a reference method (Arnott et al. , 2003, 2005; Clarke and Charlson, 1985).
In this work, the indirect method (based on the recorded BC concentration by the Aethalometer) was employed to calculate the aerosol light absorption coefficient. The con-version factor α was obtained based on the result of the inter-comparison experiment conducted in southern China (O. Schmid, D. Chand, and M. O. Andreae, Aerosol Opti-cal Properties in Urban Guangzhou; PRD workshop, Beijing, 13–14 January 2005). In that experiment, the conversion fac-tor α=8.28 m2/g (with correlation coefficient R2=0.92) was derived by a linear regression of the BC concentrations at 880 nm (in the unit of µg/m3)from the Aethalometer against the light absorption coefficients at 532 nm (in units of Mm−1) si-multaneously measured with a photoaccoustic spectrometer (PAS). This conversion factor is comparable to ∼8–10 m2/g (at 550 nm) obtained in Mexico city (Barnard et al., 2005), but a little lower than the historical value of 10 m2/g often
used for urban aerosols (Moosmuller et al., 1998), and higher than the value of 7 m2/g for diesel soot suggested by Fuller (Fuller et al., 1999). It was very close, however, to the value of 8.0 m2/g obtained in Beijing urban area by Bergin (Bergin et al., 2001) and that of 8.5 m2/g reported by Arnott from BRAVO (Big Bend Regional Aerosol and Visibility Obser-vation Study) (Arnott et al., 2003).
3 Results and discussion
3.1 Aerosol optical properties and BC mass concentrations Figure 2 and Table 2 show the time series and the statistics of daily-average BC mass concentration and aerosol optical properties measured during the experiment. The mean (stan-dard deviation) concentration of BC, aerosol absorption and scattering coefficient for the entire period were 2.12 µg/m3 (1.62 µg/m3), 17.54 Mm−1(13.44 Mm−1), and 174.6 Mm−1 (189.1 Mm−1), and the median values were 1.78 µg/m3, 14.71 Mm−1, and 101.6 Mm−1, respectively. It should be noted that the large standard deviation for each variable
reflected the strong fluctuation of the measured aerosol prop-erties.
On average, the aerosol absorption and scattering coeffi-cients at SDZ were about one-fifth and one-third lower than those measured in the Beijing urban area in summer 1999 (Bergin et al., 2001). Table 3 lists a few other published re-sults for the purpose of comparison. The mean aerosol ab-sorption coefficient at SDZ was comparable to that obtained at Lin’an regional background station in a rural area of the Yangtze Delta Region in eastern China (Xu et al., 2002) and at the Cape D’Aguilar station of Hong Kong in eastern and southeastern China (Man and Shih, 2001), but higher than that measured at Yulin in the Gobi Desert (Xu et al., 2004). The aerosol scattering coefficient at SDZ was only about half of that at Lin’an station, but much higher than that of Cape D’Aguilar (Man and Shih, 2001; Xu et al., 2002). It is similar to that at Yulin in the Gobi Desert (Xu et al., 2004).
The single scattering albedo (SSA) is defined as the ratio of the aerosol scattering coefficient to the extinction coeffi-cient (sum of the absorption and scattering coefficoeffi-cient). This parameter is especially important in the estimation of direct aerosol radiative forcing, since even a small error in its es-timation might change the sign of aerosol radiative forcing (Takemura et al., 2002). To calculate SSA, a wavelength correction for aerosol absorption was applied to the mea-sured absorption coefficients using an empirical approach for BC aerosol, σabs∞λβ, with an absorption exponent β=−1
(wavelengthλ in the interval 0.45 µm–0.70 µm) (Bodhaine, 1995). The results showed that the mean and the median value of SSA (at 525 nm) obtained at SDZ were 0.88 and 0.90, respectively (see Table 2). This mean SSA was within the range of 0.85–0.95 retrieved through AERONET for the northern hemisphere (Dubovik et al., 2002), but lower than the value of 0.93 obtained at Lin’an in November, 1999 (Xu et al., 2002) and 0.95 at Yulin (Xu et al., 2004). It was about 0.07 higher than that (0.81) reported for the Beijing urban site (Bergin et al., 2001), and also a little higher than the value (0.85) used in climate modeling simulations for China and India (Menon et al., 2002).
Compared to the results reported for North America (see Table 3), mean aerosol absorption coefficient at SDZ is about three to four times greater than the mean value measured at Bondville, Illinois (BND), a rural location in the east cen-tral region of the United States, and forty five times greater than that measured at Barrow, Alaska (BRW), a clean region in North America. The mean aerosol scattering coefficient is three times greater than that at BND and eighteen times greater than that measured at BRW, and the mean SSA is about 0.04 and 0.08 lower than the value (at 550 nm) of BND and BRW, respectively (Delene and Ogren, 2002).
3.2 Seasonal variations of aerosol optical properties In this section, we use the data measured from December 2003 to November 2004 to discuss the seasonal variations
of aerosol optical properties and the influencing factors at the SDZ site. The calculated seasonal average (based on daily averages) of aerosol absorption, scattering coefficient and SSA are presented in Table 4, where the winter time is the period from December 2003 to February 2004, the spring from March to May, the summer from June to July, and the fall from September to November of 2004. It was found that the aerosol absorption coefficient was relatively higher in summer and spring and lower in fall and winter with the highest value in summer and the lowest in winter. The aerosol scattering coefficient showed a slightly differ-ent seasonal distribution. The aerosol scattering coefficidiffer-ents were elevated in fall and summer with the highest levels ob-served in fall, and lower in winter and spring with the lowest levels in winter. Calculated SSA values were higher in winter and fall, but relatively low in spring and summer. Sheridan et al. (2001) reported similar seasonal variations of aerosol ab-sorption coefficient at the Southern Great Plains Cloud and Radiation Testbed site (SGP CART site), where the light ab-sorption coefficients were higher in the late spring (April) through fall, and also generally lower SSA values were found over the same time period. However, the seasonal variations of aerosol properties observed during the selected period at SDZ were obviously different from those measured at Cape D’Aguilar in Hong Kong (see Table 3), where the highest values of absorption and scattering coefficients were found in winter and fall, and the lowest in summer (Man and Shih, 2001). Man and Shih (2001) attributed such seasonal varia-tions mainly to the large-scale changes in transport of pollu-tants, the northerly wind in winter brought polluted continen-tal air masses while the southern flows in summer contained clean oceanic air masses from the tropics. The reasons for the seasonal variations at SDZ site are complicated, and include the seasonal changes in source emissions, atmospheric trans-port, and chemical transformations. The prevailing wind di-rection shifting over different seasons is probably one of the important factors, as indicated from the wind rose plot of the site (Fig. 3).
In winter (from December 2003 to February 2004), the prevailing winds were from ENE and NE directions, where there were no strong anthropogenic or combustion aerosol sources, and cleaner air masses resulted in the lowest levels of measured aerosols at the site. In spring (from March to May, 2004), the dominant wind directions at the SDZ site were from WSW and SW, and as a consequence, the ad-vection of the air masses from highly populated and pol-luted regions caused the increase of aerosol absorption and scattering coefficients at the site compared to those in win-ter. In summer, although the frequency of winds from NE and ENE direction increased, an equal fraction of the winds still came from the WSW and SW. Crop residue burning frequently occurred after the harvest in this region, and the combination of transport and increased biomass combustion emissions caused the highest absorption coefficient in sum-mer at the site. In fall, the frequency of the WSW wind
Table 2. The statistical results of 24 h average BC mass concentration, absorption and scattering coefficient, and single scattering albedo (SSA) of aerosol during the measurements at SDZ from April 2003 to January 2005 for BC (or aerosol absorption coefficient) and from September 2003 to January 2005 for aerosol scattering coefficient.
BC Concentration (µg/m3) σabsMm−1) σscaMm−1 SSA (at 525 nm)
Mean 2.12 17.54 174.6 0.88 S.D. 1.62 13.44 189.1 0.05 Maximum 10.17 84.23 1381.8 0.97 Minimum 0.035 0.29 4.3 0.65 Median 1.78 14.71 101.6 0.90 Number of days 575 575 461 426
Table 3. Aerosol optical properties at some different sites.
Site Period σabs(Mm−1) σ
sca(Mm−1) SSA Instrumentation References
SDZ, China 2003.9–2005.1 17.54 174.6 0.88 AE31, Magee Scientific, M9003 This work
(rural) Nephelmeter, EcoTech
Lin’an, China 1999.11 23 353 0.93 PSAP, Radiance Research, M903 (Xu et al., 2002)
(rural) Nephelometer, Radiance Research
Yulin, China 2001.4 6 158 0.95 PSAP, Radiance Research, M903 (Xu et al., 2004)
(Gobi desert) Nephelometer, Radiance Research
Cape D’Aguilar, 1997.1–1998.2 25.72 15.79 6.03 64.77 38.65 8.71 PSAP, Radiance Research, M903 (Man and Shih, 2001)
Hongkong Nephelometer, Radiance Research
1998.3–1998.4 18.98 31.22 70.91 96.75 1998.11–1999.2
1998.5–1998.8 1998.9–1998.10
Beijing, China (urban) 1999.6 83 488 0.81 PSAP, Radiance Research, M903 (Bergin et al., 2001) Nephelometer, Radiance Research
Beijing, China (urban) 2003.6–12 0.793 AE14, Magee Scientific (Mao and Li, 2005) Bondville, Illinois 1996.9.19–2000.9.26 4.66±2.27, 57.7±17.7, 0.924±0.0028, PSAP, Radiance Research (Delene and Ogren, 2002) Great Plains, US <10 µm <10 µm <10 µm 3563 Nephelometer, TSI, Inc.
Barrow,Alaska, US 1997.10.6–2000.9.26 0.39±0.41, 9.76±5.20, 0.99±0.48, PSAP, Radiance Research <10 µm <10 µm <10 µm 3563 Nephelometer, TSI, Inc. Southern Great Plain, 1997.4.6–2000.9.26 2.46±1.09, 46.9±16.9, 0.947±0.025, PSAP, Radiance Research Oklahoma, US <10 µm <10 µm <10 µm 3563 Nephelometer, TSI, Inc.
Table 4. The seasonal averages of aerosol absorption and scattering coefficient and SSA (from December 2003 to November 2004).
σabsMm−1 σscaMm−1 SSA (at 525 nm)
Winter 8.89 (10.10) 115.76 (155.27) 0.91 (0.03) Spring 18.27 (14.02) 154.09 (160.10) 0.85 (0.05) Summer 21.21 (12.22) 190.30 (167.52) 0.86( 0.06) Fall 16.73 (11.62) 215.07 (222.91) 0.88 (0.06)
direction decreased and the ENE wind increased, and as a result mean aerosol absorption coefficients were lower in fall than in summer and spring but higher than in winter.
However, in contrast to the aerosol absorption coefficient, the higher levels of aerosol scattering coefficient in the fall could not be satisfactorily explained only by shifts in the wind direction. Another factor that can enhance aerosol scattering coefficients is the chemical production of
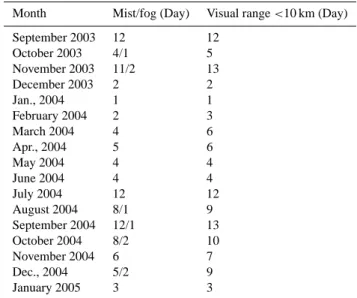
sec-ondary aerosols, either through photochemical reactions or in fogs (visual range <1 km) and mists (1 km<visual range
<10 km). The more frequent occurrence of fogs and mists in the fall period was documented through meteorological observations indicating more foggy (fog and/or mist) days and poorer visibility (visual range <10 km) at the site. Ta-ble 5 shows the number of days with fog/mist and poorer visual range in each month. There were 30 foggy days in the fall (September, October and November) of 2003, and 29 days in the fall of 2004, with 3 fog days in 2003 and 3 fog days in 2004. Under the fog/mist weather conditions the growth and/or heterogeneous production of aerosol was fa-vored and could significantly enhance the observed aerosol scattering coefficients. This can be illustrated in the daily average dataset with the highest daily aerosol scattering co-efficients often found on fog days in fall.
NORTH SOUTH WEST EAST 4% 8% 12% 16% 20% WIND SPEED (m/s) >= 11.1 8.8 - 11.1 5.7 - 8.8 3.6 - 5.7 2.1 - 3.6 0.5 - 2.1 Calms: 3.63% NORTH SOUTH WEST EAST 5% 10% 15% 20% 25% WIND SPEED (m/s) >= 11.1 8.8 - 11.1 5.7 - 8.8 3.6 - 5.7 2.1 - 3.6 0.5 - 2.1 Calms: 15.30% NORTH SOUTH WEST EAST 4% 8% 12% 16% 20% WIND SPEED (m/s) >= 11.1 8.8 - 11.1 5.7 - 8.8 3.6 - 5.7 2.1 - 3.6 0.5 - 2.1 Calms: 3.55% NORTH SOUTH WEST EAST 4% 8% 12% 16% 20% WIND SPEED (m/s) >= 11.1 8.8 - 11.1 5.7 - 8.8 3.6 - 5.7 2.1 - 3.6 0.5 - 2.1 Calms: 7.54%
a
b
c
d
Fig. 3. Wind rose for surface winds at SDZ from December 2003 to November 2004 (plotted with WRPlot View software, http: //www.weblakes.com/lakewrpl.html). (a) Winter (December 2003–February 2004); (b) Spring (March–May 2004); (c) Summer (June– August 2004); (d) Fall (September–November 2004)
3.3 The diurnal variation of aerosol optical properties Figure 4 shows values of aerosol absorption coefficient, scat-tering coefficient, and SSA averaged for each hour of a day during the period from September 2003 to January 2005 as a function of local time. There were clear diurnal variations for all the variables. For the absorption coefficient, low values occurred in the early afternoon (around 13:00), and high val-ues were observed during the night, which reflects the evolu-tion of the boundary layer and its effect on the concentraevolu-tion of pollutants at the site. During the night, as the height of the planetary boundary layer (PBL) decreased, pollutants were entrapped in the lower levels of the atmosphere and caused high concentrations of aerosols at the surface, while during the daytime, as the PBL developed, the turbulent dilution led to a lower concentration of pollutants at the surface in the early afternoon. A local maximum value of the absorption
coefficient appeared in the morning (around 08:00), which corresponds to local emissions of light-absorbing material from human activities surrounding the site. The decrease of aerosol absorption coefficient from the midnight to the early morning (from 00:00 to 05:00) suggests a removal of aerosol particles by dry deposition. A similar diurnal pattern for scattering coefficients was obtained, except that no signif-icant peak around 08:00 corresponding to local human activ-ities was found. Consequently, the diurnal variation of SSA showed the highest values in the afternoon with a maximum at around 14:00, and SSA decreased to a minimum observed at 07:00. This pattern of SSA diurnal variability indicated the enhancement of a light-scattering aerosol loading during the afternoon, which might reflect secondary aerosol production through photochemical processes at the site. Both aerosol absorption and scattering coefficients measured at the SDZ
b
a
c
Fig. 4. Diurnal variability of aerosol optical properties at SDZ from September 2003 to January 2005, error bars represent S.D. (a) Absorption coefficient; (b) Scattering coefficient; (c) Single scattering albedo (SSA).
site showed similar diurnal patterns as those obtained at an-other GAW regional background station in the Yangtze delta region, the Lin’An station in the eastern part of China (Xu et al., 2002).
Further comparisons were conducted for summer and win-ter separately. The diurnal variations of both aerosol scat-tering and absorption coefficients remained similar to those illustrated in Fig. 4 for the entire experiment period. How-ever the morning peak was more significant during the winter time, and it appeared later (about 09:00–10:00) in winter and earlier (∼07:00) in summer compared with those calculated from the entire datasets.
The diurnal patterns during the summer time at the SDZ site were different from those of ozone and other trace gases measured at a mountainous site closer to Beijing during the summer of 2005 (Wang et al., 2006), who obtained higher concentrations of the gases in the afternoon (∼16:00). We suspect that the distance of the measurement site from the heavily-polluted regions probably plays a very important role. In Wang’s measurements, the site was relatively close to the urban area, about 50 km south to the center of
Bei-jing, and only about 15 km southwest to Changping (a satel-lite town of Beijing, with a population of ∼110 000). How-ever, the SDZ site was farther away from the urban area (about 150 km northeast of the Beijing urban area), and there are only limited natural and anthropogenic pollution sources within 30 km range surrounding the site (e.g., the town of Miyun County, with an area of ∼24 km2 and population of
∼146 000 being about 55 km to the south). As our site is on a gentle slope of a small hill, the topography-induced local circulation may have some impact on the transport of the pol-lutants to the site, but the lack of an enhancement of aerosol extinction in the summer afternoon at the SDZ suggests that the upslope flow did not transport much urban pollutants to the measurement site.
3.4 The aerosol optical properties within different air masses
In order to further investigate the effects of different emission sources on aerosol optical properties, a trajectory clustering technique (Stunder, 1996) was applied in the analysis. In this work, we chose the period from December of 2003 to
February of 2004 to represent the winter period and from June to August of 2004 to represent the summer period.
Backward air mass trajectories were calculated using an approach developed by Draxler (1997), and the meteorolog-ical data used were the NOAA global model final analysis archived dataset with a time resolution of 6 h. Backward air mass trajectories were calculated for 36 h back in time at 100 m above the ground.
The cluster-mean value of each parameter was calculated through the formula given below. It is composed of one-hour average data centered at each trajectory start time for all trajectories within that cluster:
Ai =
1
n Xn
jAi,j, i =1, N (3)
where n represents the total number of trajectories in the ith cluster, Ai,j represents the aerosol properties corresponding
to the j th trajectory, and N represents the total number of clusters.
Figure 5 shows the mean cluster trajectories to the site for both the summer (June, July and August, 2004) and win-ter (December, 2003, January and February, 2004) periods. Tables 6 and 7 present the cluster-mean values of aerosol properties for each period respectively. For the summer pe-riod, the cluster analysis had all trajectories grouped into 7 clusters (Fig. 5a). Trajectory clusters labeled #1, #2, and #6 were from the southern sector of the site, and these air masses originated from the more heavily polluted regions. As Table 6 illustrates, cluster #1 was the most frequently ob-served flow pattern to the site in the summer, and the ab-sorption and scattering coefficients of cluster #1 were quite high, with the mean values of 30.2 Mm−1for aerosol
absorp-tion coefficient and 313.2 Mm−1for aerosol scattering
coef-ficient (see Table 6). A similar result was found for clus-ter #2, for which the clusclus-ter-mean absorption coefficient and scattering coefficients were 32.7 Mm−1and 308.7 Mm−1 re-spectively. The SSA for both clusters had the same mean value of 0.89, which was the highest among all the clusters, and also was higher than the average SSA (0.81 and 0.793 respectively, see Table 3) reported for the Beijing urban ar-eas (Bergin et al., 2001; Mao and Li, 2005). The average 36-hour backward trajectory of cluster #1 and cluster #2 in-dicated that the air masses for these two clusters were mainly from the heavily-polluted regions. For instance, the average 36-h backward trajectory for cluster #1 could be traced back to Beijing and its southern outlying areas, and the average trajectory for cluster #2 extended a longer distance (indicat-ing more rapid transport) with the air masses pass(indicat-ing through Beijing, Baoding, and Shijiazhuang, which are all regions with large pollution emissions in northern China.
Cluster #6 represented air masses coming from southeast-erly directions. Along the trajectory pathway, big industrial cities, such as Tianjin and Tangshan, are located within a 200 km range from the site. The 36-h backward trajectory also suggested that the air masses passed over the Shandong
Table 5. The number of days with mist (1 km< visual range
<10 km) and fog (visual range <1 km) and poorer visibility in each
month from September 2003 to January 2005 at the SDZ site.
Month Mist/fog (Day) Visual range <10 km (Day)
September 2003 12 12 October 2003 4/1 5 November 2003 11/2 13 December 2003 2 2 Jan., 2004 1 1 February 2004 2 3 March 2004 4 6 Apr., 2004 5 6 May 2004 4 4 June 2004 4 4 July 2004 12 12 August 2004 8/1 9 September 2004 12/1 13 October 2004 8/2 10 November 2004 6 7 Dec., 2004 5/2 9 January 2005 3 3
Peninsula (one of the rapidly developing regions in China) and could have come across the Bohai sea to influence the site. As a consequence, the mean absorption and scattering coefficients for cluster #6 were the third highest among all the clusters, with a cluster-mean aerosol absorption, scatter-ing coefficient, and SSA of 19.1 Mm−1, 233.4 Mm−1, and
0.89, respectively.
Cluster #3 was the second most frequently observed flow pattern to the site in the summer. The average 36-h backward trajectory of the cluster indicated that the wind speed was weak and the air masses for this cluster originated in regions close to the site because the pathway of the mean trajectory for this cluster was very short. Weak winds were often ob-served during periods of stable atmospheric conditions, and in this case the site was influenced more by local sources and the accumulation of pollutants. The mean absorption and scattering coefficients were 19.0 Mm−1and 117.5 Mm−1, re-spectively, and the SSA was 0.84. The aerosol loading in the atmosphere for this cluster was lower than those with air masses coming from the heavily-polluted regions, such as cluster #1, #2 and #6, but was still rather high compared with those from relatively cleaner clusters, such as clusters #4, #5 and #7.
The clusters labeled #4, #5 and #7 represented the cases influenced by relatively clean air masses at the site according to mean trajectory pathways (Fig. 5a) and the corresponding values of aerosol properties (see Table 6). The absorption and scattering coefficients were significantly lower than the previously discussed clusters, and the SSA for these three clusters ranged from 0.78 to 0.82, which were also signifi-cantly lower than the previously discussed clusters.
Table 6. The mean optical properties for each cluster in summer (June, July and August of 2004).
Cluster No. SSA (at 525 nm) Number of σabsMm−1 Number of σscaMm−1 Number of
trajectories trajectories trajectories
1 0.89(0.04) 106 30.24(15.93) 106 313.22(220.56) 116 2 0.89(0.05) 29 32.67(11.59) 29 308.66(159.49) 31 3 0.84(0.07) 80 18.97(10.69) 82 117.53(98.27) 90 4 0.78(0.08) 36 9.30(8.73) 39 32.56(33.38) 40 5 0.82(0.09) 29 10.11(6.28) 29 49.72(30.36) 29 6 0.89(0.06) 24 19.09(14.74) 24 233.36(200.68) 27 7 0.80(0.10) 17 12.17(10.26) 17 58.60(69.85) 24
Table 7. The mean optical properties for each cluster in winter (December 2003, January and February 2004).
Cluster No. SSA (at 525 nm) Number of σabsMm−1 Number of σscaMm−1 Number of
trajectories trajectories trajectories
1 0.92(0.03) 22 11.70(14.31) 22 154.72(212.33) 23 2 0.91(0.04) 49 9.02(7.98) 49 102.02(108.69) 49 3 0.93(0.03) 14 27.85(20.87) 15 414.57(396.15) 16 4 0.89(0.06) 37 3.76(2.59) 37 35.23(34.84) 37 5 0.91(0.03) 10 16.04(10.82) 16 213.83(198.59) 12 6 0.94(0.01) 19 21.83(13.79) 22 387.93(239.88) 22 7 0.92(0.02) 19 1.96(1.53) 19 23.00(17.15) 21 8 0.91(0.03) 34 2.38(1.56) 34 22.72(13.59) 35 9 0.90(0.03) 21 3.89(3.81) 22 35.53(29.97) 29 10 0.92(0.03) 23 1.50(1.38) 23 18.28(13.80) 24
The above analysis revealed significant differences in aerosol properties among the different clusters in summer. The clusters with the trajectories passing through polluted regions had not only higher absorption and scattering coef-ficients but also higher SSA values, while the clusters with mean trajectories passing through cleaner regions had lower absorption and scattering coefficients and lower SSA. This behavior means that the aerosols coming from the polluted regions were more efficient at scattering light than those coming from clean regions during the summer period.
The average trajectories for each cluster in winter showed different flow patterns from those in summer. The total tra-jectories were clustered into 10 groups (Table 7). The path-way of air masses for clusters #1, #2, #4, and #7–#10 were from the northwest, while the air masses for cluster #3 was from the west, and those for clusters #5 and #6 took curved pathways to the north and south, respectively. According to the map of the site shown in Fig. 1, most cities with dense population and high industrial activities are in the sectors from the west to the southeast direction of the station, thus, clusters #4 and #7–#10 mainly reflect the relatively cleaner air masses at the site, while clusters #3 and #6 indicate the directions affected by air masses coming from polluted re-gions. The cluster-mean aerosol absorption and scattering coefficients are given in Table 7, which demonstrated again
that the aerosol optical properties were tightly related to the pathways of air masses for each cluster. Low cluster-mean aerosol absorption and scattering coefficients were found for clusters #4 and #7–#10, while high aerosol absorption and scattering coefficients were observed for clusters #3 and #6. The pathways for clusters #1 and #2 were very similar. Both passed along the way slightly north to Zhangjiakou city. The cluster-mean levels of aerosol absorption and scattering co-efficients for trajectory clusters #1 and #2 were higher than those of clusters #4 and #7–#10, a probable explanation for this feature was that the air masses of these two clusters were partly influenced by the emissions from the highly polluted city of Zhangjiakou and its surroundings. The pathway for cluster #5 was complicated, as revealed by the 36-h backward trajectory (Fig. 5b). The cluster mean trajectory shows the air masses that originated from the relatively cleaner regions in the northwest, and then passed through more polluted re-gions in the northeast and east, and the mixed influence of the cleaner and polluted air masses resulted in a relatively high level of aerosols at the site as given in Table 7.
Similar to the summer cases, the SSA values in winter were also slightly higher when the air masses were associ-ated with polluted pathways and relatively lower when the air masses were coming from cleaner regions.
# # # # # # # # # # # # # # # # # #
a
b
Fig. 5. The cluster mean 36h backward trajectories for summer and winter periods at SDZ (a) Summer period (June–August 2004), (b) Winter period (December 2003–February 2004).
Table 8. The mass concentration and percentage of selected chemical species in fine particles sampled during the summer period (17 July– 2 August 2004) at SDZ site and some reported results obtained at Beijing urban sites.
Sample No. Mass Conc. NO−3 SO2−4 NH+4 OC EC Ionsa/Mass EC/ Mass OC/Mass SSA
(µg/m3) (µ g/m3) (µg/m3) (µg/m3) (µg/m3) (µg/m3) (%) (%) (%) (at 525 nm) Summer #1 (polluted) 153.89 15.76 57.65 33.99 11.12 1.97 69.8 1.3 7.2 0.94 #2 (polluted) 132.66 16.21 58.72 35.67 6.64 2.59 83.4 2.0 5.0 0.93 #6 (clean) 32.79 4.85 7.15 4.24 4.61 0.89 49.5 2.71 14.1 0.87 #7 (clean) 33.95 2.51 9.69 4.02 3.43 0.76 47.8 2.2 10.1 0.87 #8 (clean) 12.84 0.14 3.20 1.02 1.58 0.29 34.0 2.2 12.3 0.83 #9 (clean) 20.54 2.32 3.50 1.70 3.36 0.86 36.6 4.2 16.4 0.81 Chegongzhuangb, 74.0 4.6 17.1 5.7 13.4 6.3 37.1 8.5 18.0 Beijing BNUc, 73.3 12.2 16.0 10.4 11.5 5.2 52.7 7.1 15.7 Beijing CSc, 82.2 13.3 19.2 11.0 9.3 6.6 52.9 8.0 11.31 Beijing YHc, Beijing 75.4 13.2 19.7 9.8 11.2 5.9 56.6 7.8 14.85 BMEMCd, Beijing 80.3 9.4 4.3 5.4 11.7 aIons=(NO− 3+SO 2− 4 +NH + 4) bHe et al. (2001) cSun et al. (2004) dYu et al. (2006)
Filter sampling was conducted during subsets of the mea-surement period, and limited analyses of aerosol chemical composition and the corresponding aerosol optical proper-ties are presented in Table 8. For comparison, we also list some results of aerosol chemical composition in PM2.5
(par-ticles with aerodynamic diameter less than 2.5 µm) obtained during the summer time at Beijing urban sites in Table 8.
The filter samples were collected at SDZ during the pe-riod from 17 July to 2 August 2004. Among the samples,
the samples #6–#9 were sampled on the “clean” days and the samples #1 and #2 on the polluted days. They repre-sented cases when the site was influenced by polluted or cleaner air masses based on the calculated backward trajec-tories and the mass concentrations of each sample. Table 8 shows that the sum of major light scattering aerosol com-ponents, such as sulfate, nitrate, ammonium and OM (using a factor of 1.4 to estimate the mass of organic matter OM (He et al., 2001; Malm et al., 1994) accounted for 80%–90%
of total mass of PM2.1 (particles with aerodynamic diameter
less than 2.1 µm) for samples collected in polluted days and 51%–69% in cleaner days. Among the major light scattering aerosol components, the sum of sulfate, nitrate and ammo-nium accounted for about 70% or more of total PM2.1mass
when the site was under polluted conditions, and less than 50% for the cleaner days. However, OC fraction was rela-tively small, representing only about 5%–7% of the PM2.1
mass under polluted conditions and 10%–16% of the mass during the cleaner days. Moreover, the ratio of elemental carbon (light absorbing aerosol) to PM2.1mass was relatively
lower when the site was under polluted conditions.
The fractions of OC under polluted conditions were lower than those obtained during the summer time in the Beijing urban areas, although the concentration levels of OC were still comparable to the reported values for the regions (He et al., 2001; Sun et al., 2004; .Yu et al., 2006). Different from OC, however, the fraction of the sum of sulfate, nitrate and ammonium in PM2.5 under polluted conditions was signifi-cantly higher than the reported values for the summer time measurements (He et al., 2001; Sun et al., 2004; see Ta-ble 8). Because OC is an important contributor to aerosol light scattering (Novakov et al., 2005), the lower fraction of OC under polluted conditions suggested that the correspond-ing higher SSAs were mostly due to the high fraction of sec-ondary aerosols with sulfate, nitrate and ammonium in fine particles. On the other hand, when the site was under “clean” conditions, the dominant residential emissions (with more EC being released due to the combustion of coal at lower temperature) in the relatively cleaner regions, such as Inner Mongolia (Cao et al., 2006), result in a relatively higher frac-tion of elemental carbon and lower SSA of aerosols. This analysis is consistent with the results of the trajectory clus-tering analysis that indicated aerosols with air masses from polluted regions had more light scattering ability during the summer time.
It should be noted that the relationship between aerosol SSA and chemical compositions depends on many factors, such as size distributions, shape and mixing state of aerosols (Fuller et al., 1999). To fully understand the variability of SSA with the different air masses, further investigations are still needed.
4 Conclusions
From April 2003 to January 2005, in situ measurements of aerosol optical properties were conducted at a rural site in Northern China, the Shangdianzi Global Atmosphere Watch (GAW) regional station, about 150 km from Beijing. Mean values (standard deviation) of the scattering and absorption coefficients at this rural site in northern China for the entire measurement period were 174.6 Mm−1 (189.1 Mm−1) and 17.5 Mm−1 (13.4 Mm−1), respectively. These values were about one-third of reported value for scattering coefficient
and about one-fourth of that for absorption coefficient ob-tained in the Beijing urban area. The mean SSA for the en-tire period was 0.88 (0.05), which was about 0.07 higher than the value reported by Bergin et al. (2001) for Beijing urban area, and also higher than the value (0.85) in climate mod-eling simulations for China and India performed by Menon et al. (2002). Seasonal variations are observed for different aerosol properties. Both the aerosol absorption and scatter-ing coefficients were lowest in winter, while the highest val-ues appeared in summer for the absorption coefficient and in fall for the scattering coefficient. The mean SSA showed the lowest value in spring (0.85) and highest in winter (0.91).
The trajectory clustering analysis revealed that the scat-tering and absorption coefficients and SSA were all high when the air masses came from the densely populated and highly industrial areas (especially during the summer time). The SSA’s associated with the polluted air masses were not only higher than those with the air masses coming from the “clean” directions, but also higher than the reported values measured at the pollution source regions. This fact sug-gests that there may be substantial secondary aerosol pro-duction during the transport of air masses from polluted re-gions during summer time. To fully understand the exact reasons for these results, further investigations on size distri-butions, chemical compositions, and mixing state of aerosols are needed. Aerosol optical properties measured at this ru-ral area in northern China could serve as a basis for radiative forcing estimation and climate modeling for the region.
Acknowledgements. The authors thank the staff of the SDZ station
for their cooperation during the experiment, and thank P. Sheridan of NOAA/ESRL and R. Draxler of NOAA/ARL for their kind help in the preparation of the manuscript. This work was jointly supported by the China Ministry of Science and Technology Project No. 2001DIA10009, and the China NSF International Project No. 40121120827, and partly supported by the China NSF Project No.40675009.
Edited by: L. Carpenter
References
Akimoto, H. and Narita, H.: Distribution of SO2, NOxand CO2
emission from fuel combustion and industrial activities in Asia
with 1◦×1◦resolution, Atmos. Environ., 28(2), 213–225, 1994.
Anderson, T. L., Masonis, S. J., Covert, D. S., Ahlquist, N. C., How-ell, S. G., Clarke, A. D., and McNaughton, C. S.: Variability of aerosol optical properties derived from in situ aircraft mea-surements during ACE-Asia, J. Geophys. Res., 108(D23), 8647, doi:10.1029/2002JD003247, 2003.
Arnott, W. P., Hamasha, K., Moosmuller, H., Sheridan, P. J., and Ogren, J. A.: Towards aerosol light-absorption measurements with a 7-wavelength aethalometer: Evaluation with a photoa-coustic instrument and 3-wavelength nephelometer, Aerosol Sci. Technol., 39, 17–29, 2005.
Arnott, W. P., Moosmuller, H., Sheridan, P. J., Ogren, J. A., Raspet, R., Slaton, W. V., Hand, J. L., Kreidenweis, S. M., and Collett, J. L.: Photoacoustic and filter-based ambient aerosol light absorption measurements: Instrument comparisons and the role of relative humidity, J. Geophys. Res., 108(D1), 4034, doi:10.1029/2002JD002165, 2003.
Barnard, J. C., Kassianov, E. I., Ackerman, T. P., Frey, S., Johnson, K., Zuberi, B., Molina, L. T., Molina, M. J., Gaffney, J. S., and Marle, N. A.: Measurements of Black Carbon Specific Absorp-tion in the Mexico City Metropolitan Area during the MCMA 2003 Field Campaign, Atmos. Chem. Phys. Discuss., 5, 4083– 4113, 2005,
http://www.atmos-chem-phys-discuss.net/5/4083/2005/. Bergin, M., Cass, G. R., Xu, J., Fang, F., Zeng, L. M., Yu,
T., Salmon, L. G., Kiang, C. S., Tang, X. Y., Zhang, Y. H., and Chameides, W. L.: Aerosol radiative, physical, and chem-ical properties in Beijing during June 1999, J. Geophys. Res., 106(D16), 17 969–17 980, 2001.
Bergin, M., Ogren, J., Schwartz, S. E., and McInnes, L. M.: Evap-oration of ammonium nitrate aerosol in a heated nephelometer: implications for field measurements, Environ. Sci Technol, 31, 2878–2883, 1997.
Bodhaine, B. A.: Aerosol absorption measurements at Barrow, Mauna Loa and the South Pole, J. Geophys. Res., 100, 8967– 8975, 1995.
Clarke, A. D. and Charlson, R. J.: Radiative Properties of the Back-ground Aerosol: Absorption Component of Extinction. Science, 29, 263–267, 1985.
Cao, G., Zhang, X., and Zheng, F.: Inventory of black carbon and organic carbon emissions from China, Atmos. Environ., 40(34), 6516–6527, 2006.
Cooke, W. F., Liousse, C., Cachier, H., and Feichter, J.:
Con-struction of a 1◦×1◦fossil fuel emission data set for
carbona-ceous aerosol and implementation and radiative impact in the ECHAM4 model, J. Geophys. Res., 104, 22 137–22 162, 1999. Delene, D. and Ogren, J. A.: Variability of aerosol optical properties
at four North American surface monitoring sites, J. Atmos. Sci., 59(6), 1135–1150, 2002.
Draxler, R. R.: Description of the HYSPLIT-4 modeling system, NOAA Technical Memo., ERL ARL-224, 1997.
Dubovik, O., Holben, B. N., Eck, T. F., Smirnov, A., Kaufman, Y. J., King, M. D., Tanre, D., and Slutsker, I.: Variability of ab-sorption and optical properties of key aerosol types observed in worldwide locations, J. Atmos. Sci., 59, 590–608, 2002. Fuller, K. A., Malm, W. C., and Kredenweis, S. M.: Effects of
mix-ing on extinction by carbonaceous particles, J. Geophys. Res., 104(D13), 15 941–15 954, 1999.
Hansen, A. D. A., Rosen, H., and Novakov, T.: The Aethalometer – an instrument for the real-time measurement of optical absorp-tion by aerosol particles, Sci. Total Environ., 36, 191–196, 1984. He, K. B., Yang, F. M., Ma, Y. L., Zhang, Q., Yao, X. H., Chan, C. K., Cadle, S., Chan, T., and Mulawa, P.: The characteristics of
PM2.5in Beijing, China, Atmos. Environ., 35, 4959–4970, 2001.
Holler, R., Ito, K., Tohno, S., and Kasahara, M.: Wavelength depen-dent aerosol single-scattering albedo: Measurements and model calculations for a coastal site near the Sea of Japan during ACE-Asia, J. Geophys. Res., 108, 8648, 2003.
Jacobson, M. Z.: Control of fossil-fuel particulate black
car-bon and organic matter, possibly the most effective method of
slowing global warming, J. Geophys. Res., 107(D19), 4410, doi:10.1029/2001JD001376, 2002.
Malm, W.C., James, F.S. and Dale, H.: Spatial and seasonal trends in particle concentration and optical extinction in the United States. J. Geophys. Res., 99(D1), 1347–1370, 1994.
Man, C. K. and Shih, M. Y.: Light scattering and absorption proper-ties of aerosol particles in Hong Kong, J. Aerosol Sci., 32, 795– 804, 2001.
Mao, J. T. and Li, C. C.: Observational study of aerosol radiative properties over China. Acta Meteorologica Sinica, 63(5), 622– 635, (in Chinese with English abstract), 2005.
Menon, S., Hansen, J., Nazarenko, L., and Luo, Y.: Climate Ef-fects of Black Carbon Aerosols in China and India, Science, 297, 2250–2253, 2002.
Moosmuller, H., Arnott, W. P., Rogers, C. F., Chow, J. C., Frazier, C. A., Sherman, L. E., and Dietrich, D. L.: Photoacoustic and filter measurements related to aerosol light absorption during the Northern Front Range Air Quality Study (Colorado 1996/1997), J. Geophys. Res., 103(D21), 28 149–28 157, 1998.
Novakov, T., Menon, S., Kirchstetter, T. W., Koch, D., and Hansen, J. E.: Aerosol organic to black carbon ratios: Analysis of pub-lished data and implications for climate forcing, J. Geophys. Res., 110, D21205, doi:10.1029/2005JD005977, 2005.
Ramanathan, V., Crutzen, P. J., and Kiehl, J. T.: Aerosols, Cli-mate, and the Hydrological Cycle, Science, 294(5549), 2119– 2124, 2001.
Rosenfeld, D.: TRMM observed first direct evidence of smoke from forest fires inhibiting rainfall, Geophys. Res. Lett., 26(20), 3105– 3108, 1999.
Rosenfeld, D.: Suppression of rain and snow by urban and industrial air pollution, Science, 287, 1793–1796, 2000.
Sheridan, P. J., Delene, D. J., and Ogren, J. A.: Four years of con-tinuous surface aerosol measurements from the Department of Energy’s Atmospheric Radiation Measurement Program South-ern Great Plains Cloud and Radiation Testbed site, J. Geophys. Res., 106(D18), 20 735–20 747, 2001.
Streets, D. G. and Carmichael, G. R.: An inventory of gaseous and primary aerosol emissions in Asia in the year 2000, J. Geophys. Res., 108(D21), 8809, doi:10.1029/2002JD003093, 2003. Street, D. G., Gupta, S., Waldhoff, S. T., Wang, M. Q., Bond, T. C.,
and Bo, Y.: Black carbon emission in China, Atmos. Environ., 35, 4281–4296, 2001.
Stunder, B. J. B.: An assessment of quality of forecast trajectories, J. Appl. Meteor., 35, 1313–1331, 1996.
Sun, Y. L., Zhuang, G. S., Ying, W., Han, L. H., Guo, J. H., Mo, D. A. Z. W. J., Wang, Z. F., and Hao, Z. P.: The air-borne particulate pollution in Beijing – concentration, composition, distribution and sources, Atmos. Environ., 38, 5991–6004, 2004.
Takemura, T., Nakajima, T., Dubovik, O., Holben, B. N., and Kinne, S.: Single scattering albedo and radiadive forcing of various aerosol species with a global three dimensional model, J. Cli-mate, 15, 333–352, 2002.
Twomey, S.: The influence of pollution on the shortwave albedo of clouds, J. Atmos. Sci., 34, 1149–1152, 1977.
Wang, T., Ding, A., Gao, J., and Wu, W.: Strong ozone production in urban plumes from Beijing, China, Geophys. Res. Lett., 33, L21806, doi:10.1029/2006GL027689, 2006.
Weingartner, E., Saathoff, H., Schnaiter, M., Streit, N., Bitnar, B., and Baltensperger, U.: Absorption of light by soot particles:
de-termination of the absorption coefficient by means of athalome-ter, J. Aerosol Sci., 34, 1445–1463, 2003.
Xu, J., Bergin, M. H., Greenwald, R., Schauer, J. J., Shafer, M. M., Jaffrezo, J. L., and Aymoz, G.: Aerosol chemical, physical, and radiaitve characteristics near a desert source region of north-ern China during ACE-Asia, J. Geophys. Res., 109, D19S03, doi:10.1029/2003JD004239, 2004.
Xu, J., Bergin, M. H., Yu, X., Liu, G., Zhao, J., Marrico, C. M., and Baumann, K.: Measurement of aerosol chemical, physical, and radiative properties in the Yangtze delta region of China, Atmos. Environ., 36, 161–173, 2002.
Yan, P., Zhang, Y., Yang, D., Tang, J., Yu, X., Cheng, H., Wang, S., Yu, X., Liu, G., and Zhou, X.: Characteristics of aerosol ionic compositions in summer of 2003 at Lin’An of Yangtze Delta Re-gion, Acta Meteorologica Sinica, 20(3), 374–382, 2006. Yu, J., Chen, T., Guinot, B., Casher, H., Yu, T., Liu, W., and Wang,
X.: Characteristics of carbonaceous particles in Beijing during winter and summer 2003, Adv. Atmos. Sci., 23(3), 468–473, 2006.
Zhang, R., Xu, Y., and Han, Z.: Inorganic chemical composition and source signature of PM2.5 in Beijing during Ace-Asia pe-riod, Chinese Science Bulletin, 48(10), 1002–1005, 2003.