HAL Id: hal-01584165
https://hal.archives-ouvertes.fr/hal-01584165
The challenges and opportunities of addressing particle
size effects in sediment source fingerprinting: A review
J. Patrick Laceby, O. Evrard, Hugh G. Smith, Will H. Blake, Jon M. Olley,
Jean P.G. Minella, Philip N. Owens
To cite this version:
J. Patrick Laceby, O. Evrard, Hugh G. Smith, Will H. Blake, Jon M. Olley, et al.. The challenges and opportunities of addressing particle size effects in sediment source fingerprinting: A review. Earth-Science Reviews, Elsevier, 2017, 169 (2), pp.85 - 103. �10.1016/j.earscirev.2017.04.009�. �hal-01584165�
1
The challenges and opportunities of addressing particle size effects in sediment source
2
fingerprinting: a review
3
4 J. Patrick Lacebya*, Olivier Evrarda, Hugh G. Smithb, Will H. Blakec, Jon M. Olleyd, Jean P. G. Minellae
5 Philip N. Owensf
6
7 a Laboratoire des Sciences du Climat et de l’Environnement (LSCE/IPSL), Unité Mixte de Recherche 8212 (CEA/CNRS/UVSQ), Université
Paris-8 Saclay, Gif-sur-Yvette, 91198, France
9 b School of Environmental Sciences, University of Liverpool, Liverpool, L69 7ZT, UK
10 c School of Geography, Earth and Environmental Sciences, Plymouth University, Plymouth, PL4 8AA, UK
11 d Australian Rivers Institute, Griffith University, 170 Kessels Road, Nathan, QLD 4101, Australia
12 e Universidade Federal de Santa Maria, Department of Soils, 1000 Roraima Avenue, 97105-900 Santa Maria, RS, Brazil
13 f Environmental Science Program and Quesnel River Research Centre, University of Northern British Columbia, Prince George, British Columbia,
14 V2N 4Z9, Canada
15
16 Abstract:
17 Tracing sediments back to their catchment sources using biogeochemical and physical fingerprints 18 involves multiple assumptions. One of the most fundamental assumptions is that these fingerprints are 19 consistent during sediment generation, transportation, and deposition processes. Accordingly, the 20 biogeochemical fingerprints used to trace sediment must remain constant, during detachment and 21 redistribution, or they must vary in a predictable and measurable way. One key challenge to this 22 assumption is the sorting effect of particles by size during detachment, mobilization, transportation and 23 deposition processes. Owing to the notable effect of particle size on sediment fingerprints, we believe it 24 is important to review the main approaches used to address the effects of changes in particle size 25 composition on sediment fingerprints. The two main approaches to addressing particle size impacts on 26 fingerprint properties are: fractionation of source and sediment material to a narrow particle size range 27 (e.g. isolation of <10 µm or <63 µm fractions), and concentration corrections (e.g. normalising 28 concentrations by parameters such as specific surface area). These approaches are often used in 29 combination. The utility of fractionation and corrections to address particle size effects has received 30 increasing attention and the relative merits of these procedures have been subject to debate. 31 Accordingly, alternative techniques to address particle size effects in sediment fingerprinting studies are 32 being adopted. For example, a tributary tracing technique or edge-of-field samplers may minimise 33 particle size effects on sediment source fingerprints. The interrelationships between particle size and 34 biogeochemical tracer properties suggest that particle size may also contribute to the formation of 35 contrasts in sediment fingerprints between sources. Indeed, there may be a significant opportunity to 36 derive further sediment source information through comprehensively investigating and unravelling the 37 complexity of particle size–biogeochemical interactions.
38 Key words: Grain size; sediment fingerprinting; composite fingerprinting; sediment tracing; sediment 39 provenance 40 41 *Corresponding author: 42 J. Patrick Laceby 43 Phone: +33 07 82 35 35 48 44 Fax: +33 01 69 82 35 68 45 E-mail: placeby@lsce.ipsl.fr
46
1. Introduction
47 Accelerated soil erosion impacts land and water quality worldwide. Although sediment is a natural 48 component of fluvial systems that provides fundamental structure to riverine landscapes and is essential 49 in many aquatic ecosystems (Vercruysse et al., 2017; Wohl et al., 2015), the excess supply of fine 50 sediment from accelerated soil erosion often degrades riverine and coastal environments (McCulloch et 51 al., 2003; Owens et al., 2005; Walling and Collins, 2016) and contributes to the downstream transfer of 52 particle-bound contaminants (Gateuille et al., 2014; Yamashiki et al., 2014). Elevated suspended 53 sediment loads may also increase the cost of operating and maintaining water treatment and 54 transportation infrastructure (Clark, 1985). Knowledge of the relative contribution of different sources 55 supplying sediment to riverine, lacustrine and coastal systems is a crucial prerequisite to implementing 56 efficient best practices necessary to limit the off-site impacts of excessive sediment delivery (Belmont et 57 al., 2011; Koiter et al., 2013b).
58 One increasingly adopted field-based approach to identifying sources supplying material to riverine, 59 lacustrine and coastal environments is sediment fingerprinting. Tracing sediments back to their primary 60 sources with fingerprinting techniques offers a direct method to identify the nature, location and relative 61 source contribution of sediment transported in waterways. Sediment properties such as mineral 62 magnetic parameters, fallout radionuclides, major and trace element geochemistry, and compound 63 specific stable isotopes (CSSI) have all been used to trace sediment sources (Blake et al., 2012; Caitcheon, 64 1993; Evrard et al., 2011; Hancock and Revill, 2013; Murray et al., 1993b; Walling and Kane, 1984). 65 For properties to be effective tracers of sediment, they must differentiate between sediment sources 66 whilst behaving conservatively (Walling et al., 1993). Conservative behavior is characterized by constancy 67 in sediment properties, where the properties of sediment sources remain constant, or at the very least,
76 1992). Silt and fine sand are thus more subject to detachment and subsequent transport as they are 77 lighter and without bonds binding them to the substrate (Morgan, 2005; Poesen, 1992). Thereafter, the 78 particle size of suspended sediment directly influences settling velocities in aquatic systems (Gibbs et al., 79 1971) resulting in the transport and deposition of suspended sediment being particle size selective 80 (Viparelli et al., 2013; Walling et al., 2000). Fluvial transport, including overland flow, produces changes 81 in the characteristics of the material being transported in comparison to the original source material. In 82 general, the average size of particles decreases, while the degree of sorting and the average roundness 83 increases, with distance travelled. These changes result from a combination of selective transportation, 84 deposition, and particle abrasion, with these processes acting over the entire landscape (Frings, 2008; 85 Krumbein and Sloss, 1951; Le et al., 2015; Moss and Walker, 1978).
86 Not only are sediment transport processes particle-size selective, the properties used to trace sediments 87 may have different affinities to various particle size fractions. For example, fallout radionuclides are 88 preferentially bound to clay minerals owing to the higher number of potential sorption sites (Fan et al., 89 2014; Lomenick and Tamura, 1965; Tamura, 1964). Magnetic minerals occur in soil and sediment as 90 aggregated concretions, discrete fine grains, and particle coatings on very fine grains (Oldfield, 1991; 91 Smith, 1999). Different geochemical elements are contained within the mineral matrix or adsorbed 92 (Stumm and Morgan, 2012). Organic matter may coat grains or be bound within the mineral matrix (Keil 93 and Mayer, 2014; Mayer, 1999). Ultimately, the properties used to trace sediment may have different 94 affinities (e.g. preferential adsorption/absorption) for various particles size fractions that in combination 95 with the selective transport of fine-grained material may affect sediment source fingerprinting results.
96 While there are multiple literature reviews published on sediment source fingerprinting (Collins and 97 Walling, 2002; D’Haen et al., 2012; Davis and Fox, 2009; Guzmán et al., 2013; Haddadchi et al., 2013; 98 Koiter et al., 2013b; Owens et al., 2016; Smith et al., 2013), and a recent emphasis on modelling 99 approaches (Cooper et al., 2014; Haddadchi et al., 2014; Laceby and Olley, 2015; Palazón et al., 2015b; 100 Zhang and Liu, 2016), few studies have investigated the effects of particle size on sediment source 101 signatures (Olley and Murray, 1994; Russell et al., 2001; Smith and Blake, 2014). Here, we review the 102 effects and challenges (section 2), approaches (sections 3 and 4) and opportunities (section 5) of particle 103 size selectivity within the sediment source fingerprinting technique. We mainly focus on riverine 104 environments, specifically particle size selectivity as sediment moves from hillslopes into and through 105 river channels, but the concepts and examples presented are also relevant for similar applications in 106 other aquatic systems such as lakes, reservoirs, estuaries and the coastal zone.
107
2. Sediment Property Predictability
108 Sediment generation, transportation and deposition processes are known to be particle size selective, 109 where fine particles generally have a greater probability of being detached and transported further than 110 coarse particles (McLaren and Bowles, 1985; Walling and Moorehead, 1989). This particle size selectivity 111 often results in potential differences in biogeochemical tracer property concentrations in detached 112 material relative to their sources (He and Walling, 1996; Horowitz and Elrick, 1987). Accordingly, this 113 section will review the impacts of particle size selectivity on a variety of biogeochemical properties used 114 in sediment source fingerprinting research. We focus on some of the main properties – such as fallout 115 radionuclides, carbon and nitrogen parameters, elemental geochemistry and mineral magnetic 116 properties – but recognise that many of the findings are also likely to be relevant to other 117 biogeochemical properties used as fingerprints such as colour parameters and DNA.
118 2.1 Fallout Radionuclides (137Cs, 210Pb ex, 7Be)
119 Caesium-137 (137Cs, T
1/2= 30 y) and excess lead-210 (210Pbex, T1/2= 22 y) have been widely used to
120 determine the relative contributions of sediment from different erosion processes to waterways (Ben 121 Slimane et al., 2016; IAEA, 2014; Matisoff et al., 2002; Owens et al., 2012; Smith et al., 2011; Wallbrink et 122 al., 1998; Walling and Woodward, 1992) (Table 1). As both 137Cs and 210Pbex are concentrated near the 123 soil surface, as they are atmospheric fallout products, sediments eroded from rill or sheet erosion often 124 have high 137Cs and 210Pb
ex activity concentrations (Walling, 2005), whereas sediments eroded from 125 subsoil channel bank or gully erosion processes have low 137Cs and 210Pb
ex activity concentrations 126 (Belmont et al., 2014; Olley et al., 2013; Wallbrink et al., 1999). Comparing 137Cs and 210Pbex in suspended 127 sediments and sediments generated by these different erosion processes generally allows for the 128 relative sediment contributions from these different erosion processes to be ascertained (Ben Slimane et 129 al., 2013; Wallbrink and Murray, 1993; Wallbrink et al., 1999; Walling, 2003).
Table 1: Examples of research utilizing only fallout radionuclides to trace sediment sources (SSA refers to specific surface area).
Reference Country Area (km2) Parameters Particle Size
(µm) Corrections or other approaches to address particle size dynamics Pre-treatment before analysis Raw Data Available
Belmont et al., 2011 United States 2880 10Be, 210Pb
ex, 137Cs <64, <125a SSA -- Yes
Belmont et al., 2014 United States 880 10Be, 210Pb
ex, 137Cs <64, <125a -- -- Yes
Blake et al., 2009 Australia <1 7Be, 210Pb
ex, 137Cs 8 fractionsb Enrichment factors Dispersedc Partiald
Bonniwell et al., 1999 United States 389 7Be, 210Pb
ex, 137Cs -- Ratios -- Yes
Evrard et al., 2010 Mexico 3, 9, 12 7Be, 210Pb
ex, 137Cs -- Sc Comparison -- Partiale
Evrard et al., 2016 Laos 12 7Be, 210Pb
ex, 137Cs <1000 Runoff samplers -- Yes
Foucher et al., 2015 France 24 137Cs <20, 20-50,
50-63, <2000 Th correction, SSA -- Partiale
He and Owens, 1995 United Kingdom 226Ra, 210Pb
ex, 137Cs <2000 SSA -- Yes
Gourdin et al., 2014 Laos 12 7Be, 210Pb
ex, 137Cs <1000 Ratios -- Partiale
Matisoff et al., 2002 United States 70 7Be, 210Pb
ex, 137Cs -- -- --
--Matisoff et al., 2005 United States -- 7Be, 210Pb
ex -- Ratios --
--Murray et al., 1993a Australia -- 137Cs, 226Ra, 232Th <2000 -- --
--Olley et al., 2013 Australia 47-3842 210Pb
ex, 137Cs <10 -- --
--Owens et al., 2012 Canada 135, 215 210Pb
ex, 137Cs <63 SSA --
--Smith et al., 2011 Australia 1.4 210Pb
ex, 137Cs <63 SSA -- Yes
Stout et al., 2014 United States 4,300 10Be, 210Pb
ex, 137Cs <64, <125a SSA --
--Wallbrink and Murray, 1993 Australia <0.001 7Be, 210Pb
ex, 137Cs -- -- --
--Wallbrink et al., 1998 Australia 13500 210Pb
ex, 137Cs <2a -- --
--Walling and Woodward,
1992 United Kingdom 12, 46 7Be, 210Pbex, 137Cs <63 Source correction --
--a Source samples were sieved to a size fraction that matched sediment samples b Fractions: <10, 10-20, 20-40, 40-63,63-125, 125-250,250-500, 500-2000µm c Sonified before sieving prior to analyses
d For outwash sediment sample e Sediments not soils
132 Although they have been used for tracing sediment generated from erosion processes (Wallbrink and 133 Murray, 1996b), beryllium-7 (7Be, T
1/2= 53 d) and 210Pbex are also increasingly used as chronometers of 134 sediment transfers in riverine systems (Bonniwell et al., 1999; Evrard et al., 2016; Gourdin et al., 2014; 135 Mabit et al., 2014; Smith et al., 2014; Taylor et al., 2013). For example, these radionuclides quantify the 136 relative sediment contribution from ‘old’ (7Be-depleted) and ‘new’ (7Be-enriched) sources (Evrard et al., 137 2010; Matisoff et al., 2005). Over longer time scales, additional tracers are capable of providing further 138 chronological information (e.g. 10Be, T
1/2= 1.39 × 10⁶ y) (Belmont et al., 2011; Stout et al., 2014). In
139 particular, Belmont et al. (2014) combined 10Be, 210Pb
ex and 137Cs measurements to demonstrate the 140 potential for over-estimating channel source contributions when there is a moderate amount of 141 sediment exchange between the channel and the floodplain in large watersheds over sediment routing 142 timescales.
143 Research has demonstrated that fallout radionuclides are typically enriched in the fine particle size 144 fractions. For example, He and Walling (1996) reported increasing activity concentrations of 137Cs and 145 210Pbex with increasing specific surface area (SSA) (Figure 1). SSA is closely related to particle size 146 (Horowitz, 1991) and is reported as the total surface area per unit mass (Rawlins et al., 2010). For 147 example, the SSA of sediment increases with decreasing particle size to the extent that the SSA values for 148 clays may be several orders of magnitude greater than silt and sand (Walling and Moorehead, 1989). As 149 fallout radionuclides are preferentially bound to clay minerals owing to the higher number of potential 150 sorption sites (Fan et al., 2014; Lomenick and Tamura, 1965; Tamura, 1964), activity concentrations 151 typically increase with increasing SSA and decreasing particle size (He and Owens, 1995; Wallbrink et al., 152 1999). Although less research has documented the relationship between particle size and 7Be, this fallout 153 radionuclide has also been found to be enriched in fine particle size fractions (Blake et al., 2009; Taylor et 154 al., 2014; Wallbrink and Murray, 1996a). As fallout radionuclides are typically enriched in fine particle
163 the depth-dependent distribution of fallout radionuclides in the soil profile relates to the exposure to 164 fallout and subsequent diffusion and migration processes (Jagercikova et al., 2015). Therefore, fallout 165 radionuclide activity concentrations may decrease with soil depth despite increasing clay content as 166 deeper soil was not exposed to fallout. These exceptions demonstrate the need to understand the 167 relationship between particle size distribution and the tracer property of interest in each study.
168
169 Figure 1: Relationship between specific surface area and fallout radionuclide activity concentrations 170 (137Cs and 210Pb
ex) (adaptation of Figure 1 from He and Walling (1996)). 171 2.2 Carbon and Nitrogen Parameters
172 Although they are not as extensively analyzed in sediment tracing research as fallout radionuclides, 173 carbon and nitrogen parameters provide an interesting example into tracer property relationships with 174 particle size. Total organic carbon (TOC) and total nitrogen (TN) often discriminate between sediment 175 derived from surface and subsoil erosion processes as their concentration decreases with depth in the 176 soil profile (Blake et al., 2006; Owens et al., 2006). Carbon stable isotopes (δ13C) may potentially 177 discriminate between sediment derived from soils with C3 vegetation (majority of tree or temperate 178 grass species) compared to those covered with C4 vegetation (grass and cropping species typically under 179 warmer climates) (Fry, 2006; Schimel, 1993). Source discrimination with nitrogen stable isotopes (δ15N) is 180 more complex. In general, soil δ15N increases with depth in soil profiles (Amundson et al., 2003; 181 Natelhoffer and Fry, 1988). Other factors such as nitrogen inputs from animal and human waste, along 182 with fertilizers and potentially topographic position, may impact the predictability of δ15N in a tracing 183 context. Of note, these parameters trace organic matter (Garzon-Garcia et al., 2017; Olley, 2002) and 184 therefore they may be fractionated by density as well as particle size. Furthermore, these parameters
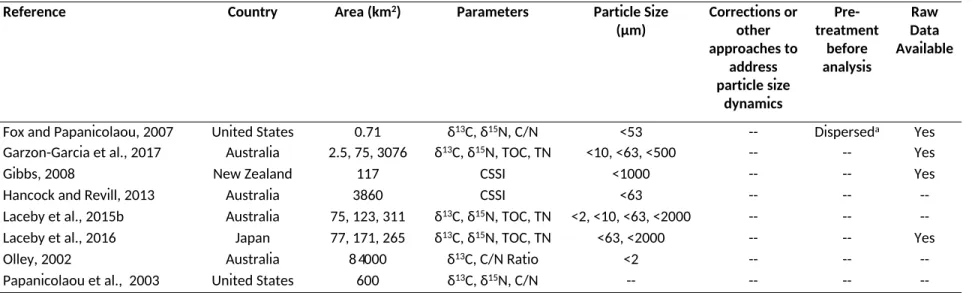
185 also have the potential for non-conservative behavior due to biological uptake and consumption. 186 Nonetheless, these parameters are increasingly used in sediment tracing research (Fox and 187 Papanicolaou, 2007; Laceby et al., 2015b; Mukundan et al., 2010; Papanicolaou et al., 2003) (Table 2). 188 Similarly to fallout radionuclides, TOC and TN are generally enriched in the fine particle size fraction 189 (Balesdent et al., 1987; Wynn et al., 2005). For example, when normalizing the <2, <10, and <63 µm 190 fractions by the bulk soil (<2 mm) fraction, Laceby et al. (2015b) reported that the <63 µm fraction was 191 significantly different than the <2 and <10 µm fractions for TN, though not for TOC, indicating that these 192 similar properties may behave slightly differently in two Australian catchments (Figure 2). Laceby et al. 193 (2016) also reported significant enrichment for TOC and TN between the bulk soil and the <63 µm 194 fraction for subsoils and cultivated sources, though not for forest source samples in several Japanese 195 catchments (Figure 3).
196 More variability is anticipated in the relationship between particle size and δ15N and δ13C (Balesdent et 197 al., 1987; Bellanger et al., 2004). However, Laceby et al. (2015b) reported that there were not significant 198 differences between particle size fractions for δ15N, with very limited δ13C variation across different 199 particle size fractions (Figure 2). Similarly, Laceby et al. (2016) found little variation between the bulk soil 200 fraction and the <63 µm fraction for δ13C, with increasing, though not significant, enrichment for δ15N 201 (Figure 3).
202 Based on the fundamental principles of sediment source fingerprinting, as long as the enrichment is 203 predictable, these organic sediment properties could potentially be effective tracers of erosion 204 processes, particularly in contexts where fallout radionuclides are ineffective. δ15N appears more 205 complex and may be enriched or depleted in the different particle size fractions, which requires 206 investigation on a case by case basis. δ13C apparently behaves very predictably in a sediment tracing
Table 2: Examples of research using only carbon (C) and nitrogen (N) parameters to trace sediment sources
Reference Country Area (km2) Parameters Particle Size
(µm) Corrections or other approaches to address particle size dynamics Pre-treatment before analysis Raw Data Available
Fox and Papanicolaou, 2007 United States 0.71 δ13C, δ15N, C/N
Ratio
<53 -- Disperseda Yes
Garzon-Garcia et al., 2017 Australia 2.5, 75, 3076
333076
δ13C, δ15N, TOC, TN
Ratio
<10, <63, <500 -- -- Yes
Gibbs, 2008 New Zealand 117 CSSI <1000 -- -- Yes
Hancock and Revill, 2013 Australia 3860 CSSI <63 -- --
--Laceby et al., 2015b Australia 75, 123, 311 δ13C, δ15N, TOC, TN <2, <10, <63, <2000 -- --
--Laceby et al., 2016 Japan 77, 171, 265 δ13C, δ15N, TOC, TN <63, <2000 -- -- Yes
Olley, 2002 Australia 84000 δ13C, C/N Ratio <2 -- --
--Papanicolaou et al., 2003 United States 600 δ13C, δ15N, C/N
Ratio
-- -- --
Figure 2: Normalized carbon (C) and nitrogen (N) property distributions for the <2 µm, <10 µm and <63 µm particle size fractions in samples from Knapp Creek and Blackfellow Creek, Australia (modified from Laceby et al., (2015b)). Points under the distributions are the normalized samples color coded to particle size fraction used to derive these distributions with kernel density functions.
Figure 3: Box plots of the normalized difference between carbon (C) and nitrogen (N) sediment properties in the <63 µm fraction divided by the <2 mm fraction for the three sources and sediment from three Japanese catchments (i.e., Mano, Niida and Ota) with red shading (and the red circle) indicating significant differences between the two fractions and values greater than 1 (the dotted line) being enriched in the <63 µm fraction (modified from Laceby et al., (2016)).
214 2.3 Elemental Geochemistry
215 Major and trace elemental geochemistry (including rare earth elements) are often used to identify the 216 different spatial sources of sediment (Hardy et al., 2010; Laceby and Olley, 2015; Vale et al., 2016) (Table 217 3). Different parent rock material typically results in sources having distinct elemental geochemistry 218 (Douglas et al., 2009; Motha et al., 2002; Olley et al., 2001). Eroded sediment often maintain these 219 geochemical fingerprints, allowing the relative contributions of different sources to be ascertained 220 (Caitcheon et al., 2006; D'Haen et al., 2013; Hughes et al., 2009). The question is whether these 221 fingerprints are conservative during sediment generation, transportation and deposition processes. 222 The relationship between particle size enrichment and elemental geochemistry is complex and partly 223 dependent on the digestion procedure (e.g. acid leached versus total digestion) used to prepare samples
224 for analysis (e.g. inductively coupled plasma mass spectrometry (ICP-MS)). The difficulty is that elemental 225 analyses often provide results for over 40 elements (Table 3) whereas the previous sections examined 226 three fallout radionuclides and four carbon and nitrogen parameters. For each of these 40 plus elements, 227 sediment generation, transport and deposition processes may potentially enrich their elemental 228 concentrations, deplete them, or have a limited impact (e.g. Motha et al., 2002; Russell et al., 2001; 229 Smith and Blake, 2014). The impact of particle size selectivity on elemental geochemistry likely will 230 depend on how elements are incorporated into fine sediment (e.g. within the mineral matrix or 231 adsorbed).
232 Underlying the potential influence of particle size on elemental geochemistry is the effect of sediment 233 source mineralogy. The dominant mineralogy relates directly to particle size where some sources will be 234 enriched in the fine particle size fractions and other sources may be depleted. Thus the geochemical 235 fingerprint likely will change if the <2 mm, the <63 µm, or the <10 µm fraction are sampled and analysed. 236 For example, each of the three different sources in Figure 4 from Gibbs (1967) may have different 237 relationships between elemental concentrations and particle size, which will depend on the particle size 238 range utilized for the sediment source fingerprinting research. Fundamentally, the impact of particle size 239 on all elemental concentrations for each source is difficult to predict and the complexity of the particle 240 size – elemental geochemistry relationship requires more research to comprehensively characterize the 241 predictability of these fingerprints. Accordingly, section 4 of this review provides several 242 recommendations for addressing particle size in sediment source fingerprinting research.
Table 3: Examples of sediment tracing research using only elemental geochemistry (e.g. major, trace and rare earth elements).
Reference Country Area (km2) Elements
Analyzed (n) Particle Size (µm) Corrections or other approaches to address particle size
dynamics Pre-treatment before analysis Raw Data Available
Cooper et al., 2015 United Kingdom 5 11 <63 -- Disperseda
--D'Haen et al., 2013 Turkey 264 18 <63 -- Dispersedb
--Douglas et al., 2003 Australia 22000 50 <10 -- --
--Haddadchi et al., 2015 Australia 911 41 <10, 10-63, 63-212 -- --
--Hardy et al., 2010 Canada 12000 55 63-250 Density separation --
--Laceby et al., 2015a Australia 74 37 <10 -- --
--Laceby and Olley, 2015 Australia 75, 123, 311 23 <10 -- --
--Olley and Caitcheon
2000 Australia 650000 10 <10 -- Dispersedc Partiald
Vale et al., 2016 New Zealand 5870 44 <63 -- --
--243 a Source samples sonified before sieving
244 b Samples were boiled in distilled water to disperse soil aggregates
245 c Samples sonified before settling in a water column
Figure 4: Changes in mineralogy with particle size in sediment from three locations in the Amazon basin from Gibbs (1967) with the red dashed line added to indicate the impact of fractionating the samples at the <10 µm particle size.
248 2.4 Mineral Magnetic Properties
249 Mineral magnetic properties (e.g. magnetic susceptibility, isothermal remanent magnetisation) have also 250 been widely used to investigate sediment provenance (Blake et al., 2004; Palazón et al., 2015a; Pulley et 251 al., 2015b; Walling et al., 1979) (Table 4). The signatures derived from magnetic minerals may be 252 classified as primary (i.e. from parent material prior to weathering) or secondary (i.e. from chemical 253 processes and other processes and effects) (Hatfield, 2014). As the signature is often derived from 254 parent material, mineral magnetic properties can trace sediment derived from different spatial sources 255 (Caitcheon, 1993). Owing to the potential impact of secondary processes, such as anthropogenic inputs 256 and diagenetic processes, mineral magnetic properties may also provide further source discrimination 257 between different erosion processes (Foster et al., 1998; Pulley et al., 2015b).
258 Magnetic minerals occur in soil and sediment as aggregated concretions, discrete fine grains and particle 259 coatings on very fine grains (Oldfield, 1991; Smith, 1999). Accordingly, mineral magnetic properties may 260 be highly dependent on particle size (Foster et al., 1998; Oldfield et al., 1985). In particular, Hatfield and 261 Maher (2008) demonstrated the importance of characterizing mineral magnetic properties with a 262 particle-size specific approach as different magnetic properties were preferentially associated with 263 different particle size fractions. These authors demonstrated that bacterial magnetosomes formed in 264 lake sediment in the <2 µm and the 2-8 µm fractions. Accordingly, they only quantified source 265 contributions to the 8-31 µm and 31-63 µm fractions. In contrast, Pulley et al. (2015b) reported 266 significantly different magnetic properties in the <32 µm and the >32 µm fractions and, for Caitcheon 267 (1998), the 63-125 µm fraction was appropriate for tracing tributary source contributions.
268 The challenge is that the particle size fraction driving the mineral magnetic signature may vary for each 269 catchment. For example, the sand and silt fractions may be the most appropriate particle size in 270 catchments in England to quantify sediment sources with magnetic fingerprinting techniques as these 271 fractions have been found to contribute a significant proportion of the mineral magnetic signature 272 (Hatfield and Maher, 2009). Conversely, high magnetic parameters were found in the clay-size particles 273 in the eastern United States (Oldfield et al., 1985). In South Africa, the impact of particle size on mineral 274 magnetic properties was found to be limited in the >32 µm fraction (Pulley et al., 2015b).
Table 4: Examples of sediment source fingerprinting research with only mineral magnetic analyses
Reference Country Area (km2) Magnetic
Parameters (n) Particle Size (µm) Corrections or other approaches to address particle size
dynamics Pre-treatment before analysis Raw Data Available
Blake et al., 2004 Australia 446 9 <10 -- -- Yes
Caitcheon, 1993 Australia 22 2 7 fractionsa Density separation --
--Foster et al., 1998 United Kingdom 1.5, 12 10 11 fractionsb -- Dispersedc
--Hatfield and Mayer, 2009 United Kingdom 240 10 <2, 2-8, 8-31, 31-63, >63 -- Dispersedd
--Oldfield et al., 1985 United States 33 7 10 fractionse -- Dispersedf
--Pulley et al., 2015b South Africa 148-5751 6 7 fractionsg -- Dispersedh
--Slattery et al., 1995 United Kingdom 6 4 <2, 2-16, 16-63 Source correctioni Dispersedj
--Walling et al., 1979 United Kingdom 12 5 -- -- --
--a 7 particle size fractions analyzed: <63, 63-125, 125-250, 250-500, 500-1400, 1400-2000 µm
b Sediment cores: no fractionation, surface soils: <63 µm, soil cores: <2000 µm, and one bulk sediment samples split into 11 fractions c Calgon before dry-sieving to 4 φ and for <4 φ sodium hexametaphosphate and anhydrous Na2CO3 for the bulk sample split into 11 fractions. d Fractionated samples were dispersed with Calgon prior to sonification
e 10 fractions analyzed (1-10 φ) f Dispersed with Calgon
g <32, 32-63, 63-125, 125-250, 250-500, 500-1000, 1000-2000µm h Dispersed with sonification
i Corrected to a standard particle size distribution consisting of coarse silt (50%), fine silt (40%) and clay (10%) J Dispersal method not provided
277 The challenge for mineral magnetic properties, and other sediment fingerprints, is that these properties 278 are related to particle size and this relationship varies from catchment to catchment, subcatchment to 279 subcatchment, and even potentially from event to event. Further, these sediment properties are not 280 only sensitive to changes in their sources, they are also sensitive to changes in sediment transport 281 processes that may impact the potential abundance and availability of the different particle size fractions 282 over a range of spatial temporal scales (Hatfield, 2014).
283 2.5 Composite Fingerprinting Approach
284 Peart and Walling (1986) advocated for multiple parameters to be used when quantifying sediment 285 source dynamics in order to improve the overall consistency and reliability of source ascription results. 286 The combination of multiple parameters creates a composite fingerprint (Walling et al., 1993) that allows 287 for an increased number of sources to be modelled and is theorized to be more representative of the 288 linkages between sediments and their sources, potentially reducing false matches which were 289 hypothesized to potentially occur with individual tracer properties (Collins et al., 1996). Accordingly, a 290 composite fingerprinting approach has been broadly applied in sediment source fingerprinting research 291 combining several or all of the following: fallout radionuclides, carbon and nitrogen parameters, element 292 geochemistry, mineral magnetics and other parameters, thereby providing significant source 293 discrimination (Collins et al., 1996; Evrard et al., 2013; Navratil et al., 2012; Owens et al., 2000) (Table 5). 294 One challenge with the composite fingerprinting approach is that each of the potential complexities 295 within the particle size – tracer parameter relationship described above is integrated into the expanded 296 composite fingerprint. A second challenge is that it is difficult, if not impossible, to link outputs of 297 statistical-based approaches (e.g. composite fingerprinting) back to a process-based understanding of 298 sediment dynamics.
Table 5: Examples of sediment source fingerprinting research using a composite fingerprinting approach incorporating two or more of types of biogeochemical parameters with geochemistry (Geochem), mineral magnetics (Mags), radionuclides (RN), clay mineralogy (Clay min.), diffuse reflectance infrared Fourier transform spectrometry (DRIFTS), X-ray Diffraction (XRD) and other tracers as listed.
Reference Country Area (km2) Parameters Particle Size
(µm) approaches to address Corrections or other particle size dynamics
Pre-treatment before analysis Raw Data Available
Ben Slimane et al., 2013 Tunisia 2.6 RN, C, N <2000 SSA --
--Ben Slimane et al., 2016 Tunisia 0.6-4 RN, C <2000 SSA --
--Blake et al., 2006 Borneo <2 Geochem, N <125 -- --
--Blake et al., 2012 United Kingdom 1.5 CSSI, Geochem, Mags <63 SSAa --
--Caitcheon et al., 2006 Australia 9051 Geochem, RN <10 -- -- Partialb
Collins et al., 1996 United Kingdom 601, 4325 Geochem, RN, C,N -- SSA --
--Devereux et al., 2010 United States 188 Geochem, RN, C <63 -- --
--Douglas et al., 2009 Australia 638 Geochem, RN <10 -- --
--Douglas et al., 2006a Australia 144000 Geochem, Clay Min. <10 -- --
--Douglas et al., 2006b Australia 144000 Geochem, Clay Min. <10 -- --
--Evrard et al., 2011 France 907 Geochem, RN <2000 Sc comparison -- Partialc
Evrard et al., 2013 Mexico 3, 9, 12, 630 Geochem, RN, DRIFTS, C, N, δ13C <250 d50 comparison -- Partialc
Hatfield and Mayer,
--Navratil et al., 2012 France 905 Geochem, RN <63 -- -- Partialc
Owens et al., 2000 United Kingdom 4390 Geochem, RN, Mags, C, N <63 SSA Dispersedd
--Owens et al., 2006 Canada 135, 215 Geochem, Mags, C, N <500 -- --
--Palazon et al., 2015a Spain 1509 Geochem, Mags, RN, C <63 -- -- Partialc
Poleto et al., 2009 Brazil 0.8 Geochem, C <63 SSA --
--Pulley et al., 2015a United Kingdom 1634 Geochem, Mags, RN <63 SSA / None --
--Russell et al., 2001 United Kingdom 1.5, 4 Geochem, Mags, RN, C, N <2, 10, 38, 63 Tracer specific particle size correction factor --
--Tiecher et al., 2016 Brazil 1.2 Geochem, DRIFTS, XRD <63 -- --
--Sherriff et al., 2015 United Kingdom 11 Geochem, Mags <125 -- --
--Smith and Blake 2014 United Kingdom 920 Geochem, RN, C <63 SSA / None --
--Stone et al., 2014 Canada 751 Geochem, C <63 SSA --
--Walling et al., 1993 United Kingdom 12, 46 RN, Mags, C,N <63 source correction None (Mags) and
(FRN)
--
--Walling et al., 1999 United Kingdom 818, 3315 Geochem, Mags, RN,C,N <63 SSA --
--Zhang and Liu, 2016 United States 15.6 Geochem, C,N <53 -- --
--a SSA correction was only used for the composite fingerprinting approach, not the CSSI tracers b Only geochemistry data is available
c Sediments not sources
dDispersed with Calgon and then sonified
e Fractional mass of each sediment size fraction was multiplied by their corresponding source tracer property and summed f Dispersed with sonification
300
3. Main Approaches to Address Particle Size
301 Owing to the potential of particle size to affect the values of tracer properties, researchers have adopted 302 two main approaches to predict or mitigate particle size effects on sediment source fingerprints: 303 fractionation and particle size corrections. Tables 1 to 5 summarize the different approaches used by 304 researchers to address particle size for fallout radionuclides (Table 1), carbon and nitrogen parameters 305 (Table 2), elemental geochemistry (Table 3), mineral magnetic properties (Table 4) and combinations of 306 multiple parameters in a composite fingerprinting approach (Table 5).
307 3.1 Fractionation
308 To address particle size impacts on sediment fingerprint properties, researchers often fractionate both 309 their sediment and source samples to a specific and comparable particle size fraction using settling based 310 on Stokes’ Law or sieving. The objective is to minimize potential sorting-induced differences between 311 source and sediment properties. Conceptually, any particle size fraction can be isolated to attempt to 312 achieve this objective, though it is mainly the <10 µm and <63 µm fractions that have been isolated in 313 sediment source fingerprinting research.
314 The <10 µm fraction is predominantly used in Australia to research the source of very fine silt and clay 315 material. The logic supporting the use of the <10 µm fraction is that it is the dominant size fraction being 316 transported in these river systems and this fraction has the greatest ecological and water quality impact 317 (Douglas et al., 2003; Olley and Caitcheon, 2000). The <10 µm fraction is isolated in settling columns 318 based on Stokes’ Law with assumptions of constant temperature, roundness and density of the particles 319 (Fontaine et al., 2000; Walden and Slattery, 1993).
320 The <63 µm fraction is arguably the most adopted sediment tracing particle size fraction (Devereux et al., 321 2010; Pulley et al., 2015a; Walling et al., 1993). This fraction represents the silt and clay material that is
328 One often overlooked component of addressing particle size is that the fraction isolated should include 329 the range of fingerprint property values in the potential sources. This is particularly important for 330 elemental geochemistry. For example in Figure 4, it is apparent that isolating the <2 µm, <10 µm and <63 331 µm fractions will likely result in different elemental compositions for the three sources based on the 332 particle size fraction selected. This may be particularly important with mineral magnetic tracer 333 properties where different signatures exist in the <32 and the 32-63 µm soil and sediment fractions, 334 indicating that sieving to <63 µm may be inappropriate in some regions (Pulley et al., 2015b).
335 A second overlooked component is that the particle size fraction isolated for sediment property analyses 336 should directly relate to the research objective. For example, researchers have shown that if the 337 objective is to examine the source of material degrading the Great Barrier Reef near Australia, the <16 338 µm particle size fraction should likely be targeted (Bartley et al., 2014). Researchers should support their 339 choice of particle size fraction by relating it to the particle size being transported in the stream system 340 (Wallbrink et al., 1999), or the particle size of the sediment-associated contaminants of interest (Olley 341 and Caitcheon, 2000). For both approaches, there is a trade-off between fractionating down to the finest 342 particle size (e.g. <2 µm) versus using a broader particle size fraction (e.g. <63 µm) that may require 343 more steps to address discrepancies between source and sediment particle size distributions. In some 344 regions, the abundance of material present in the sediment and sources may even control the particle 345 size selected as there may not be sufficient <10 µm or even <63 µm material available for analysis. 346 Indeed, the results from sediment source fingerprinting research will only relate to the particle size 347 fraction examined. If narrow particle size ranges are fractionated (e.g. <2 µm or <10 µm), the results 348 from the source apportionment modelling will only apply to that fraction and not the entire suspended 349 sediment load more generally (Mukundan et al., 2012).
350 Ultimately, the key to using fractionation to address particle size differences is to ensure that the grain 351 size distribution of the source material is similar to that of the sediment sampled (i.e. Poulenard et al., 352 2009). For example, Sherriff et al. (2015) found that the 90th percentile of the suspended sediment 353 distribution for select samples was frequently >63 μm and thus these authors sieved samples to <125 354 µm. Furthermore, it is important to understand the relationship between particles size distribution and 355 event magnitude, and even how this relationship is impacted by seasonality (Bogen, 1992; Lewis, 1996). 356 In this regard, it would be beneficial for fingerprinting studies to report summary statistics for particle 357 size data of both source soils and sediments to present this important comparison. The challenge is that 358 particle size fractionation of samples alone will not necessarily reduce the discrepancy between the
359 fractionated samples (Cooper et al., 2015a; Kersten and Smedes, 2002). If there are significant 360 differences between source and sediment particle size distributions remaining after fractionation, 361 particle size corrections are potentially required.
362 3.2 Particle Size Corrections
363 To mitigate differences in the particle size distributions of source soil and sediment, corrections have 364 been applied based on particle size characteristics of source and sediment material (Collins et al., 1996; 365 Slattery et al., 1995; Walling and Woodward, 1992; Walling et al., 1993) (Tables 1, 4, 5). The initial 366 corrections reconstructed particle size distribution and tracer parameters of the source materials to 367 allow for the direct comparison with the sampled sediment (Slattery et al., 1995; Walling and 368 Woodward, 1992; Walling et al., 1993). The objective of these corrections was to reduce the impact of 369 source and sediment particle size distributions on tracer parameters prior to quantifying source 370 contributions.
371 A second approach to particle size corrections is the incorporation of a within-model weighting (Collins 372 et al., 1996) which has been broadly applied (Collins et al., 2012; Poleto et al., 2009; Stone et al., 2014; 373 Walling et al., 1999). The within-model correction incorporates some variant of a particle size weighting, 374 such as the ratio of the mean SSA in sediment to the mean SSA in each source (Collins et al., 1996; Collins 375 et al., 2010). The logic supporting the use of a SSA derived correction is that particle size and specific 376 surface area are closely related (Horowitz, 1991). Surface area is one of the most important controls on 377 sediment trace element concentrations as the majority of these interactions are postulated to be related 378 to surface area chemistry or surface area reactions (Horowitz and Elrick, 1987).
379 Although widely applied, there are acknowledged limitations and challenges with particle size 380 corrections. Russell et al. (2001) reported a large range in SSA between different sources and sediment 381 for a catchment in the UK and found that a linear-based particle size correction may be inappropriate in
389 Walling and Woodward, 1992). There may even be potential to incorporate particle size properties and 390 organic matter content effects simultaneously with a stepwise multiple regression analysis model 391 (Kraushaar et al., 2015).
Figure 5: Pearson correlation coefficients (r) between Specific Surface Area (SSA) and tracer property for three sources from Smith and Blake (2014) (data from Table 1) with the * indicating fallout radionuclides (137Cs and 210Pb
ex) on the x axis and the remainder being elements. 392
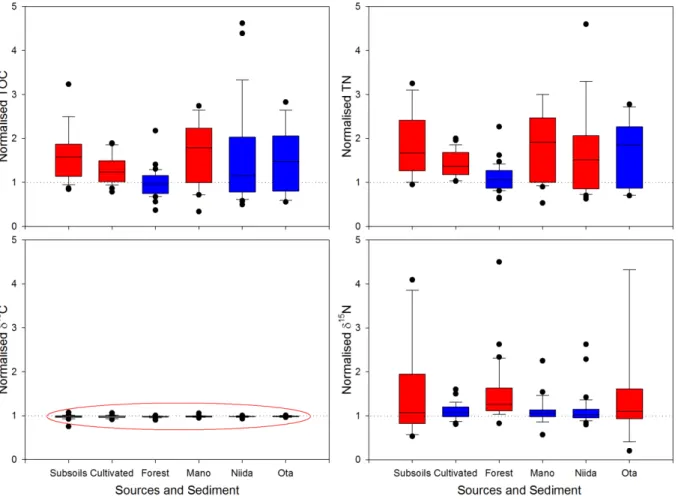
393 The challenge is that there are a variety of non-linear responses between sediment biogeochemistry and 394 particle size (Motha et al., 2002; Russell et al., 2001; Smith and Blake, 2014). There are assumptions with 395 particle size measurements that are often not acknowledged (e.g. all particles are spherical and 396 transported as discrete particles) and there are uncertainties and errors with laser particle size 397 measurements that are not often reported nor propagated into total modelling uncertainty. The impact 398 of these errors varies for different particle size distributions, with a notable increase in instrumentation 399 error with decreasing particle size (Merkus, 2009) (Figure 6). One question for future research is whether 400 or not potential errors on the SSA analysis could result in a substantially different interpretation of the 401 results. Further, stable soil aggregates and agglomerated composite particles that are formed by particle 402 to particle interaction after mobilization (Droppo et al., 2005) may also impact relationships between
403 source and sediment fingerprints. Given the potential uncertainty of accurate SSA ratio-based 404 corrections, researchers often do not apply particle size corrections and instead rely on physical 405 reasoning of sediment transport processes and/or sample fractionation (e.g. Koiter et al., 2013a; 406 Martinez-Carreras et al., 2010).
Figure 6: Relationship between potential sources of error and particle size distribution, adapted from Merkus (2009).
407
408 3.3 Combining Size Fractionation and Corrections Procedures
409 Moving forward, the first step towards addressing particle size should be to fractionate the source and 410 sediment material according to the research question (Table 6), which in turn requires information on 411 the particle size composition of the sediment and/or contaminants in question. Second, the results of 412 this fractionation should be assessed to determine whether the particle size distributions of the source
421 Russell et al., 2001). Understanding the impacts of particle size on tracer properties should be one of the 422 fundamental first steps when trialling new tracer properties in sediment source fingerprinting research.
423
4. Alternative Techniques to Address Particle Size
424 Although particle size fractionation and particle size corrections are the two main approaches used to 425 account for any predictable changes in biogeochemical properties during sediment generation, 426 transportation and deposition processes, the challenges with particle size selectivity have opened up 427 new avenues to explore alternative approaches and research directions.
428 4.1 Tributary (or Confluence) Tracing
429 One approach to mitigating potential particle size impacts on sediment source fingerprinting is to 430 incorporate a tributary tracing or confluence tracing research design (Caitcheon, 1993; Hatfield and 431 Maher, 2008; Laceby et al., 2015a; Olley and Caitcheon, 2000; Vale et al., 2016; Walling et al., 1999). The 432 concept of a tributary tracing approach is that researchers sample sediment in the different upstream 433 tributaries and use these samples as a potential source of sediment sampled further downstream (Figure 434 7). The tributary sampling approach models sediment as a source and a sink, thus removing a significant 435 proportion of the impact of potential particle size enrichment on fingerprint properties. This approach 436 has also been recently applied to a lacustrine environment by Le Gall et al. (2016) who modelled the 437 source of material sampled in the downstream section of a pond in France based on the geochemical 438 properties of deposited sediment in the inlets of the two main tributaries.
439 There may be potential particle size enrichment or depletion impacts on fingerprint properties that may 440 occur during transportation and settling processes, although the most significant particle size enrichment 441 typically occurs during the initial stages of mobilization and transportation that often occurs on hillslopes 442 and in ephemeral systems (Stone and Walling, 1997). As material moves into the riverine system, 443 sediment particle size often becomes increasingly uniform and thus fewer differences may be 444 anticipated. Of course, there are always exceptions. For example, Koiter et al. (2015) used a recirculating 445 flume to demonstrate that it was not only distance travelled that impacted particle size, but also channel 446 bed characteristics such as roughness, porosity and inter-gravel flow. Therefore, the tributary tracing 447 technique may have a limited ability to mitigate particle size impacts where tributaries have distinctly 448 different channel bed characteristics and/or where there is a considerable distance between tributary 449 and downstream sampling sites.
Table 6: Overview of particle size implications at different steps in the sediment source fingerprinting research process
Step Particle Size Implications
1. Research Objective
Fractionate source and sediment material according to the research question The particle size fraction analyzed should relate to the dominant particle size being
transported in the system or the dominant particle size of the sediment-associated contaminant of interest
2. Research Design
Consider the potential impacts of particle size on the research design and the different opportunities available to address and investigate particle size impacts on sediment source fingerprinting results
Consider using a tributary tracing sampling design or edge-of-field samplers to mitigate particle size impacts on tracing parameters
Plan and budget particle size analyses for sediment and source materials to
understand whether or not there are significant impacts of particle size selectivity on the tracer parameters in the study region
3. Sample Processing, Analysis, Modelling
A) Fractionation
Ensure the particle size distribution of the source material is not significantly different than that of the sediment
Consider the potential impact of fractionation (e.g. sieving/settling) on
biogeochemical properties and potential challenges with stable soil aggregates and sediment flocculants
B) Corrections
Consider corrections if fractionation does not remove the differences between source and sediment particle size distributions
Always plot and assess the impact of the corrections on tracer parameters and source discrimination
C) Modelling
Consider modelling different particle size fractions or comparing results with and without corrections on artificial mixtures to truly understand particle size impacts in the study region
5. Results
Present the relationship between particle size and the tracer properties of interest Assess and report on the impact of fractionation and corrections in the results with an
emphasis on any potential impacts on the original basis of source discrimination Present summary statistics for particle size distributions to facilitate comparisons
Figure 7: An example of a sampling design with the tributary tracing technique where the letters indicate the different tributaries that could be sampled in this theoretical catchment. In this situation, sediment collected at sites c, e and g is compared to sediment collected where it may be able to infer which tributaries (i.e. a, b, d or f) were the main sediment sources.
452 The tributary tracing technique may also address potential challenges that arise from variations in tracer 453 properties at the sub-catchment or reach scale. For example, it is conceivable that magnetic properties 454 or elemental concentrations may vary significantly at the subcatchment scale. The tributary tracing 455 approach may capitalize on these variations, incorporating them into contrasts between different 456 sources, in this instance, between different tributaries. A question for future research is what should be 457 the benchmark for indicating that the spatial variability in tracer properties has been sufficiently 458 constrained, let alone the heterogeneity in potential fractionation of different particle sizes?
459 Future research needs to examine the potential of tributary tracing research designs to address particle 460 size enrichment impacts on biogeochemical tracer properties, particularly when comparing sediment 461 sampled instream to material deposited in lakes and reservoirs, and tributaries with different channel 462 bed roughness. Indeed, more research is also required to examine the impact of in-stream sampling 463 approach (e.g. lag deposits, time-integrated samplers, instantaneous samplers, and channel bed-material 464 samplers) on sediment characteristics as different in-stream sampling methods may result in particle size 465 biases that may impact source modelling results. A sampling design with sufficient replication of these 466 different in-stream sampling methods in various catchments around the world may indeed provide 467 further understanding regarding the relationship between particle size and sampling methodology and 468 how the sediment sampling design may impact fingerprint properties and even potentially mixing model 469 results.
470 4.2 Edge-of-Field Samplers
471 An alternative technique that may limit potential particle size effects on biogeochemical tracers during 472 mobilization and initial transportation phases is the installation of edge-of-field samplers (Panuska et al., 473 2008; Wallbrink and Murray, 1993). Edge-of-field sampling approaches capture sediment after the initial 474 mobilization and transport processes and are an alternative technique for examining whether particle
482 The key is to understand the impact of the initial mobilization and transport processes on both particle 483 size and the fingerprinting parameters of interest. For example, Evrard et al. (2016) demonstrated that 484 there was no significant difference between the fallout radionuclide activity concentrations in surface 485 soils, riverine sediments and sediments sampled with edge-of-field samplers in Laos. Conversely, in a 486 lowland and well-drained agricultural catchment in France, Foucher et al. (2015) sampled material in an 487 ephemeral rill during a rainfall event to confirm both the hyper enrichment of fine particles in overland 488 flow (<2 µm) and also to provide confidence that both the SSA- and Th-based corrections were applied 489 effectively. Further research is required to examine the potential of edge-of-field samplers to improve 490 our understanding of particle size impacts on biogeochemical tracer properties and understand how to 491 apply these samplers for a range of complex source types (e.g. unpaved roads and farm tracks). For 492 example, it would be beneficial to compare the impact of tributary sampling technique, an edge-of-field 493 sampling approach and top soil grab sampling on particle size distributions and to investigate whether or 494 not these sampling approaches mitigate particle size effects on biogeochemical tracers.
495 4.3 Multiple Fraction Tracing
496 Another technique to examine differences and potential particle size effects on conservative behavior is 497 tracing different particle size fractions (Caitcheon, 1998; Haddadchi et al., 2015; Laceby et al., 2016). 498 Although there has been a significant amount of research invested into developing particle size 499 corrections (Collins et al., 1996; Russell et al., 2001; Walling et al., 1993), less frequently have the 500 different fractions been traced and the results from tracing different size fractions been examined. 501 Caitcheon (1998) reported that source contributions from a sedimentary rock tributary basin varied only 502 by 13% (i.e. from 63% to 76%) when fingerprinting with mineral magnetic properties from different 503 particle size fractions (<63 µm, 63-125 µm, 125-250 µm and 250 - 500 µm). This author reported that the 504 63-125 µm fraction was most likely representative of the bulk material being transported in this 505 particular catchment. Using elemental geochemistry, Haddadchi et al. (2015) traced the fractionated <10 506 µm, 10-63 µm and 63-212 µm fractions. These authors found that although the maximum difference was 507 high (33%), there was <15% mean absolute difference between modelled source contributions with 508 these fractions (Figure 8). In summary, Haddadchi et al. (2015) indicated that their results highlight the 509 importance of fractionating the particle size most relevant to the management objective of the research.
Figure 8: Mean absolute differences (dashed lines) in the source contributions between the <10 µm and the 10 - 63 µm (blue) and between the <10 µm and the 63 - 212 µm fractions (red) for eight sites in Australia plotted with data from Figure 9 in Haddadchi et al. (2015).
510
511 Laceby et al. (2016) also compared the impact of tracing different particle size fractions for three 512 catchments in the Fukushima region in Japan. These authors compared the relative model difference 513 from tracing the <63 µm and the <2 mm fractions with TOC, TN, δ13C, and δ15N for 76 sediment samples 514 taken in three different catchments (Figure 3). The authors reported a maximum modelled average 515 difference between the <2 mm and <63 µm fraction of 14%, 11% and 7% for the three catchments, and a 516 mean relative difference of only 6% (SD 3%) for all possible modelled source contributions. The limited
525 These fundamental research questions present an opportunity for sediment source fingerprinting 526 research with a focus on methodological sensitivity to particle size effects in different systems. The 527 challenge moving forward will be for researchers to quantify the solid discharge in each particle size 528 fraction in order to compare and model both the relative source contributions (i.e. unweighted) and the 529 absolute source contributions (i.e. weighted by the abundance in each fraction), which could be 530 significantly different.
531
5. Particle Size Opportunities
532 After material is mobilized from sources, sediment fingerprinting researchers often conceptualize 533 riverine systems as a black box, where the processes that occur between source and sediment sampling 534 are not well understood (i.e. Figure 3 in Koiter et al., 2013b). If researchers focus on furthering our 535 understanding of the relationship between particle size and biogeochemical properties, they may 536 simultaneously start to examine processes occurring within this black box. De-convoluting the complex 537 relationship between particle size and biogeochemical properties may provide significant insight into the 538 processes of sediment mobilization, transport and deposition within this black box, including the 539 potential unique behaviour of different sediment source parameters. Accordingly, there are multiple 540 opportunities to advance sediment source fingerprinting research and further our understanding of the 541 complex relationship between particle size and tracer parameter predictability.
542 5.1 Mineralogy, Particle Size and Elemental Geochemistry
543 The most important research objective and opportunity regarding particle size is to increase our 544 understanding of sediment tracer predictability. One approach to improving this predictability is 545 connecting particle size, mineralogy and elemental geochemistry. For example, in Figure 4, there is a 546 clear connection between sediment mineralogy and particle size, which will have direct ramifications for 547 the elemental compositions of sediment sources. Significant advances in sediment source fingerprinting 548 research are likely to be made through connecting these three components. More research into 549 sediment mineralogy may result in novel tracing techniques that are grounded in a logical basis for 550 source discrimination (e.g. Afshar et al., 2016; Bainbridge et al., 2016; Gingele and De Deckker, 2004; 551 Tiecher et al., 2016), that also provide significant information on the complex relationship between 552 particle size and elemental concentrations.
553 Mineralogy was one of the first sediment fingerprinting properties (Klages and Hsieh, 1975; Wall and 554 Wilding, 1975) and returning to incorporate mineralogy more directly into sediment tracing may provide
555 significant insights into particle size impacts on elemental compositions. This may be achieved, although 556 indirectly, through using Diffuse Reflectance Infrared Fourier Transform Spectrometry (DRIFTS) to 557 identify mineralogical groups (e.g. calcite, aluminosilicates, quartz) and discriminate between sediment 558 lithological sources (Poulenard et al., 2012). The use of DRIFTS and other spectroscopy approaches to 559 tracing sediment sources has the potential to develop a strong link to mineralogy and potentially 560 estimate other conventional tracer parameters like texture (Balsam and Deaton, 1996; Ortiz et al., 2009). 561 Other approaches such as clay mineral ratios (e.g. illite/illite + expandable clays) have also shown 562 promise to trace sediment provenance (Bainbridge et al., 2016; Douglas et al., 2006a; Douglas et al., 563 2006b). Connecting clay mineralogy to element geochemistry and particle size will likely provide 564 complementary information relating to each of these fundamental sediment property characteristics. 565 5.2 Elemental Ratios and Elemental Normalisation
566 Moving a step beyond incorporating mineralogy more effectively into sediment tracing research is the 567 potential for incorporating approaches from other disciplines to address particle size effects. For 568 example, in the sediment provenance literature, elemental ratios have long been used to investigate 569 changes in particle size. In particular, the Al/Si ratio is used as a proxy for particle size in sediment 570 provenance research (Figure 9) (Bouchez et al., 2011). Other ratios may indeed be effective, such as the 571 Ca/Al ratio (Chen et al., 2014), along with particle size sensitive elements such as Ti (Bábek et al., 2015), 572 or even simply clay content (Szava-Kovats, 2008). For example, studies reconstructing the evolution of 573 metal enrichment ratios in sediment have also normalized elemental concentrations to Sc, Al, Si, Li or Th 574 to minimize particle size impacts when examining contamination trends (Ayrault et al., 2010; Clark et al., 575 2014; Grosbois et al., 2012; Kersten and Smedes, 2002; Le Cloarec et al., 2011). Indeed, there are 576 multiple approaches from the sediment provenance field (Armstrong-Altrin et al., 2015; Bábek et al., 577 2015; Owens et al., 2016; Singh et al., 2005) that present significant opportunities for enhancing the 578 sediment source fingerprinting technique (e.g. Vale et al., 2016).
586 utility of incorporating ratios directly into the mixing model process to address particle size enrichment. 587 More research is required to examine whether similar approaches may also provide a technique for 588 normalizing particle size effects with frequentist or Bayesian mixing models, or even more insight into 589 the foundation for elemental discrimination between sediment sources. For example, the 590 interrelationships between particle size and biogeochemical tracer properties indicate that particle size 591 may directly contribute to the formation of some contrasts in sediment fingerprints between sources. 592 Accordingly, further advances in understanding these relationships, with experimental designs 593 incorporating different particle size fractions, may provide additional understanding for the basis of 594 discrimination between sediment sources.
595 5.3 Particle Dynamics
596 The nature of cohesive sediment transport, and particularly fine sediment transport, is fundamentally 597 complex where the majority of particles are transported as flocs, or composite particles, that are 598 comprised of organic matter, smaller particles and mineral components with a complex structure 599 (Droppo et al., 2005; Walling and Collins, 2016). The presence of these soil aggregates and sediment flocs 600 will have a significant impact on particle size selectivity during sediment mobilization, transportation and 601 deposition processes (Beuselinck et al., 2000). The behaviour of material during these processes is a 602 function of density, aggregate stability, grain shape and grain size (D’Haen et al., 2012).
603 The impact of grain abrasion and disaggregation on 137Cs concentrations was examined by Dyer and Olley 604 (1999) who reported that the fraction produced by abrasion had essentially similar 137Cs concentrations 605 as the corresponding fraction (<40 µm) in non-disturbed soil. Conversely, Crockford and Olley (1998) 606 found that breakage and abrasion processes had a substantial impact on mineral magnetic properties, 607 reducing concentrations in a granitic soil and increasing concentrations in a sedimentary soil. These 608 authors concluded that a tributary or confluence tracing approach should mitigate the impact of these 609 processes on mineral magnetic properties. Although these studies examined the disaggregation of 610 sediments, Droppo et al. (2005) suggested that the actual nature of aggregates and flocs is rarely 611 considered in studies of sediment transport and sources.