HAL Id: hal-03160838
https://www.hal.inserm.fr/hal-03160838v2
Submitted on 29 Sep 2020
HAL is a multi-disciplinary open access
archive for the deposit and dissemination of
sci-entific research documents, whether they are
pub-lished or not. The documents may come from
teaching and research institutions in France or
abroad, or from public or private research centers.
L’archive ouverte pluridisciplinaire HAL, est
destinée au dépôt et à la diffusion de documents
scientifiques de niveau recherche, publiés ou non,
émanant des établissements d’enseignement et de
recherche français ou étrangers, des laboratoires
publics ou privés.
disease survivors
Aurélie Wiedemann, Emile Foucat, Hakim Hocini, Cécile Lefebvre, Boris
Hejblum, Mélany Durand, Miriam Krüger, Alpha Kabinet Keita, Ahidjo
Ayouba, Stéphane Mély, et al.
To cite this version:
Aurélie Wiedemann, Emile Foucat, Hakim Hocini, Cécile Lefebvre, Boris Hejblum, et al..
Long-lasting severe immune dysfunction in Ebola virus disease survivors. Nature Communications, Nature
Publishing Group, 2020, 11 (1), pp.3730. �10.1038/s41467-020-17489-7�. �hal-03160838v2�
Long-lasting severe immune dysfunction in Ebola
virus disease survivors
Aurélie Wiedemann
1, Emile Foucat
1, Hakim Hocini
1, Cécile Lefebvre
1, Boris P. Hejblum
2,
Mélany Durand
2, Miriam Krüger
2, Alpha Kabinet Keita
3,4, Ahidjo Ayouba
3, Stéphane Mély
5,
José-Carlos Fernandez
1, Abdoulaye Touré
3,4,6, Slim Fourati
7, Claire Lévy-Marchal
8, Hervé Raoul
5,
Eric Delaporte
3, Lamine Koivogui
6, Rodolphe Thiébaut
2,9, Christine Lacabaratz
1,11, Yves Lévy
1,10,11✉
&
PostEboGui Study Group*
Long-term follow up studies from Ebola virus disease (EVD) survivors (EBOV_S) are lacking.
Here, we evaluate immune and gene expression profiles in 35 Guinean EBOV_S from the last
West African outbreak, a median of 23 months (IQR [18–25]) after discharge from treatment
center. Compared with healthy donors, EBOV_S exhibit increases of blood markers of
inflammation, intestinal tissue damage, T cell and B cell activation and a depletion of
cir-culating dendritic cells. All survivors have EBOV-specific IgG antibodies and robust and
polyfunctional EBOV-specific memory T-cell responses. Deep sequencing of the genes
expressed in blood reveals an enrichment in ‘inflammation’ and ‘antiviral’ pathways.
Inte-grated analyses identify specific immune markers associated with the persistence of clinical
symptoms. This study identifies a set of biological and genetic markers that could be used to define a signature of “chronic Ebola virus disease (CEVD)”.
https://doi.org/10.1038/s41467-020-17489-7 OPEN
1INSERM U955 Team 16, Vaccine Research Institute, Faculté de Médecine, Université Paris-Est Créteil, Créteil, France.2Department of Public Health, Inserm
Bordeaux Population Health Research Centre, Univ. Bordeaux, Inria SISTM, UMR 1219, Vaccine Research Institute (VRI), Créteil, France.3TransVIHMI, IRD
UMI 233, INSERM U1175, Montpellier University, Montpellier, France.4CERFIG, Gamal Nasser University, Conakry, Guinea.5Laboratoire P4 Inserm-Jean
Mérieux, US003 INSERM, Lyon, France.6Institut National de Santé Publique (INSP), Conakry, Guinea.7Assistance Publique-Hôpitaux de Paris, Groupe
Henri-Mondor Albert-Chenevier, Laboratoire de Virologie, Créteil, France.8Pôle de Recherche Clinique (PRC), INSERM, Paris, France.9CHU Bordeaux,
Bordeaux, France.10Assistance Publique-Hôpitaux de Paris, Groupe Henri-Mondor Albert-Chenevier, Service Immunologie Clinique, Créteil, France.
11These authors jointly supervised this work: Christine Lacabaratz, Yves Lévy. *A list of authors and their af
filiations appears at the end of the paper.
✉email:[email protected]
123456789
I
n the 2013–2016 West African outbreak, Ebola virus infected more than 28,000 people, causing 11,310 deaths by May 11, 2016, in six countries (Sierra Leone, Liberia, Guinea, Mali,Nigeria, and Senegal)1,2. In the most affected countries,
unpre-cedented follow-up of large numbers of Ebola virus disease (EVD) survivors (EBOV_S) has revealed long-term clinical sequelae. These observations raise questions about the patho-physiology of EVD, the risk of virus re-emergence and patient
clinical care and treatment of EVD3,4.
Two large cohorts of survivors from the West African outbreak
have been reported3–5. Their clinical follow-up revealed symptom
persistence >1 year after acute EVD (Prevail III cohort) or dis-charge from the Ebola treatment center (ETC) (Postebogui cohort). The clinical symptoms recorded during follow-up were predominantly general symptoms, musculoskeletal pain, neuro-cognitive, and ocular disorders.
The incidence of several new systemic symptoms was higher in survivors than in controls over 6 to 12 months of follow-up in the
Prevail III cohort4. Symptom prevalence decreased overall, but
the incidence of uveitis was significantly higher in survivors than in seronegative contacts.
In the Postebogui cohort, long-term follow-up of 802 survivors of the Guinea outbreak provided a temporal description of clin-ical incidence through the reporting of clinclin-ical events up to
600 days post-ETC discharge3. The frequencies of all clinical
symptoms except ocular disorders decreased. Surprisingly, at inclusion, many patients presented symptoms similar to those experienced during acute-phase infection, suggesting the persis-tence or recurrence of a pathogenic process. These studies, and
smaller previous case series6–9, have refined definitions of the
clinical spectrum of post-EVD sequelae.
The symptoms and clinical findings reported for EBOV_S
resemble those of chronic postinfectious and/or immune dys-function diseases. Several hypotheses concerning EVD patho-genesis have been proposed based on the persistence or increase in incidence of clinical disorders long after acute Ebola
infection10.
The immune responses of EVD patients have been reported during acute-phase infection or soon after the resolution of
infection11–17. These studies identified immune signatures
asso-ciated with death from EVD rather than survival. Fatal EVD was characterized by high inflammatory marker levels and a high viral
load12,16,17. Conversely, survivors had significantly lower levels of
inflammation15 and robust EBOV-specific T cell responses12.
Persistent immune activation and weak CD8+EBOV-specific T
cell responses were detectable for up to 46 days after viral
clearance from plasma13.
In this study, we took advantage of the long-term follow-up of EBOV_S, for detailed analyses of inflammatory, immune func-tional and phenotypic characteristics, and gene expression pat-terns, up to 2 years after acute EVD. Comparing these profiles with those of noninfected healthy donors (HDs), we found that EBOV_S continue to display severe abnormalities of immune function and persistent EBOV-associated immune activation.
Results
EBOV_S exhibit persisting symptoms and EBOV-specific
immunoglobulin G (IgG). We enrolled 35 EBOV_S, with a median age of 30 years (interquartile range (IQR): 25–36) in this study. Median [IQR] time between ETC discharge and enroll-ment was 23 months [19–25]. No EBOV-RNA was detectable in the blood at the time of sampling. RealStarFilovirus Screen reverse transcription polymerase chain reaction (RT-PCR) and
GeneXpert assay did not detect EBOV in body fluids of these
patients after inclusion in our study3,18.
The enrolled individuals received only supportive care (no experimental drugs and no convalescent plasma) during the acute phase of EBOV infection and were seronegative for human immunodeficiency virus, hepatitis C virus, and hepatitis B virus. On inclusion in Postebogui cohort, 23 of the 35 patients (66%)
had post-EVD symptoms similar to those for the whole cohort3
(Table1and Supplementary Fig. 1). More precisely, we looked at
the clinical signs of n= 34 EBOV_S, at the harvest time (visit 0,
V0) of this immunological study, within 1 month (M1), and within 3 months (M3). At V0, 16/34 EBOV_S experienced at least one symptom with the following distribution: general symptoms (fatigue, anorexia, fever, pallor, abdominal pain, and pelvic pain)
(n= 14), musculoskeletal symptoms (arthralgia and myalgia)
(n= 4), neurological symptoms (headache, insomnia, vertigo, and
sensory disorders) (n= 10), and ocular symptoms (conjunctivitis,
ocular disorders, and ocular pain) (n= 2). Within M1, 18/34
experienced at least one symptom. These symptoms were general
signs (n= 16), musculoskeletal symptoms (n = 7), neurological
symptoms (n= 12), and ocular symptoms (n = 2). Within M3,
27/34 EBOV_S experienced at least one symptom. More
precisely, n= 23 patients experienced a general symptom, n =
13 patients a musculoskeletal symptom, n= 20 patients a
neurological symptom, and n= 3 patients an ocular symptom
(Supplementary Fig. 2).
The median mean fluorescence intensity (MFI) [IQR] of
EBOV-specific antibodies was 3341 [1365–7154], 930 [548–1621], 640 [413–919], and 1288 [649–2328] against NP, GP-Kissidou-gou, GP-Mayinga, and VP40, respectively. By contrast, none of the serum samples from HDs tested positive for these antibodies (Supplementary Fig. 3). Thus, 23 months after EVD infection, EBOV_S had EBOV-specific IgG.
Chronic activation and microbial translocation in EBOV_S. Twenty-two markers of inflammation and immune activation were evaluated using a 22-Plex Assay Kit measuring cytokine release syndrome-associated inflammatory cytokines. Five of the 22 soluble mediators quantified in the serum were present at significantly higher levels in EBOV_S than in controls. Median
Table 1 Characteristics of survivors and healthy donors.
HD EBOV_S P value
No. of participants 39 35 N/A
Median age (years) 25 [21–36] 30 [25–36] 0.2
Sex (male) 31 (80%) 19 (54%) 0.03
Median time from ETC discharge to inclusion (months)
N/A 23 [19–25] N/A
EBOV RT-PCRa N/A Negative (100%)
Clinical eventsb
All symptoms N/A 23 (66%) N/A
Joint pain N/A 13 (37%) N/A
Fatigue N/A 12 (34%) N/A
Ocular disorders N/A 6 (17%) N/A
Headache N/A 6 (17%) N/A
Muscle pain N/A 5 (14.3%) N/A
Fever N/A 4 (11.4%) N/A
Abdominal pain N/A 2 (5.7%) N/A
Anorexia N/A 1 (2.8%) N/A
The differences between healthy donors (HDs) and survivors (EBOV_S) were evaluated in nonparametric Mann–Whitney U tests or χ2test. Median values ± IQR are shown. Source data
are provided as a Source Datafile.
aBlood samples were taken from patients enrolled in the Postebogui cohort. Before PBMC and
serum freezing, EBOV RT-PCR was performed on each sample to exclude the presence of EBOV in the blood.
bSymptoms andfindings on physical examination for the EBOV_S on inclusion in the Postebogui
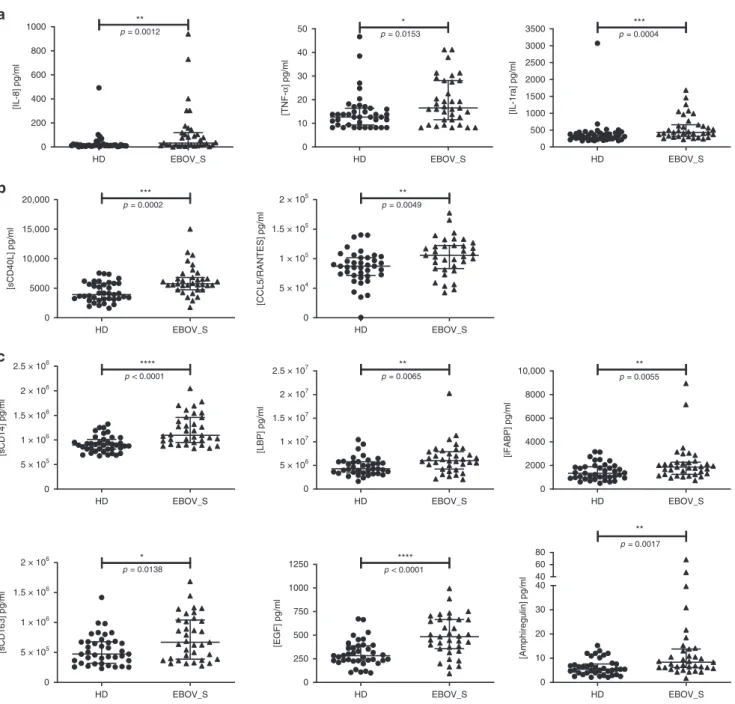
[IQR] pro-inflammatory cytokine concentrations were 33 pg/ml [15.9–118.9] vs. 14 pg/ml [9.8–21.6] (p = 0.001, for the Mann–Whitney U test) for interleukin-8 (IL-8) and 16.5 pg/ml [11–28] vs. 12.6 pg/ml [9.3–16.4] for tumor necrosis factor-α (TNFα) (p = 0.015, for the Mann–Whitney U test). For the anti-inflammatory cytokine IL-1 receptor antagonist (IL-1RA), median [IQR] concentrations were 433.8 pg/ml [315–657] vs. 327.9 pg/ml
[221–419] (p = 0.0004) (Fig. 1a). The T cell function markers
soluble CD40L (sCD40L) and CCL5 were also present at sig-nificantly higher levels in survivors than in HDs (p = 0.0002 and
p= 0.005, for the Mann–Whitney U tests, respectively) (Fig.1b).
The persistence of markers of chronic activation in the blood of survivors suggested possible microbial translocation from a leaky
gut, as described in other chronic infectious diseases19,20. Seven
markers of gut tissue integrity21,22were also evaluated either by
Luminex technology or enzyme-linked immunosorbent assay (ELISA). Survivors had significantly higher levels of soluble CD14 (p < 0.0001, for the Mann–Whitney U test),
lipopolysaccharide-binding protein (LBP) (p= 0.007, for the Mann–Whitney U test),
intestinal fatty acid-binding protein (iFABP), a marker of gut
epithelial damage (p= 0.006, for the Mann–Whitney U test), and
soluble CD163, a specific marker of monocyte/macrophage
activation (p= 0.014, for the Mann–Whitney U test) (Fig. 1c).
Consistently, epidermal growth factor (EGF), a secreted gastric
protection protein23was also present at higher levels in EBOV_S
than in HDs: 483.6 pg/ml [356–665] vs. 282.6 pg/ml [230–388] (p < 0.0001, for the Mann–Whitney U test). The EGF-like molecule, amphiregulin, was also present at higher levels in EBOV_S: 8.4 pg/ml [6.2–13.8] vs. 5.45 pg/ml [4–7.7] (p = 0.001,
for the Mann–Whitney U test) (Fig.1c).
0 200 400 600 800 1000 ** [IL-8] pg/ml p = 0.0012 0 10 20 30 40 50 [TNF-α ] pg/ml p = 0.0153 * 0 500 1000 1500 2000 2500 3000 3500 [IL-1ra] pg/ml p = 0.0004 *** 0 5000 10,000 15,000 20,000 [sCD40L] pg/ml p = 0.0002 *** 0 5 × 10⁴ 1 × 10⁵ 1.5 × 10⁵ 2 × 10⁵ [CCL5/RANTES] pg/ml p = 0.0049 ** 0 5 × 10⁵ 1 × 10⁶ 1.5 × 10⁶ 2 × 10⁶ 2.5 × 10⁶ **** p < 0.0001 [sCD14] pg/ml 0 5 × 10⁶ 1 × 10⁷ 1.5 × 10⁷ 2 × 10⁷ 2.5 × 10⁷ p = 0.0065 ** [LBP] pg/ml 0 2000 4000 6000 8000 10,000 p = 0.0055 ** [iFABP] pg/ml 0 5 × 10⁵ 1 × 10⁶ 1.5 × 10⁶ 2 × 10⁶ p = 0.0138 * [sCD163] pg/ml 0 250 500 750 1000 1250 [EGF] pg/ml p < 0.0001 ****
HD EBOV_S HD EBOV_S HD EBOV_S
HD EBOV_S HD EBOV_S
HD EBOV_S HD EBOV_S HD EBOV_S
HD EBOV_S HD EBOV_S HD EBOV_S
0 10 20 30 40 40 60 80 ** p = 0.0017 [Amphiregulin] pg/ml a b c
Fig. 1 Quantification of serum-soluble mediators differentially expressed in HDs and EBOV_S. Measurement of serum-soluble mediators (pg/ml) from
n = 39 HDs and n = 35 EBOV_S with the Bio-Plex 200 SystemTM(Bio-Rad). Pro-inflammatory and anti-inflammatory cytokines (a). Markers of T cell
function (b). Markers of gastric tissue integrity (c). The differences between HDs and EBOV_S were evaluated in nonparametric Mann–Whitney U tests.
Immune cell subset frequencies are changed in EBOV_S. Cell phenotyping on blood from survivors (representative data,
Sup-plementary Fig. 4) showed a higher frequency of total CD8+
T cells among CD3+cells (p= 0.0004, for the Mann–Whitney U
test) and higher levels of activated CD8+T cells (CD8+HLA-DR
+CD38+) (p= 0.01, for the Mann–Whitney U test) than in
controls (Fig. 2a). Total CD19+B cell frequency was similar in
the two groups, as was the frequency of plasmablasts (data not shown), but the frequencies of activated memory and exhausted B
cells were higher in EBOV_S (p= 0.006 and p < 0.0001, for the
Mann–Whitney U tests, respectively) (Fig. 2b). Previous reports
have shown a depletion of T and natural killer (NK) cells during
EBOV infection24,25. We found here, 23 months after ETC
dis-charge, a trend towards lower total NK cell frequencies in EBOV_S, and a significant downregulation of the expression of
the activation marker NKG2D relative to controls (p= 0.004, for
the Mann–Whitney U test). Moreover, the frequency of
non-classical CD56−CD16+NK cells remained high in EBOV_S (p <
0.0001, for the Mann–Whitney U test) (Fig.2c). Previous studies
suggested that antigen-presenting cells are initial targets to
EBOV26,27. Blood analysis revealed a severe deficit of total
den-dritic cells (DCs) (HLA-DR+, Lin−) (p= 0.01, for the
Mann–Whitney U test), mostly due to a deficit of plasmacytoid
DCs (pDCs) (HLA-DR+/Lin−/CD45RA+/CD123+) (p= 0.006,
for the Mann–Whitney U test), whereas conventional DC (cDC) levels remained in the normal range. Higher levels of expression
were observed for the activation marker CD40 in both cDCs (p=
0.03, for the Mann–Whitney U test) and pDCs (p = 0.02, for the Mann–Whitney U test), with higher levels of HLA-ABC
expres-sion in pDCs (p= 0.02, for the Mann–Whitney U test) (Fig.2d).
We also evaluated frequency of monocytes using CD14+ and
CD16+ markers. Classical (CD14++CD16−) and nonclassical
(CD14+CD16++) monocytes were not significantly different
between the two groups (data not shown). However,
pro-inflammatory intermediate monocytes (CD14++CD16+) were
significantly increased in EBOV_S as compared to HDs (p =
0.003, for the Mann–Whitney U test) (Fig.2e).
EBOV_S have robust EBOV-specific memory T cell responses. Characterization of EBOV-specific T cell responses in Ebola infection are still limited and most of the studies evaluated these responses either during the acute or the recovery phase of EBOV
infection comparing EBOV_S and fatal cases11–17. We assessed
whether EBOV-specific T cells would become detectable after antigen-specific in vitro T cell expansion. A high frequency of
functional CD4+ and CD8+ T cells producing cytokines in
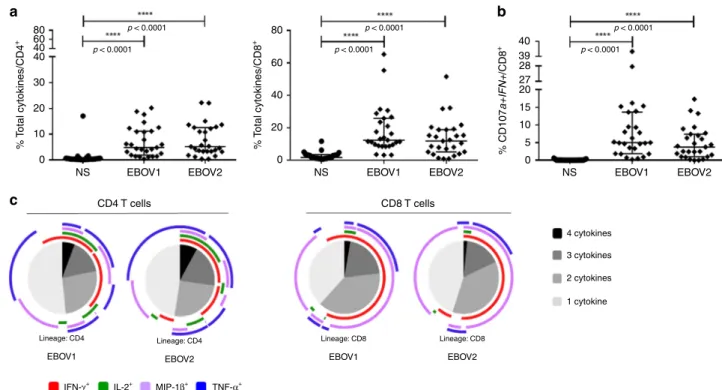
response to various EBOV peptides was detected in survivors.
Median frequencies [IQR] of CD4+and CD8+cytokine+-specific
T cells were 4.89% [1.93–11.2] and 12.4% [8.9–25.9], respectively, for the EBOV1 peptide pool and 5.18% [3.4–12.6] and 11.8% [5.1–19], respectively, for the EBOV2 peptide pool (p < 0.0001
for all comparisons to nonstimulated conditions, for
the Friedman’s test) (Fig. 3a). EBOV stimulation elicited
IFN-γ-positive (IFN-γ+), TNF+, macrophage inflammatory
protein-1β-positive (MIP-1β+) and IL-2+CD4+T cells (p < 0.0001, for each
cytokine, for the Friedman’s test) and IFN-γ+, TNF+, MIP-1β+
CD8+T cells (p < 0.0001 for each cytokine, for the Friedman’s test)
(Supplementary Fig. 5a). EBOV-specific CD8+T cells expressing
the cytotoxicity markers CD107a and IFN-γ after peptide stimu-lation were also detected at high frequency (p < 0.0001, for all
sti-mulation conditions, for the Friedman’s test) (Fig. 3b). A large
proportion of the EBOV-specific CD4+ and CD8+ T cells were
polyfunctional, producing up to four cytokines simultaneously
(Fig.3c). As a control, we also evaluated EBOV-specific responses
in seven HDs with peripheral blood mononuclear cells (PBMCs)
available in the same conditions as used for EBOV_S. We did not detect significant specific responses against the peptide pools (EBOV1 and 2) compared to nonstimulated culture conditions.
Similarly, EBOV-specific CD8+ T cell expressing the cytotoxicity
markers CD107a and IFN-γ were not significantly detected after peptide stimulation (Supplementary Fig. 6).
Enrichment in inflammation and antiviral pathways in EBOV_S. An analysis of whole-blood gene expression profiles (26 EBOV_S and 33 HDs) revealed differential expression for 1024 genes. Ingenuity Pathway analysis showed 556 annotated genes (112 upregulated and 444 downregulated in survivors) defining
the cluster of survivors (Fig. 4a). The differentially expressed
genes characteristic of survivors included genes involved in immune responses: IFN signaling, the complement system, acute-phase response signaling and pattern recognition receptors
(PRRs) (Fig.4b). EBOV_S displayed a clear upregulation of genes
relating to the antiviral response involving IFN signaling (IFIT1, IFI6, IFIT3, ISG15, OAS1, IFITM3, and MX1), the complement system (C4BPA, SERPING1, C1QC, C1QB, C1QA, C2), and PRR (C1QA, C1QB, C1QC, IL10, OAS1, OAS3, PRKD1) signaling
pathways (Fig.4c).
Immune markers associated with clinical symptoms. Associa-tion between the various markers has been explored through several approaches. First, a principal component analysis (PCA) and Spearman’s correlation matrix were performed to better illustrate the interrelationships between phenotypic, seric, and
genetic markers. As shown in Fig.5a, thefirst two components of
the PCA explained 35% of the variability of the markers. Inter-estingly, when representing the distribution of the individuals
according to their clinical status (EBOV_S or HDs), the first
component separated quite well the two groups (Fig. 5b),
although this analysis was unsupervised since the clinical status information was not used to construct the components. When looking at the contribution of markers over the two components,
clearly, the first component separated total DCs and pDCs
(projected on the left) from inflammatory markers (projected on the right). These results are consistent and extended data from
the Spearman’s correlation matrix (Fig. 5c) showing that
inflammatory markers were positively correlated themselves and also with phenotypic markers (such as exhausted B cells, CD40
+DC, CD38+HLA-DR+CD8+activated T cells) and seric
mar-kers (such as IL-8, soluble CD14 (sCD14), and T cell activation markers CCL5 and sCD40L), for example, and inversely corre-lated with frequencies of blood total DC and pDC populations. A projection of the selected genes differentially expressed between EBOV_S and HDs on the same plan showed that all IFN sig-naling genes aggregated with the inflammatory markers, whereas
the downregulated genes C1S, FGFR4, and MASP2 (Fig. 4c)
appeared on the total pDC side (Fig.5d).
Second, we looked at the distribution of immunological markers identified above according to the presence of clinical symptoms using Wilcoxon’s rank-sum statistical test (without test multiplicity correction in this explanatory analysis). At V0 time point, we found that EBOV_S with symptoms exhibited a lower frequency of blood pDCs as compared to those without symptoms (median 0.2% IQR [0.16–0.25] vs. 0.38% [0.26–0.43]; p = 0.005). A trend (p = 0.06) for an association with a higher frequency of the nonclassical CD56
−CD16+ NK cell population (16.1% [9.32–23.12] vs. 9.06%
[3.7–14.2]) was noted. These associations at V0 time point were still significant within M1, where individuals with symptoms were those with low and high frequencies of pDCs (0.2%
[0.15–0.25] vs. 0.38% [0.28–0.42]; p = 0.007) and CD56−CD16+
respectively. A trend (p= 0.04) toward a decrease of sCD163 (583.4 ng/ml [375.44–836.45] vs. 880.06 ng/ml [595.34–1182.4]) levels was noted in individuals with symptoms within M1. The independent association of each of these markers (i.e., pDCs,
CD56–CD16+, and sCD163) with the presence of symptoms was
confirmed by a multivariable logistic regression model (all p values <0.02) with a reasonable goodness-of-fit statistics (Hosmer and
Lemeshow test: p= 0.11) (Supplementary Fig. 7).
0 20 40 60 80 100 % LT CD4 +/CD3 + p = 0.0019 ** 0 20 40 60 80 % LT CD8 +/CD3 + p = 0.0004 *** 0 1 2 3 4 7.5 8.0 * % CD38 +HLADR +/CD8 + p = 0.0121 0 5 10 15 % CD19 + 0 5 10 15 20 25 % Activated memory B cells/CD19 + p = 0.0057 ** 0 5 10 15 20 25 % Exhausted B cells/CD19 + p < 0.0001 **** 0 20 40 60 80 % NK 0 20 40 60 80 100 120 % NKG2D/NK p = 0.0041 ** 0 10 20 30 40 50 % CD56 –CD16 +/NK p < 0.0001 **** 0 10 20 30 40 50 % Intermediate monocytes (CD14 ++ CD16 +) p = 0.0030 ** 0.0 0.5 1.0 1.5 2.0 2.5 % Total DC p = 0.0136 * 0.0 0.5 1.0 1.5 % Total cDC 0.0 0.5 1.0 1.5 % Total pDC p = 0.0057 ** 0 5000 10,000 15,000 20,000 MFI HLA-ABC/pDC p = 0.0205 * 0 20 40 60 80 100 % CD40/cDC p = 0.0285 *
HD EBOV_S HD EBOV_S HD EBOV_S
HD EBOV_S HD EBOV_S HD EBOV_S
HD EBOV_S HD EBOV_S HD EBOV_S
HD EBOV_S
HD EBOV_S HD EBOV_S HD EBOV_S
HD EBOV_S HD EBOV_S HD EBOV_S
0 20 40 60 80 100 % CD40/pDC p = 0.0206 * a b c d e
Fig. 2 Modifications in immune cell subset frequencies in EBOV_S. Cumulative T cell frequency and CD8 T cell activation analyses (a), B cell subsets (b),
NK cell subsets (c), dendritic cell subsets and activation (d), and monocyte subsets (e) fromn = 34 EBOV_S and n = 39 HDs. DC gating strategy is shown
in Supplementary Fig. 4. The differences between HDs and EBOV_S were evaluated with nonparametric Mann–Whitney U tests. Median values ± IQR are
80 p < 0.0001 p < 0.0001 p < 0.0001 p < 0.0001 p < 0.0001 p < 0.0001 80 40 39 27 28 20 15 10 5 0 60 40 20 0 60 40 40 30 20 10 0 NS EBOV1 CD4 T cells c a b CD8 T cells 4 cytokines 3 cytokines 2 cytokines 1 cytokine EBOV1
IFN-γ+ IL-2+ MIP-1β+ TNF-α+ Lineage: CD4 EBOV2 Lineage: CD4 EBOV2 Lineage: CD8 EBOV1 Lineage: CD8
EBOV2 NS EBOV1 EBOV2 NS EBOV1 EBOV2
% T otal cytokines/CD4 + % T otal cytokines/CD8 + % CD107 a+IFN+ /CD8 +
Fig. 3 Robust and polyfunctional responses in EBOV_S. EBOV GP-specific CD4+T cell (left panel) and CD8+T cell (right panel) responses of EBOV_S
(n = 27) after 9 days of EBOV GP-specific (EBOV1 and EBOV2 peptide pools) T cell expansion in vitro (all cytokines) (a). Analysis of the co-expression of
CD107a and IFN-γ by EBOV GP-specific CD8 T cells from EBOV_S (n = 27) after 9 days of antigen-specific T cell expansion in vitro (b). Median values ±
IQR are shown, and Friedman’s test was used for comparisons. Functional composition of EBOV GP-specific CD4+and CD8+T cell responses (c).
Responses are color coded according to the combinations of cytokines produced. The arcs identify cytokine-producing subsets (IFN-γ, IL-2, MIP-1β, and
TNF) within the CD4+and CD8+T cell populations. Source data are provided as a Source Datafile.
a
b
0 1 2 3 4 5 6
Interferon signaling Complement system Role of pattern recognition receptors in recognition of bacteria and viruses Acute-phase response signaling PC3 (5.90%) PC2 (9.81%) PC1 (11.71%) HD EBOV_S Log (p value) IFN signaling HD EBOV_S Complemen t signaling PRR C1QA C1QB C1QC SERPING1 C2 C4BPA MASP2 C1S C1QA C1QB C1QC IL10 PRKD1 OAS1 OAS3 FGFR4 IFI6 IFIT1 IFIT3 ISG15 MX1 OAS1 IFITM3 c –4 –20 2 4 Row Z-score
Fig. 4 Enrichment of genes associated with inflammation and antiviral response in EBOV_S. Unsupervised principal component analysis (PCA) of
EBOV_S (n = 26) and HDs (n = 33). EBOV_S are indicated in red and HDs in blue (a). Ingenuity Pathway software analysis of the genes involved in immune
responses differentially expressed in EBOV_S and HDs (b). Heatmap of genes from the main pathways associated with differentially expressed genes in EBOV_S and HDs, including IFN signaling, the complement system and PRR signaling pathways. Each column depicts one subject (HD or EBOV_S) (c).
Globally, these data revealed a low frequency of pDCs contrasting with an expansion of nonclassical NK cell populations in the blood of survivors with symptoms pointing out a persistence of innate immunity dysfunction.
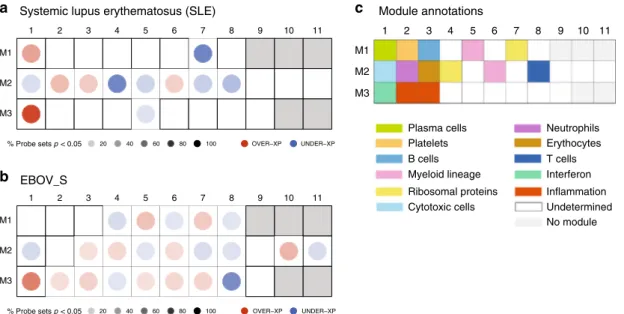
Comparable immune signatures in EBOV_S, SLE, and acute EBOV. Owing to previous published data from other groups, we also compared gene expression profiles of EBOV_S from our
cohort with a chronic“noninfectious” inflammatory disease, such
as systemic lupus erythematosus (SLE) and with acutely
Ebola-infected individuals28,29. Comparison of gene expression
path-ways of survivors with signature reported in SLE patients using
Chaussabel’s modules28showed that some relevant modules were
similarly differentially expressed in SLE patients and EBOV_S such as M3.1 IFN pathway, M2.1 cytotoxic cells, M2.8T cells, and M2.6 myeloid lineage. Not unexpectedly, there are significant differences in other pathways, such as for example M2.4
(ribo-somal proteins) (Fig.6a, b). We also compared our results with
published data on gene expression in Ebola acutely infected
individuals29. The full head-to-head comparison with acute
EBOV patients was not possible because of more stringent criteria
used to define the signature in this previous study29. However,
this analysis showed that the IFN module M3.1, which is over-expressed in acute patients, persists in EBOV_S (list of genes from acute EBOV transcriptomic signature belonging to IFN pathway (M3.1) module, Supplementary Fig. 8).
Discussion
The 2013–2016 Ebola outbreak in West Africa revealed how little was known about the pathogenicity of this virus and markers predictive of its clinical outcome. Several studies have investigated the acute phase of infection in EVD patients, or the period shortly after viral clearance. By contrast, we studied long-term survivors of the recent outbreak in Guinea. By comparing these survivors with a cohort of volunteers who had not had EVD and lived in the same areas, we were able to identify a profile specific to Ellipse : 95% Confidence level PC1 (21.88%) PC1 (21.88%) PC2 (13.15%) PC2 (13.15%) EBOV_S HD IFI6 IFIT1 IFIT3 ISG15 MX1 OAS1 IFITM3 C1QA C1QB C1QC SERPING1 C4BPA MASP2 C1S IL10 PRKD1 OAS3 FGFR4 PC1 (21.88%) PC2 (13.15%) sCD40L IL_1ra TNF_a EGF IL_8 CCL5 sCD163 sCD14 LBP iFAPB Amphiregulin % CD4+ % CD8+ % CD38+HLADR+/CD8+ % Activated memory B cells
% Exhausted B cells % NKG2D % CD56−CD16+ % DC % pDC MFI HLA-ABC/pDC % CD40/pDC IL_1 ra
TNF_a EGF IL_8 CCL5 sCD163 sCD14 LBP iFAPB Amphiregulin % CD4
+ % CD8 + % CD38 +HLADR +/CD8 +
% Activated memory B cells % Exhausted B cells % NKG2D % CD56
−CD16 + % DC % pDC MFI HLA-ABC/pDC % CD40/pDC % CD40/cDC −1.0 −0.5 0.0 0.5 1.0 Correlation a b c d CD8+ CD56– CD16+ CD38+HLADR+/CD8+ MFI HLA-ABC/pDC CD4+
Fig. 5 Persistence of innate immunity dysfunction in EBOV_S. Unsupervised principal component analysis of serum-soluble mediators and cell
phenotypic data, includingn = 26 EBOV_S and n = 33 HDs. EBOV_S are indicated in red and HDs in blue (a). Variables used for the construction of the
components (b). Spearman’s correlation matrix between serum-soluble mediators and cell phenotypes from n = 39 HDs and n = 34 EBOV_S. Colors
indicated Spearman’s correlation coefficient. Only significant correlations (p < 0.05) are represented (unadjusted for test multiplicity) (c). Unsupervised
PCA including genes (blue) from the main pathways associated with differentially expressed genes in EBOV_S and HDs, including IFN signaling, the complement system and PRR signaling pathways (d).
survivors. Our results, obtained with a large array of assays, highlight the existence of a consistent, intense chronic immune activation and inflammatory profile in survivors. Up to 2 years after healing and discharge from the ETC, survivors have per-sistently high serum levels of pro-inflammatory cytokines (IL-8 and TNF) and chronic immune activation markers (CCL5 and sCD40L). Consistent with these observations, an abnormal expression of activation markers was observed on circulating DCs, and the balance of immune cells was shifted towards
cir-culating activated CD8+ T cells, exhausted B cells,
pro-inflammatory monocytes, and nonclassical NK cells, a
popula-tion reported to be abundant in other chronic viral infecpopula-tions30,31
and in patients with acute EVD who subsequently survived32.
To evaluate association between immune parameters of EBOV_S highlighted in our study and well-characterized clinical
post-EVD symptoms3,4, we performed integrated analysis that
revealed a lower frequency of pDCs contrasting with an expan-sion of nonclassical NK cell populations in the blood of survivors with symptoms as compared to survivors without symptoms, pointing out a persistence of innate immunity dysfunction up to 2 years after healing.
Finally, deep-sequencing analyses of gene expression in the blood showed a significant enrichment in the expression of genes associated with IFN signaling, complement, pattern recognition receptor, and acute-phase response signaling. Previous studies
have reported similar profiles for patients with acute EVD14,29.
Comparison of EBOV_S immune signatures with published data
on gene expression in acute EVD patients29 showed that IFN
pathway overexpressed in acute patients was persisting in survi-vors enrolled in our study. Furthermore, comparison of EBOV_S immune signatures with SLE, a chronic noninfectious disease, showed that IFN, T cell, cytotoxic cell, and myeloid cell pathways looked similarly differentially expressed.
The persistence of activation/inflammation pathways in EBOV_S could be due to an increase susceptibility to viral infections or reactivations of latent viruses. EBOV_S enrolled in our study were assessed for biological parameters at inclusion and
during follow-up visits3. Longitudinal C-reactive protein
mea-surements showed no evidence of inflammatory syndrome. Fur-thermore, EBOV_S exhibited negative CMV and EBV viral loads at the time of immunological study. Therefore, these clinical and biological data likely suggest no evidence of intercurrent disease, which may explain the profile of EBOV_S.
It has been suggested that survivors have a profile of weaker inflammation, and less intense cytokine and chemokine “storms” than fatal cases, in whom these abnormalities are correlated with viral replication and tend to increase until death. Our data extend
thesefindings, by showing that the long-term persistence of these
abnormalities, in the absence of detectable viral replication, may
be a signature of a“chronic EVD (CEVD),” and shedding light on
its pathophysiology.
Clinically, the production of a damage-associated molecular pattern during acute EVD was thought to be associated with tissue damage, leading to a pathogenic activation cascade and,
ultimately, to a clinical syndrome resembling septic shock17. We
did not perform gut biopsies on these survivors, for practical reasons, but our results show that the chronic activation profile in CEVD is associated with high blood levels of markers of intestinal permeability and microbial translocation from a leaky gut (sCD14, iFABP, LBP, and sCD163). Acute EVD is characterized
by severe gastrointestinal symptoms33,34. Our data suggest there
may be substantial long-term gut damage, resulting in structural impairment of the epithelial barrier, as reported in several other
chronic infectious diseases19,20. Consistently, levels of EGF, which
is present at higher levels during the acute phase of EVD in
individuals who survive than in those who die15, and
amphir-egulin, which restores tissue integrity following
inflammation-associated damage35, remained higher in EBOV_S than HDs.
Identifying the immune responses associated with protection against Ebola infection or survival is crucial. The development of strong T cell responses during acute infection has been shown to be important for viral clearance and survival, whereas B cell responses seem to be less efficient with very few potent B cell
clones12,36. However, data remain scarce for humans. We show
1 2 3 4 5 6 7 8 9 10 11
M3 M2 M1
% Probe sets p < 0.05 20 40 60 80 100 OVER−XP UNDER−XP
1 2 3 4 5 6 7 8 9 10 11
M3 M2 M1
% Probe sets p < 0.05 20 40 60 80 100 OVER−XP UNDER−XP
a Systemic lupus erythematosus (SLE)
b EBOV_S c Module annotations 1 M1 M2 M3 Plasma cells Platelets Myeloid lineage Ribosomal proteins Cytotoxic cells B cells Neutrophils Erythocytes Interferon Inflammation Undetermined No module T cells 2 3 4 5 6 7 8 9 10 11
Fig. 6 Similarities between EBOV_S and SLE and acute EBOV immune signatures. Mapping global transcriptional changes with the use of Chaussabel’s
modules28for which at least 15% of the transcripts are significantly changed between controls (n = 12) and patients with SLE (n = 22) (a) or HDs (n = 33)
and EBOV_S (n = 26) (p value <0.05 for the Mann–Whitney/Wilcoxon’s test) (b). Module annotations (c). Spots indicate the proportion of genes
significantly changed for each module (p value <0.05 for SLE as per Chaussabel et al.28, fold change >1.5, and FDR <0.05 for EBOV_S). Coordinates
indicate module ID (e.g., M2.8 is row M2, column 8). Overexpressed modules are indicated in red and underexpressed modules are indicated in blue, in
here that survivors display strong, robust polyfunctional memory T cell responses to various Ebola epitopes. The antiviral func-tional capacity of these cells was not studied, but the phenotype of
CD8+ T cells after in vitro stimulation (strong cytotoxicity
marker expression) suggested that they remained cytotoxic. We were unable to study the progression of these responses long-itudinally, but the high frequency of these cells 2 years after viral clearance is intriguing. Survivors also maintained strong specific IgG responses against various Ebola proteins, confirming
pre-vious studies from precedent outbreaks37,38. These data and the
recent demonstration of a change in IgG isotype during
maturation of the anti-Ebola IgG repertoire in four survivors39
suggest that specific anti-Ebola responses change over time, consistent with possible persistent exposure to viral proteins captured at immunological sites or localized smoldering viral replication at sites of immune privilege (testes, eyes, and central
nervous system)40–42. The ability of these responses to protect
against secondary infection or control residual replication, thereby containing viral reservoirs, is unknown, but would have major implications for vaccine development.
Ebola disease remains a public threat. The mobilization of national and international organizations, community health workers and patients, civil society, and policy makers is crucial to contain epidemic spread and decrease mortality. Survivors of the 2013–2016 epidemic in West Africa and the current outbreak in the Democratic Republic of Congo (“les vainqueurs d’Ebola”) are at risk of developing a profile of severe immune dysfunction and
increased morbidity that we propose to call “CEVD.” Our data
provide a set of biological and genetic markers for assessing clinical outcomes and highlight the importance of developing such leading-edge studies, despite limited infrastructures in an epidemic context and the need for resources for the long-term follow-up of survivors.
Methods
Participants. We enrolled a subgroup of post EBOV_S from the Postebogui cohort in this ancillary immunological study. The design of the Postebogui cohort and
patient characteristics have been described elsewhere3,5,43. Eligible patients with
laboratory-confirmed EVD subsequently declared virus free were recruited at the ETCs in Guinea between March 2015 and July 2016. Ebola RNA was screened on
bodyfluids (semen, urine, cervicovaginal secretions, breast milk, and saliva) using
the standard RealStarFilovirus Screen RT-PCR Kit 1.0 and an additional in-house
technique targeting the viral nucleoprotein (NP)3. Ebola Xpert assay was also used
to re-evaluate, retrospectively on available left-over samples, RNA detection on
semen samples18. All patients gave immunological study-specific written informed
consent covering sampling, storage, and use of biological samples. Healthy volunteers enrolled in the PREVAC (Partnership for Research on Ebola Vaccina-tion) vaccine trial Guinean center agreeing to participate in the immunological evaluation were included, at baseline, as controls. Whole-blood, PBMCs, and serum samples were collected and stored on site. The study protocols were approved by the Research Committee of the National Ebola Response Coordination and the National Ethics and Health Research Committee in Guinea and ethics committees in France (INSERM/CEEI, IRD/CCDE).
Blood EBOV-RNA and serum EBOV antibody analysis. The Real-Star Filovirus Screen RT-PCR Kit 1.0 (Altona Diagnostics GmbH, Hamburg, Germany) was used to test for EBOV-RNA at the European West African Mobile Laboratory (EuWamlab) or the Institut National de Sante Publique (INSP) in Conakry.
EBOV-specific IgG was quantified in Luminex assays, as previously described44. Samples
were considered positive for IgG against EBOV if they reacted simultaneously and
repeatedly with NP and glycoprotein (GP) or NP ± viral protein (VP40)+ GP
(weakly positive: 200–399 MFI)45.
Quantification of serum analytes. Twenty-nine parameters were analyzed in
serum samples, by magnetic bead assays or ELISA: Human XL Cyt Disc Premixed Mag Luminex Perf Assay Kit (CCL2/MCP-1, CCL4/MIP-1β, RANTES/CCL5,
CCL11/Eotaxin, CCL19/MIP-3β, CCL20/MIP-3α, CD40Ligand, Fractalkine/
CX3CL1, CXCL10/IP-10, EGF, Flt-3 Ligand, granzyme B, IL-1RA, IL-6, IL-7, IL-8/ CXCL8, IL-10, IL-15, PD-L1/B7-H1, TNF-α, TRAIL/TNFSF10, and VEGF) (R&D Systems, #FCSTM18-22). For the Human Magnetic Luminex Assay (CD163, ST2, and CD14, LBP) (R&D Systems, LXSAHM-02), plates were prepared according to the manufacturer’s recommendations and read on a Bio-Plex 200 System™ version
6.1. Amphiregulin (#DAR-00), FABP2/IFABP (#DFBP20), and haptoglobin (#DHAPGO) were determined with Human Quantikine ELISA Kits (R&D
Sys-tems), according to the manufacturer’s instructions.
Cell phenotyping. Immune phenotyping was performed with an LSRII Fortessa
4-laser (488, 640, 561, and 405 nm)flow cytometer (BD Biosciences), and Diva
software version 6.2. FlowJo software version 9.9.6 (Tree Star Inc.) was used for
data analysis. Multiparametricflow cytometry panel was performed using a battery
of antibodies: anti-CD38 FITC #340909 (dilution: 1/10), anti-HLA-DR PE #347401 (dilution: 1/10), anti-CD4 BV421 #562424 (dilution: 1/33), anti-CD8 APCH7 #560179 (dilution: 1/20), anti-CD3 Alexa 700 #557943 (dilution: 1/100), anti-CCR7 Alexa 647 #557734 (dilution: 1/33), CD21 PE #555422 (dilution: 1/10), CD27 APC #337169 (dilution: 1/100), CD45 Alexa 700 #560566 (dilution: 1/100), anti-CD56 PECF594 #564849 (dilution: 1/500), anti-HLA-DR BV605 #562845 (dilution: 1/50), anti-CD33 BV421 #562854 (dilution: 1/20), anti-CD141 BV711 #563155 (dilution: 1/20), anti-CD45RA PerCpCy5.5 #563429 (dilution: 1/20), anti-HLA-ABC BV786 #740982 (dilution: 1/50), anti-CD86 PECF594 #562390 (dilution: 1/20) (all from BD Biosciences), anti-CD45RA PEefluor 610 #61-0458-42 (ebioscences) (dilution: 1/20); anti-CD19 PC7 #IM3628 (Beckman Coulter) (dilution: 1/100), anti-CD38 PercpCy5.5 #303522 (dilution: 1/100), anti-IgM Pacific Blue #314514 (dilution: 1/ 100), anti-CD71 BV650 #334116 (dilution: 1/20), anti-CD20 APC Cy7 #302314 (dilution: 1/20), anti-CD16 APC Cy7 #302018 (dilution: 1/20), anti-CD14 BV605 #301834 (dilution: 1/20), CD161 BV421 #339914 (dilution: 1/20), anti-NKG2D PercPcy5.5 #320818 (dilution: 1/20), anti-NKp46 PC7 #331916 (dilution: 1/20), anti-CD1c PE-Cy7 #331516 (dilution: 1/50), anti-CD40 PE #334308 (dilu-tion: 1/20), Lineage FITC #348801 (BioLegend) (dilu(dilu-tion: 1/100), IgD FITC #H15501 (Invitrogen) (dilution: 1/100), and anti-CD123 APC #130-113-322 (Miltenyi Biotec) (dilution: 1/50). For intracellular cytokine staining (ICS) analyses, cells were stained with surface monoclonal antibodies: anti-CD4 PE PECF594 #562281 (dilution: 1/33), anti-IFNγ FITC #557718 (dilution: 1/20), anti-TNFα
PE-Cy7 #557647 (dilution: 1/20), anti-MIP-1β PE #550078 (dilution: 1/200), and
anti-IL-2 BV421 #564164 (dilution: 1/20) (all from BD Biosciences). All antibodies were commercially available. See the corresponding manufacturer datasheets on web-pages for reference and validation
CD4+and CD8+T cells were analyzed for CD45RA and CCR7 expression, to
identify the naive, memory, and effector cell subsets, and for co-expression of the
activation markers HLA-DR and CD38. CD19+B cell subsets were analyzed for
the CD21 and CD27 markers. Antibody-secreting cells (plasmablasts) were
identified as CD19+cells expressing CD38 and CD27. We used CD16 and CD56 to
identify NK cell subsets. HLA-DR, CD33, CD45RA, CD123, CD141, and CD1c
were used to identify DC subsets, as previously described.46
Characterization of EBOV-specific immune responses. Cellular responses to
EBOV peptides were assessed with EpiMax technology47. Briefly, PBMCs were
stimulated in vitro with 158 overlapping 15-mer peptides (11-amino acid overlaps), covering the Ebola virus Mayinga variant GP, in two pools of 77 (EBOV1) and 81 peptides (EBOV2) (JPT Technologies). Cell functionality was assessed by ICS, with
Boolean gating (Fig.5b, Supplementary Appendix). Theflow cytometry panel
included a viability marker, CD3, CD4, and CD8 to determine T cell lineage, and CD107a, IFN-γ, TNF, MIP-1β, and IL-2 antibodies. Distributions were plotted with
SPICE version 5.22, downloaded fromhttp://exon.niaid.nih.gov/spice48.
RNA isolation and messenger RNA (mRNA)-sequencing. Total RNA was purified from whole blood with the Tempus™ Spin RNA Isolation Kit (Invitrogen) and globin mRNA depletion carried out with human GLOBINclear™ Kit
(Invi-trogen). Gene expression profiles were analyzed by mRNA-sequencing. RNA was
quantified with the Quant-iT RiboGreen RNA Assay Kit (Thermo Fisher Scientific) and quality control was performed on a Bioanalyzer (Agilent). Libraries were prepared with the TruSeq® Stranded mRNA Kit, according to the Illumina pro-tocol. Libraries were sequenced on an Illumina HiSeq 2500 V4 system. The single read sequencing depth was was about 50 million reads, with a fragment length of 101 bp. Sequencing quality control was performed with Sequence Analysis Viewer.
FastQfiles were generated from.bcl files on Illumina BaseSpace sequence hub. After
trimming (QPhred score≥25), reads were aligned to the hg19 human reference
genome, using STAR 2.5.3ar, and quantified relative to annotation model hg19
-GENCODE Genes - release 19, with Partek E/M (Partek® Flow® software,
Copy-right ©; 2019 Partek Inc., St. Louis, MO, USA). Counts were normalized by the counts per million (+0.0001) method. PCA was carried out using the Partek software. Differentially expressed genes were identified by using normalized read
counts as input for Gene-specific analysis (GSA) performed on Partek® Flow®
software. Only genes with adjusted p values (false discovery rate)≤0.05 and a
fold-change in expression≥1.5 were considered to be differentially expressed. The
differentially expressed genes were subjected to functional enrichment analysis with the Ingenuity Pathway software.
Statistical analysis. GraphPad Prism software version 8 was used for
nonpara-metric statistics and plots, as described in thefigure legends. Correlations between
phenotypic, seric, and genetic markers were analyzed by Spearman’s rank
analyses were carried out with SAS (version 9.3 or higher, SAS Institute, Cary, NC, USA), R (version 3.6, The R Foundation for Statistical Computing, Vienna, Aus-tria), and XLSTAT (version 2011.4.04, Addinsoft, Paris, France). Associations between markers and clinical symptoms have been explored by Wilcoxon’s rank-sum test and then using random forests to capture nonlinear relationships (data not shown). Final adjusted analyses were performed by using logistic regressions.
Fits have been evaluated by Hosmer–Lemeshow tests.
Reporting summary. Further information on research design is available in the Nature Research Reporting Summary linked to this article.
Data availability
RNA-sequencing data that support thefindings of this study have been deposited in
Gene Expression Omnibus (GEO) repository with the accession codesGSE143549. The
hg19 human reference genome can be found in the NCBI database (https://www.ncbi.
nlm.nih.gov/assembly/GCF_000001405.13/). Source data are provided with this paper.
Received: 5 September 2019; Accepted: 29 June 2020;
References
1. WHO. Ebola Data and Statistics. Situation Summary.http://apps.who.int/gho/
data/view.ebola-sitrep.ebola-summary-20160511?lang=en(2016).
2. Baize, S. et al. Emergence of Zaire Ebola virus disease in Guinea. N. Engl. J.
Med. 371, 1418–1425 (2014).
3. Etard, J.-F. et al. Multidisciplinary assessment of post-Ebola sequelae in
Guinea (Postebogui): an observational cohort study. Lancet Infect. Dis. 17,
545–552 (2017).
4. Group, P. I. S. et al. A longitudinal study of Ebola sequelae in Liberia. N. Engl.
J. Med. 380, 924–934 (2019).
5. Msellati, P. et al. Revival after Ebola: multidisciplinary assessment at 1 year,
prospect and follow-up study of surviving patients from Ebola in Guinea (PostEboGui cohort)]. Bull. Soc. Pathol. Exot. 109, 236–243 (2016).
6. Bwaka, M. A. et al. Ebola hemorrhagic fever in Kikwit, Democratic Republic of
the Congo: clinical observations in 103 patients. J. Infect. Dis. 179, S1–S7 (1999).
7. Kibadi, K. et al. Late ophthalmologic manifestations in survivors of the 1995
Ebola virus epidemic in Kikwit, Democratic Republic of the Congo. J. Infect. Dis. 179, S13–S14 (1999).
8. Rodriguez, L. L. et al. Persistence and genetic stability of Ebola virus during the
outbreak in Kikwit, Democratic Republic of the Congo, 1995. J. Infect. Dis.
179, S170–S176 (1999).
9. Rowe, A. K. et al. Clinical, virologic, and immunologic follow-up of
convalescent Ebola hemorrhagic fever patients and their household contacts, Kikwit, Democratic Republic of the Congo. Commission de Lutte contre les Epidemies a Kikwit. J. Infect. Dis. 179, S28–S35 (1999).
10. Mattia, J. G. et al. Early clinical sequelae of Ebola virus disease in Sierra Leone: a cross-sectional study. Lancet Infect. Dis. 16, 331–338 (2016).
11. McElroy, A. K. et al. Human Ebola virus infection results in substantial immune activation. Proc. Natl. Acad. Sci. USA 112, 4719–4724 (2015). 12. Ruibal, P. et al. Unique human immune signature of Ebola virus disease in
Guinea. Nature 533, 100–104 (2016).
13. Dahlke, C. et al. Comprehensive characterization of cellular immune
responses following Ebola virus infection. J. Infect. Dis. 215, 287–292 (2017).
14. Kash, J. C. et al. Longitudinal peripheral blood transcriptional analysis of a
patient with severe Ebola virus disease. Sci. Transl. Med. 9,https://doi.org/
10.1126/scitranslmed.aai9321(2017).
15. Kerber, R. et al. Kinetics of soluble mediators of the host response in Ebola virus disease. J. Infect. Dis. 218, S496–S503 (2018).
16. Colavita, F. et al. Inflammatory and humoral immune response during Ebola virus infection in survivor and fatal cases occurred in Sierra Leone during the
2014–2016 outbreak in West Africa. Viruses 11,https://doi.org/10.3390/
v11040373(2019).
17. Reynard, S. et al. Immune parameters and outcomes during Ebola virus
disease. JCI Insight 4,https://doi.org/10.1172/jci.insight.125106(2019).
18. Keita A.K. et al. A 40 months follow-up of Ebola virus disease survivors in Guinea (Postebogui) reveals longterm detection of Ebola viral RNA in semen
and breast milk. Open Forum Infect. Dis. 6,https://doi.org/10.1093/ofid/ofz482
(2019).
19. Caradonna, L. et al. Biological and clinical significance of endotoxemia in the
course of hepatitis C virus infection. Curr. Pharm. Des. 8, 995–1005 (2002). 20. Brenchley, J. M. & Douek, D. C. The mucosal barrier and immune activation
in HIV pathogenesis. Curr. Opin. HIV AIDS 3, 356–361 (2008).
21. Marchetti, G., Tincati, C. & Silvestri, G. Microbial translocation in the pathogenesis of HIV infection and AIDS. Clin. Microbiol. Rev. 26, 2–18 (2013).
22. Klatt, N. R., Funderburg, N. T. & Brenchley, J. M. Microbial translocation,
immune activation, and HIV disease. Trends Microbiol. 21, 6–13 (2013).
23. Olsen, P. S. Role of epidermal growth-factor in gastroduodenal mucosal
protection. J. Clin. Gastroenterol. 10, S146–S151 (1988).
24. Reed, D. S., Hensley, L. E., Geisbert, J. B., Jahrling, P. B. & Geisbert, T. W. Depletion of peripheral blood T lymphocytes and NK cells during the course of ebola hemorrhagic fever in Cynomolgus macaques. Viral Immunol. 17, 390–400 (2004).
25. Gupta, M., Spiropoulou, C. & Rollin, P. E. Ebola virus infection of human PBMCs causes massive death of macrophages, CD4 and CD8 T cell sub-populations in vitro. Virology 364, 45–54 (2007).
26. Menicucci, A. R. et al. Transcriptome analysis of circulating immune cell subsets highlight the role of monocytes in Zaire Ebola Virus Makona pathogenesis. Front. Immunol. 8, 1372 (2017).
27. Geisbert, T. W. et al. Pathogenesis of Ebola hemorrhagic fever in primate
models. Am. J. Pathol. 163, 2371–2382 (2003).
28. Chaussabel, D. et al. A modular analysis framework for blood genomics
studies: application to systemic lupus erythematosus. Immunity 29, 150–164
(2008).
29. Liu, X. et al. Transcriptomic signatures differentiate survival from fatal outcomes in humans infected with Ebola virus. Genome Biol. 18, 4 (2017). 30. Gonzalez, V. D. et al. Expansion of functionally skewed CD56-negative NK
cells in chronic hepatitis C virus infection: correlation with outcome of pegylated IFN-alpha and ribavirin treatment. J. Immunol. 183, 6612–6618 (2009).
31. Milush, J. M. et al. CD56negCD16(+) NK cells are activated mature NK cells with impaired effector function during HIV-1 infection. Retrovirology 10, 158 (2013).
32. Cimini, E. et al. Different features of Vdelta2 T and NK cells in fatal and non-fatal human Ebola infections. PLoS Negl. Trop. Dis. 11, e0005645 (2017). 33. Schieffelin, J. S. et al. Clinical illness and outcomes in patients with Ebola in
Sierra Leone. N. Engl. J. Med. 371, 2092–2100 (2014).
34. Hunt, L. et al. Clinical presentation, biochemical, and haematological parameters and their association with outcome in patients with Ebola virus disease: an observational cohort study. Lancet Infect. Dis. 15, 1292–1299 (2015).
35. Monticelli, L. A. et al. IL-33 promotes an innate immune pathway of intestinal tissue protection dependent on amphiregulin-EGFR interactions. Proc. Natl. Acad. Sci. USA 112, 10762–10767 (2015).
36. Williamson, L. E. et al. Early human B cell response to Ebola virus in four U.S.
survivors of infection. J. Virol. 93,https://doi.org/10.1128/JVI.01439-18
(2019).
37. Rimoin, A. W. et al. Ebola virus neutralizing antibodies detectable in survivors of the Yambuku, Zaire outbreak 40 years after infection. J. Infect. Dis. 217,
223–231 (2018).
38. Sobarzo, A. et al. Profile and persistence of the virus-specific neutralizing humoral immune response in human survivors of Sudan ebolavirus (Gulu). J. Infect. Dis. 208, 299–309 (2013).
39. Davis, C. W. et al. Longitudinal analysis of the human B cell response to Ebola virus infection. Cell 177, e1517 (2019).
40. Varkey, J. B. et al. Persistence of Ebola virus in ocularfluid during
convalescence. N. Engl. J. Med. 372, 2423–2427 (2015).
41. Diallo, B. et al. Resurgence of Ebola virus disease in guinea linked to a survivor
with virus persistence in seminalfluid for more than 500 days. Clin. Infect.
Dis. 63, 1353–1356 (2016).
42. Deen, G. F. et al. Ebola RNA persistence in semen of Ebola virus disease
survivors–final report. N. Engl. J. Med. 377, 1428–1437 (2017).
43. Sow, M. S. et al. New evidence of long-lasting persistence of Ebola virus genetic material in semen of survivors. J. Infect. Dis. 214, 1475–1476 (2016).
44. Ayouba, A. et al. Development of a sensitive and specific serological assay based on luminex technology for detection of antibodies to Zaire Ebola Virus. J. Clin. Microbiol. 55, 165–176 (2017).
45. Keita, A. K. et al. Serological evidence of Ebola virus infection in rural Guinea before the 2014 West African epidemic outbreak. Am. J. Trop. Med. Hyg. 99, 425–427 (2018).
46. See, P. et al. Mapping the human DC lineage through the integration of
high-dimensional techniques. Science 356,https://doi.org/10.1126/science.aag3009
(2017).
47. Chujo, D. et al. ZnT8-zpecific CD4+ T cells display distinct cytokine
expression profiles between type 1 diabetes patients and healthy adults. PLoS
ONE 8, e55595 (2013).
48. Roederer, M., Nozzi, J. L. & Nason, M. C. SPICE: exploration and analysis of post-cytometric complex multivariate datasets. Cytom. A 79, 167–174 (2011).
Acknowledgements
We thank The French Task Force against Ebola, INSERM, and IRD for institutional support, and the Postebogui team for their daily work and the survivors. We also thank Aminata Diallo, head of the immunology laboratory at Institut National de Santé Pub-lique, and Nathan Peiffer-Smadja and Maxime Schvartz for their help in setting up a laboratory in Conakry. This work was supported by INSERM and by the Investissements d’Avenir program, Vaccine Research Institute (VRI), managed by the ANR under reference ANR-10-LABX-77-01.
Author contributions
Y.L., C.L., and A.W. conceived and designed the study. A.K.K., S.M., J.-C.F., A.T., H.R., E.D., C.L.-M., and L.K. participated in sample collection. E.F., C.L.e., S.F., B.P.H., M.D., M.K., and A.A. performed experiments and analyzed data. A.W., Y.L., H.H., C.L.e., R.T., and A.A. analyzed and interpreted data. A.W. and Y.L. drafted thefirst version and wrote thefinal version of the manuscript. All authors approved the final version.
Competing interests
The authors declare no competing interests.
Additional information
Supplementary informationis available for this paper at https://doi.org/10.1038/s41467-020-17489-7.
Correspondenceand requests for materials should be addressed to Y.L.
Peer review informationNature Communications thanks Giuseppe Ippolito and the
other, anonymous reviewer(s) for their contribution to the peer review of this work. Peer review reports are available.
Reprints and permission informationis available athttp://www.nature.com/reprints
Publisher’s note Springer Nature remains neutral with regard to jurisdictional claims in published maps and institutional affiliations.
Open Access This article is licensed under a Creative Commons
Attribution 4.0 International License, which permits use, sharing, adaptation, distribution and reproduction in any medium or format, as long as you give appropriate credit to the original author(s) and the source, provide a link to the Creative Commons license, and indicate if changes were made. The images or other third party material in this article are included in the article’s Creative Commons license, unless indicated otherwise in a credit line to the material. If material is not included in the article’s Creative Commons license and your intended use is not permitted by statutory regulation or exceeds the permitted use, you will need to obtain permission directly from the copyright holder. To view a copy of this license, visithttp://creativecommons.org/ licenses/by/4.0/.
© The Author(s) 2020