HAL Id: hal-00964706
https://hal.archives-ouvertes.fr/hal-00964706
Submitted on 1 Jun 2020HAL is a multi-disciplinary open access archive for the deposit and dissemination of sci-entific research documents, whether they are pub-lished or not. The documents may come from teaching and research institutions in France or abroad, or from public or private research centers.
L’archive ouverte pluridisciplinaire HAL, est destinée au dépôt et à la diffusion de documents scientifiques de niveau recherche, publiés ou non, émanant des établissements d’enseignement et de recherche français ou étrangers, des laboratoires publics ou privés.
(MAR) within an isolated tree canopy
Didier Combes, Hervé Sinoquet, Claude Varlet-Grancher
To cite this version:
Didier Combes, Hervé Sinoquet, Claude Varlet-Grancher. Preliminary measurement and simulation of the spatial distribution of the morphogenetically active radiation (MAR) within an isolated tree canopy. Annals of Forest Science, Springer Nature (since 2011)/EDP Science (until 2010), 2000, 57, pp.497-511. �hal-00964706�
Original article
Preliminary measurement and simulation
of the spatial distribution of the Morphogenetically
Active Radiation (MAR) within an isolated tree canopy
Didier Combes
a,b,*, Hervé Sinoquet
band Claude Varlet-Grancher
aa Station d’Écophysiologie des Plantes Fourragères, INRA, 86600 Lusignan, France bUMR PIAF, INRA – Université Blaise Pascal, 63039 Clermont-Ferrand Cedex 1, France
(Received 19 February 1999; accepted 2 September 1999)
Abstract – Light quality, i.e. the solar radiation spectrum, is involved in developmental processes of plants, including trees.
Characterisation of morphogenetically active radiation (MAR) within a canopy is necessary in order to take into account photoregu-lation of the architecture in tree simuphotoregu-lation models. This study was a first attempt at describing and simulating the spatial distribution of light quality within a walnut tree crown (Juglans regia L.) using both spectral measurements and a radiation transfer model based on the turbid medium analogy. Both measurements and simulation were qualitatively in agreement. They showed large differences in light quality between shaded and sunlit areas. The range of measured and simulated values was in agreement with values reported in the literature. The quantitative comparison between measurements and model outputs showed large discrepancies. The latter were attributed to the rough treatment of scattering in the model, the small amount of punctual measurements made in the tree, and the high sensitivity of input parameters such as the diffuse to incident radiation ratio and canopy structure description. Nevertheless the model was mostly able to describe the range of MAR values (phytochrome equilibrium Φc, blue transmittance) found in the tree canopy.
radiation transfer / phytochrome / cryptochrome / photomorphogenesis
Résumé – Simulation de la distribution spatiale du Rayonnement Morphogénétiquement Actif au sein de la couronne d’un arbre isolé. La qualité de la lumière, c’est-à-dire sa composition spectrale, est impliquée dans les processus de développement des
plantes, y compris chez les arbres. La caractérisation du rayonnement morphogénétiquement actif (MAR) au sein d’un couvert végé-tal est nécessaire pour prendre en compte la régulation de l’architecture par la lumière dans les modèles structure-fonction de l’arbre. Cette étude est une première approche de description et de simulation des variations de la composition spectrale de la lumière dans la couronne d’un noyer (Juglans regia L.). Elle s’appuie sur des mesures et sur l’utilisation d’un modèle de transfert radiatif basé sur l’analogie au milieu trouble. Qualitativement, les mesures et les simulations sont en accord. Elles montrent des différences impor-tantes entre zones à l’ombre et au soleil. La gamme des valeurs mesurées et simulées est en accord avec la littérature. La comparaison quantitative entre mesures et simulations présente de grands écarts. Ces derniers ont été attribués au traitement simplifié de la rediffu-sion dans le modèle, au nombre limité de mesures spectrales disponibles, et à la sensibilité importante de variables d’entrée du modè-le, telles que la fraction de rayonnement diffus dans le rayonnement incident ou la description de la structure du couvert. Cependant le modèle s’avère décrire relativement bien les gammes de valeurs des paramètres du MAR (équilibre du phytochrome Φc, transmit-tance du rayonnement bleu), telles que mesurées dans l’arbre.
transfert radiatif / phytochrome / cryptochrome / photomorphogénèse
* Correspondence and reprints
1. INTRODUCTION
Numerous studies have shown that some plant mor-phogenetical responses are induced by light quality vari-ations [24], in particular in woody species. In apple trees, light quality played a major role in determining the num-ber of flower and vegetative buds [20]. Young Douglas-fir seedlings were able to detect the presence of nearby seedlings via changes in light quality and thereafter adjust their growth allometry [18]. A general inhibition of growth phenomena was caused in Prunus persica plants under controlled light environment [5].
Plant morphogenetical responses are mediated by the perception of the light quality variations by two families of photoreceptors, cryptochrome and phytochrome local-ized throughout the whole plant. The cryptochrome can sense variations in the UVA-blue domain which is the waveband 350 – 500 nm [26]. The phytochrome exists in two interconvertible forms Pr with a typical maximum absorption in the red waveband around 660 nm and Pfr with a maximum absorption in the far-red around 730 nm. The reversible photoconversion between the two forms is the basic process of light sensing by the phytochrome [24, 27]. The potential effectiveness of the radiation for each type of photoreceptor system has been called the Morphogenetically Active Radiation (MAR, [26]).
MAR distribution within a crop results from complex interactions between natural light, optical properties of the ground and phytoelements, and canopy structure. Moreover, due to the spatial distribution of phytoele-ments in the canopy volume, an organ may be in either a shaded area or in a sunfleck where light quality is differ-ent [16]. The exhaustive analysis of these variations from measurements within a plant stand as a function of all factors involved would be difficult. That is why radia-tion transfer models can be used to explore a large num-ber of situations. Such models should be able not only to compute spectral photon irradiance, but also to simulate radiation reaching shaded and sunlit areas.
Some models were used to simulate light quality. The model SHORTWAVE [13] was used to simulate light quality in soybean and poplar stands. However it was based on wide radiation wavebands and the output was canopy reflectance. Anisimov and Fukshansky proposed a stochastic radiation transfer model [1, 2] to calculate the contribution of the stochastic component of down-ward and updown-ward radiation spectral fluxes, in particular in the red and far-red wavelengths. The two models applied to horizontally homogeneous canopies and they were not tested against measured data of radiation micro-climate within the canopy.
This paper is a first attempt at describing the spatial distribution of MAR in the crown of an isolated tree. For this purpose, radiation spectra were measured at the local scale in sunlit and shaded areas in the crown and were used to derive MAR parameters. Both radiation spectra and MAR parameters at the same locations were also computed from a radiation transfer model [22]. Both measurements and simulations gave a first assessment of the spatial variations of MAR and underline require-ments in radiation modelling for MAR simulation.
2. MATERIALS AND METHODS
2.1 Description of the model
The radiation model [22] is based on the turbid medi-um analogy. The space between the soil surface and the horizontal plane at the top of the canopy is divided into 3-D cells which are defined by the intersection of hori-zontal layers, vertical slices parallel to the row direction and vertical slices perpendicular to the row direction. Each cell may be empty or contain leaves. Cell content is described by the leaf area density and inclination distrib-ution. Within a cell, leaf area densities are assumed to be uniformly distributed, inclination distribution constant and azimuths random. Only a canopy unit, e.g. the space occupied by one or some trees is described in terms of 3D cells. The canopy is assumed to be an infinite set of such canopy units.
2.1.1 Radiation interception
For a given direction, the path of beams regularly sampled is computed through the cells by computing the intersections between the beam path (a line) and the cell bounds (plans). Thus cells visited by the beam are identi-fied, and the path length in each cell is computed. Beam extinction is calculated from the Beer-Nilson’s law applied to each zone encountered by the beam. The prob-ability Pk(Ω) that a beam of direction W be intercepted
by the kthvisited cell is:
(1)
where Gl(Ω) is the projection coefficient of unit leaf area
for direction Ω[19], alis the leaf area density in cell l
and δsl(Ω) is the length of the beam path in cell l. Leaf
dispersion is assumed to be random. The two terms of the right member of Equation (1) respectively account
Pk Ω=
Π
exp – GlΩ ⋅al⋅ δsl Ω l = 1k – 1
for i) the gap frequency above cell k and ii) the radiation intercepted in cell k.
The direct component of the incident radiation is assumed to be a set of parallel beams coming from the sun direction. The penumbra effect is therefore disre-garded. Diffuse incident radiation is considered as a set of directional fluxes. Each of them is treated like the direct radiation. The sky is divided into 96 solid angle sectors, i.e. the intersection of 8 zenith classes and 12 azimuth classes. The distribution of diffuse radiation in the solid angle sectors is computed by assuming a standard overcast distribution [15]. Hemispherical fluxes are computed by numerical integration over the whole sky.
2.1.2 Radiation scattering
The multidirectional origin of the scattered radiation is taken into account. The assumption is made that leaves and the soil surface are lambertian diffusers. For leaf area in a cell k, the fraction Γk(Ω) of scattered radiation
which goes in a solid angle ∆Ωaround direction Ωis assumed to only depend on leaf angle distribution and not to depend on the direction of incident radiation [22]
Γk(Ω) = Gk(Ω) · ∆Ω (2)
where Gk(Ω) is again the projection coefficient of unit
leaf area in cell k, i.e. the average value of cosine of the
between leaf normals and the exit direction Ω.
Interception of scattered radiation is treated like that of incident radiation. For each direction Ω, beams are sent from the scattering zones (vegetation cells and the soil surface) with an initial energy equal to Γk(Ω).
2.1.3 Radiation balance
Radiation balance consists of computing fluxes inter-cepted in each 3D cell, taking into account multiple interception and scattering processes. The simple treat-ment of scattering within vegetation cells (see Eq. 2), allows the radiation balance to be computed with hemi-spherical fluxes. Interception of both incident and scat-tered is expressed in terms of exchange coefficients
CA→Bbetween radiation source A and radiation receiver
B.
The radiation balance of the canopy is solved for each wavelength by using a method similar to the radiosities method [17]. Total radiation of wavelength λ intercepted by cell k is
(3)
where Rb0and Rd0are respectively the direct and the
dif-fuse radiation above the canopy. Cl→k· σv· Rl is the
scattered radiation coming from the cell l and intercepted by cell k, since σv is the scattering coefficient of leaves
and Cl→kis the exchange coefficient between cell l and k
for scattered radiation. Using a single scattering coeffi-cient, i.e. the sum of leaf reflectance and transmittance, means that the model does not distinguish leaf reflectance and transmittance, this is the same as the classical assumption of equality between leaf reflectance and transmittance. In a similar way, Cm→k· σg · Rgm is
the scattered radiation coming from soil cell m (m = 1,...,Nx) and intercepted by cell k, where σg is the soil
reflectance and Rgmis the radiation transmitted to soil
cell m. Equations (3) are written for each vegetation and soil cells. They form a system of linear equations where fluxes Rkand Rgmare the unknowns and which is solved
by an iterative method. In these equations, fluxes (including Rb0and Rd0) are wavelength-dependent as are
the scattering coefficient of leaves and soil reflectance. On contrast, exchange coefficients do not depend on wavelength since they account for radiation interception. For scattered radiation, this means that leaves and the soil surface are assumed to be lambertian (and obey Eq. 3) at any wavelength.
Finally, intercepted fluxes Rkshand Rksuby shaded and
sunlit foliage in cell k are respectively computed as: (4)
(5)
Equations (4) and (5) express that the shaded area only receives diffuse and scattered radiation while sunlit foliage receives additionally the whole incident direct beam according to foliage inclination and sun elevation h.
2.2 Model inputs and parameterisation
2.2.1 Site and tree structure
The study was carried out in the summer of 1996 on an isolated 20 year-old walnut tree (Juglans Regia L.) grown near Clermont-Ferrand (45°N, 2° East), France. It was a 8 m high timber with a 5.5 m-wide crown. The tree was pruned in order to make a 3 m high bole. It was grown in an orchard of 1.4 ha planted in staggered rows. Row and plant spacing was 10 m. Due to crown size
Rksu= Rb0⋅ Gk sin h+ Rd 0⋅Cd 0→k+l = 1
Σ
Cl→k N ⋅σv⋅Rl+Σ
Cm→k m = 1 Nx ⋅σg⋅Rgm. Rshk = Rd0⋅Cd0→k+Σ
Cl→k l = 1 N ⋅ σv⋅Rl+Σ
Cm→k m = 1 Nx ⋅ σg⋅Rgm Rk= Rb0⋅Cb0→k+ Rd0⋅Cd0→k+Σ
Cl→k l = 1 N ⋅ σv⋅Rl+Σ
Cm→k m = 1 Nx ⋅ σg⋅Rgmwith regard to tree density, the tree can be considered as isolated. The tree structure was recorded with a digitis-ing technique [23]. Spatial co-ordinates of every shoot in the tree were recorded by using a 3D electromagnetic digitiser and shoot basal diameter was measured with a Vernier Calliper. A sample of shoots was harvested to establish an allometric relationship between leaf area and basal diameter [23].
As an input of the model, the volume occupied by the tree was represented as a cube of 10 m length and width and 8 m height. The volume was divided into cubic cells of 0.5 m side. Leaf area of each shoot was estimated from the allometric relationship between shoot diameter and leaf area. Shoot leaf area was affected to a cell according to the midpoint position of the shoot. This made 550 leafy cells. Spherical angular distribution was assumed for all leafy cells.
2.2.2 Optical properties
Optical properties were measured on 32 mature leaves sampled on a vertical profile close to crown centre. Such sampling ensured to get leaves submitted to contrasted light microclimate. Leaf optical properties of both upper and lower sides were measured with the LI-1800 spec-troradiometer coupled with an integrating sphere. Reflectance and transmittance were scanned every 5 nm from 400 to 800 nm. Soil reflectance was measured in a similar way with three repetitions.
In the model, the scattering coefficient of leaf area was assumed to be the same for all 3D cells. It was com-puted as the sum of mean reflectance and transmittance, i.e. the mean value averaged on the two sides of the 32 sampled leaves.
2.3 Radiation measurements
Radiation spectra were measured on horizontal planes during two sunny days with a LI-COR LI-1800 portable spectroradiometer connected to a quartz fiber optic probe. Spectra measurements ranged between 400 to 1100 nm with a 5 nm step.
2.3.1 Incident radiation
The spectral distribution of the incident radiation as used in the model is the global radiation and the propor-tion of diffuse above the canopy tree. Spectra of incident global radiation, i.e. above the tree canopy, was mea-sured once per hour during the experiment. During the whole measurement period, incident radiation in the PAR (diffuse and global) was continuously monitored
above the tree with a sky quantum sensor (SK215, Skye) connected to a data logger (CR10, Campbell). Data from the quantum sensor were averaged and recorded each minute. The sensor was used i) to check stability of inci-dent radiation during spectrum acquisition, i.e. about 1.5 mn, ii) to normalise the ratio of diffuse to global inci-dent radiation and transmitted spectra with regard to the incident one, since incident and the ratio of diffuse to global incident radiation transmitted spectra could not be measured at the same time.
Spectral measurements of the ratio of diffuse to global incident radiation, i.e. above the tree crown, were obtained from diffuse and global spectra radiation mea-surements. Diffuse spectra radiation were measured with the help of a shadow band. The global spectra radiation was recorded above the tree. Then, we established a vari-ation law of the ratio diffuse to global related to the wavelength. This relationship was adjusted with the quantum sensor measurements.
2.3.2 Transmitted radiation within the crown
Three series of spectral measurements of transmitted radiation were recorded at different locations within the crown in shaded and sunlit areas. Spectra were saved only when the incident radiation was stable (as checked from continuous readings of incident quantum sensor outputs). Sunlit and shaded areas were distinguished by eye. For each location at least three repetitions were per-formed.
The first series was a vertical profile located along the trunk axis. Spectra were measured every meter from the top to the bottom of the crown. This series was per-formed on day of year (DOY) 235 between 10h30 and 12h00 UT. The second and third series were the same horizontal profile along a North-South axis crossing the trunk axis at a 4.5 m height above soil surface. The sec-ond series occurred on DOY 235 between 12h15 and 12h45 UT while the last series was performed on DOY 236 between 8h00 and 13h30 UT. For the series, spectra were measured every meter along the horizontal axis.
2.4 Estimation of MAR parameters
MAR parameters were derived from the transmitted spectral photon distribution and the photoreceptor action spectra of light. The same calculations were applied to both measured and simulated spectra.
In the UVA-blue domain between 350 and 500 nm, the action spectra of cryptochrome shows relatively low variations [21]. It was therefore assumed not to depend on wavelength, so that the blue photoreceptor would
respond to photon irradiance between 350 and 500 nm. Due to spectral measurements from 400 nm, blue irradi-ance BI was computed between 400 and 500 nm:
(6) where Iλis spectral photon irradiance at wavelength λ (µmol m–2s–1nm–1).
The action spectra of the two forms of phytochrome overlap throughout the 400–800 nm waveband. The parameter describing the incident active radiation on the phytochrome is primarily the phytochrome photoequilib-rium Φcwhich is calculated as
(7)
where Afrλ, Arλare respectively the action spectra of the
Pfrand the Prphytochrome forms [12].
The absorption maxima of the phytochrome are broad peaks around 660 nm and 730 nm [9]. Thus, the photoe-quilibrium has been strongly correlated with the red:far red photon irradiance ratio of the incident radiation
[Smith and Holmes, 1977: 25]. This ratio was notated ζ by Monteith (1976) [14] and can be computed as
(8)
3. RESULTS
3.1 Structure
Cross sections of leaf area density from East to West and from North to South showed different patterns (figures 1a and 1b). In particular, the difference of one meter in crown width showed that the tree was not sym-metric around the vertical central axis along the trunk. Notice that cells located between 0 and 0.25 m corre-sponds to the intersection between the two cross sections. In the East-West cross-section the leaf area density ranged between 0.1 and 8.8 m2/m3(figure 1a) and values
were larger in the upper part. A gradient of leaf area den-sity existed from the centre to the upper part of the cross section. ζ= Iλ⋅dλ 655 665 Iλ⋅dλ 725 735 . Φc= Pfr Pr + Pfr = Iλ⋅Arλ⋅dλ 400 800 Iλ⋅Afrλ⋅dλ 400 800 + Iλ⋅Arλ⋅dλ 400 800 BI = Iλdλ 400 500
Figure 1a. Distribution of the leaf area density (LAD in m2/m3) within an East-West cross section of the tree crown. The zero
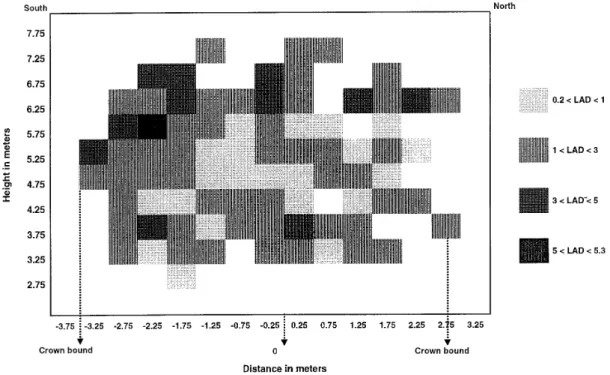
In the North-South cross section (figure 1b), leaf area density varied between 0.2 and 5.3 m2/m3 and highest
values were in the southern part. A gradient of leaf area density existed from the northern part to the southern part of this cross section.
3.2 Leaf optical properties
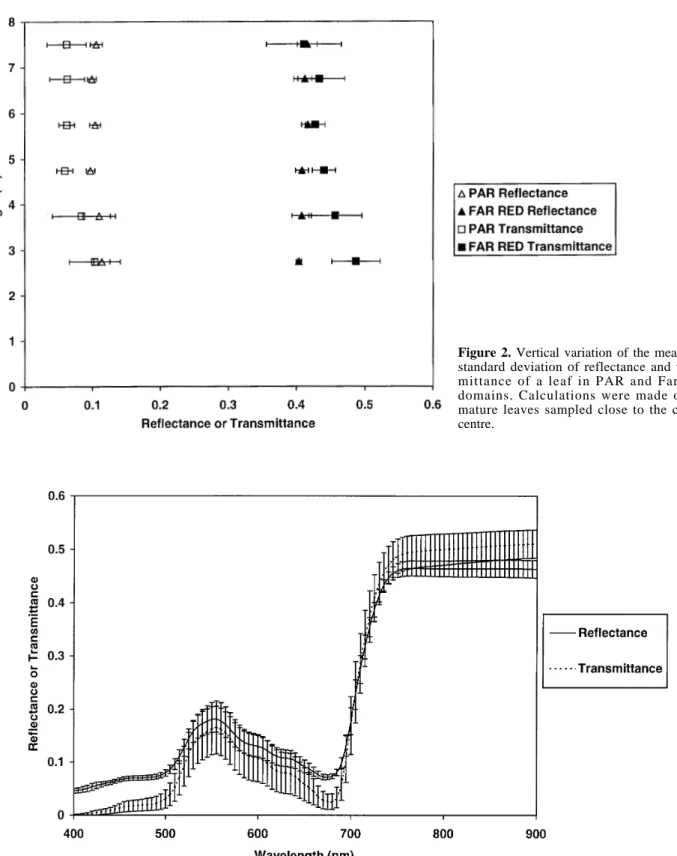
Optical properties of upper and lower leaf side did not show any significant differences (data not shown), so values for the two sides were averaged. Figure 2 shows vertical variations of leaf optical properties within the crown.
In PAR domain leaf reflectance showed little varia-tions around a mean value of 0.10 whereas the transmit-tance ranged between 0.03 and 0.16 around a mean value of 0.07. The variability of leaf transmittance was more marked at the top and the bottom than in the middle part of the tree. Both PAR transmittance and reflectance tended to show vertical variation with smaller values at the top of the crown. Leaf reflectance tended to be larger than leaf transmittance, with significant differences from the middle to the upper canopy.
Like in the PAR waveband, leaf reflectance in the far red domain, did not show any variability while transmit-tance ranged from 0.34 to 0.52. The smaller mean transmittance was found in the upper part of the tree. A vertical gradient of the mean transmittance existed from the bottom to the top of the tree crown. Like in the PAR domain, the variability of the transmittance was more marked at the top and the bottom than in middle part of the tree crown. The difference between mean leaf reflectance (0.41) and transmittance (0.43) in the far-red wavelength was not significant.
Figure 3 shows spectral variations of leaf optical
properties. The largest standard deviation occurred in the green and the far red domain where the reflectance and the transmittance were relatively the highest. This means that variability of the transmittance observed in the PAR region (figure 2) was mainly due to the green domain (figure 3).
3.3 Radiation spectra within the tree canopy
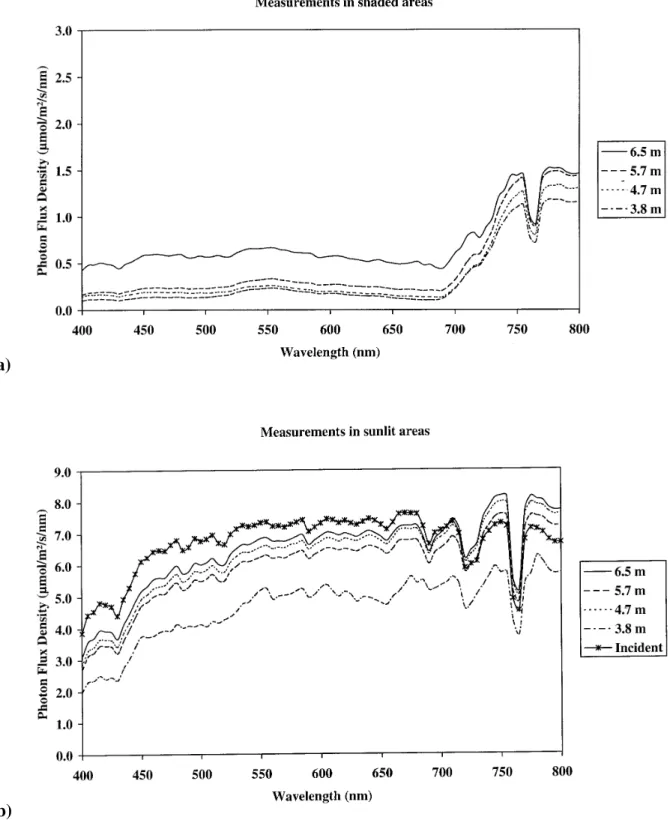
Figure 4 shows radiation spectra measured and
simu-lated on horizontal plans made at four heights (3.8, 4.7,
Figure 1b. Distribution of the leaf area density (LAD in m2/m3) within an North-South cross section of the tree crown. The zero
Figure 2. Vertical variation of the mean and
standard deviation of reflectance and trans-mittance of a leaf in PAR and Far Red domains. Calculations were made on 32 mature leaves sampled close to the crown centre.
Figure 3. Leaf spectral reflectance and transmittance with their standard deviation. Calculations were made on 32 mature leaves
Figure 4. (a) and (b) represent measured spectra in shaded and sunlit areas on horizontal plans at four heights within the tree crown.
(b) and (c) represent simulated spectra in shaded and sunlit areas at different levels within the tree crown. The measured and simulated spectra were measured at different times and under clear sky conditions.
(a)
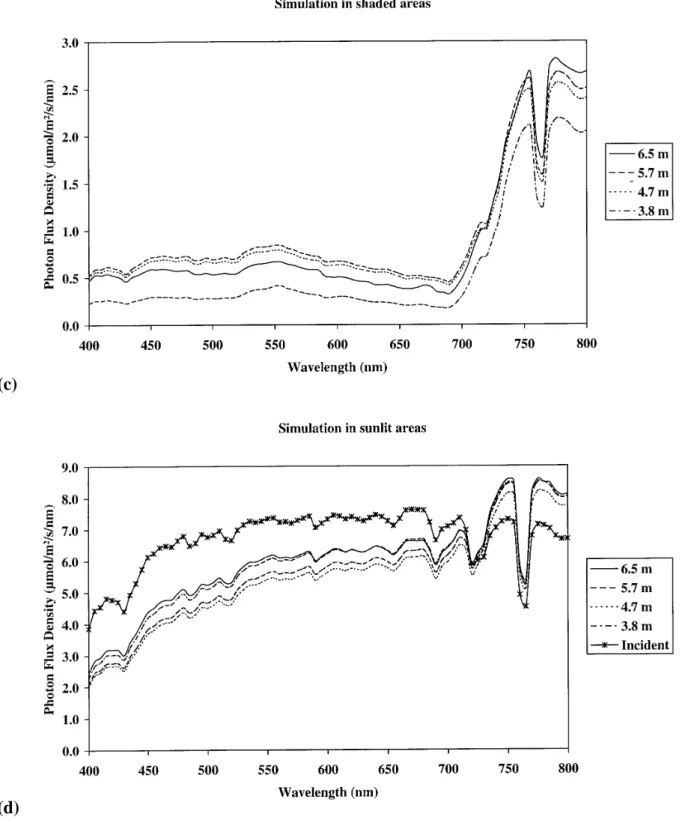
Figure 4. Continued.
(c)
5.7 and 6.5 m) within the tree crown. In shaded areas, both measured and simulated spectra at all the heights showed less energy in the PAR domain from 400 to 700 nm in comparison with the far red domain (figures 4a and 4c). In the PAR domain, energy levels ranged between 0.1 and 0.5 µmol m–2s–1nm–1according
to the height in the crown. Spectral energy only changed slightly with wavelength at a given height. In the far red domain, the spectra showed an almost linear increase with wavelength from 700 to 760 nm, a marked decrease between 760 and 780 nm, and constant values from 780 to 800 nm. Both measured and simulated spectra showed the same behaviour in the far red domain. However max-imum energy reached at 760 nm and between 780 and 800 nm were 1.5 and 2.8 µmol m–2s–1nm–1for
mea-sured and simulated values, respectively.
In sunflecks, both measured and simulated spectra had similar shapes as that of incident radiation (figures 4b and 4d). Spectral energy was however less that of inci-dent radiation between 400 and 720 nm, and higher than that of incident radiation from 720 to 800 nm. The small-est spectral energy values of 2 µmol m–2s–1nm–1were
then encountered at 400 nm while maximum values of 8 µ mol m–2 s–1 nm–1 occured at 760 and 780 nm.
Measurements showed that spectra at 6.5, 5.7 and 4.7 m were very close while that at 3.8 m was markedly lower. In contrast, simulated spectra did not show any radiation energy gradient with height within the crown.
3.4 MAR parameters
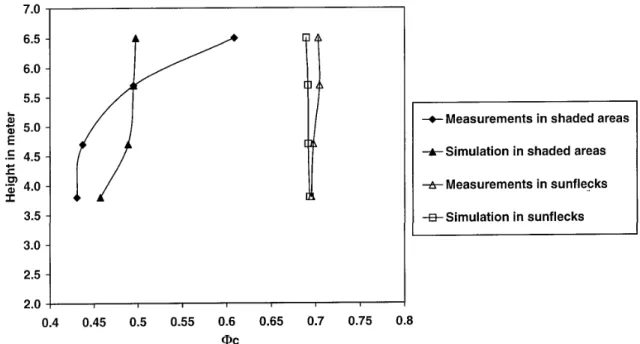
Spatial variations of phytochrome photoequilibria Φc
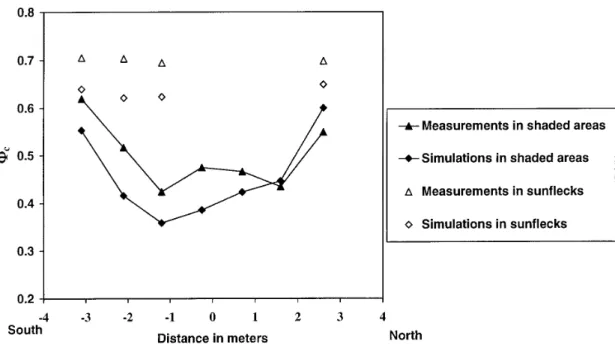
estimated from measured and simulated spectra are given in figure 5. In shaded areas, measured values ranged between 0.4 and 0.6 for both the vertical and hor-izontal profiles (figures 5a and 5b). Measured Φcin
shaded areas were highest at the top of the canopy (figure 5a) and at the periphery of the tree crown (figure 5b), i.e. where the contribution of incident tion to irradiance is higher than that of scattered radia-tion. Simulated Φc varied between 0.35 and 0.58, i.e. a
similar range as measured values. However the simulated vertical gradient of Φcwas more less marked in
compari-son with the measured one, while values simulated along the horizontal profile tended to lower than measured Φc.
In sunlit areas, both measured and simulated values of Φc
were close to 0.7, and they did not show any spatial vari-ation; This value is close to that of the incident radiation. Simulated values in sunflecks tended to be lower than measured Φc, especially in the horizontal profile.
Figure 6 shows the relationship between Φc and the
red: far red ratio (ζ) where all points (i.e. in shaded and sunlit areas) were included. Both measurements and model outputs showed marked variations of ζ(from 0.3 to 1.2), while the corresponding variations of Φc were
less important (from 0.35 to 0.68). The same relationship accounted for both measured and simulated values.
Figure 5a. Vertical profile of simulated and measured phytochrome photoequilibria Φcin shaded and sunlit areas under clear sky conditions.
Figure 5b. Variation of the simulated and measured phytochrome photoequilibria Φcin a North-South horizontal profile in shaded and sunlit areas under clear sky conditions.
Figure 6. Simulated and measured relationship between the phytochrome photoequilibria Φcand the zeta ratio under clear sky condi-tions. All points in sunflecks and shaded areas are represented.
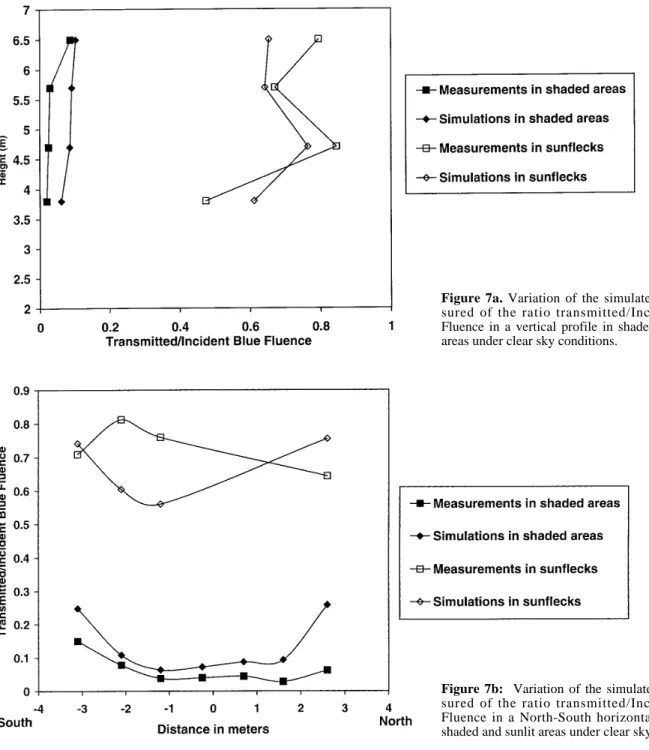
Spatial variations of blue photon irradiance estimated from measured and simulated spectra are given in
figure 7. In shaded areas, measured blue transmittance
(i.e. the ratio of transmitted to incident blue irradiance) ranged between 0.02 and 0.15 for both the vertical and horizontal profiles (figures 7a and 7b). As for Φc,
high-est values were found at the top of the canopy (figure 7a)
and in the periphery of the crown (figure 7b). Simulated blue transmittance in shaded areas showed the same pat-terns of vertical and horizontal variations, but values were higher since they ranged between 0.06 and 0.25. Maximum values, i.e. greater than 0.20, and also maxi-mum differences between simulated and measured data were found at the extremities of the horizontal profile
Figure 7a. Variation of the simulated and
mea-sured of the ratio transmitted/Incident Blue Fluence in a vertical profile in shaded and sunlit areas under clear sky conditions.
Figure 7b: Variation of the simulated and
mea-sured of the ratio transmitted/Incident Blue Fluence in a North-South horizontal profile in shaded and sunlit areas under clear sky conditions.
(figure 7b). In sunflecks, measured and simulated blue transmittance ranged between 0.47 and 0.85 and between 0.56 and 0.76, respectively. Horizontal and vertical vari-ations of blue transmittance did not appear to be related to position in the crown. At least from simulation data, such variations are due to variations in diffuse to global radiation ratio.
4. DISCUSSION
High values of leaf area density were found in the upper part of the West-East cross section and in the southern part of the North-South cross section, i.e. where light availability was higher. Previous studies showed spatial variations in leaf area density within tree crowns, where foliage density generally increased with light availability [6, 28].
Standard deviations of mean leaf reflectance and transmittance indicated that the spectral domains in which optical properties were most variable were the green and the far red domain. These results agreed with a previous report on the variability in leaf optical proper-ties [11]. The low variability of the mean leaf reflectance in comparison with the mean leaf transmittance was attributed to morpho-histological characteristics such as water and chlorophyll contents [3, 11]. Those morpho-histological characteristics also depended on light micro-climate experienced by the leaves [11]. The model hypothesis of equal reflectance and transmittance was verified in the green domain and the far red domain where variability was high.
Spectral measurements were very punctual. This pre-vents to use them to complete model testing for MAR application. Nevertheless, the confrontation between measured and simulated data could help for a discussion on the needs for spectra simulation for MAR purposes. Both measured and simulated spectra showed the same qualitative behaviours. Shaded areas were characterised by a strong absorption in the PAR domain while canopy transmission in the NIR domain was much higher. Sunlit areas showed spectrum shapes much closer to that of the incident radiation, with spectral irradiance higher than incident irradiance in the NIR band. Such results agree with the scarce spectral measurements reported in the lit-erature [in shaded areas, 10; Varlet-Grancher, unpub-lished data in Guyana forests]. The results are also diffi-cult to compare with other model outputs since i) few radiation transfer models have been applied to spectral data [1, 13], ii) all radiation transfer models have dealt with mean spectra, i.e. with no distinction of shaded and sunlit areas. In this study focusing on MAR, we chose to make such a distinction because the plant sensors (i.e.
cryptochromes and phytochromes) are located in either shaded or sunlit areas, i.e. they are not submitted to a mean light microclimate. From a quantitative point of view, measured and simulated spectra do not closely match each other. In shaded areas maximum spectral flux density simulated in the NIR waveband is about twice the measured ones (figure 4). This clearly indicates that scattering is not correctly simulated. Simplified assumptions (i.e. equality between reflectance and trans-mittance, isotropic leaf scattering) are probably responsi-ble of the model weakness. Notice that the radiation model was mainly and successfully used in the PAR waveband [22, amongst others], where the amount of radiation involved in scattering is low. In sunlit areas, simulated spectral flux was assumed to be that of shaded areas plus the incident direct beam contribution (Eq. 5). If this assumption is verified, this means that the differ-ence between spectral radiation in sunlit and shaded areas should be equal to incident direct radiation.
Figures 4 shows deviations between measured and
simu-lated differences between sunlit and shaded areas. This underlines high sensitivity of spectral fluxes to the dif-fuse to global radiation ratio, while such data are scarce-ly available.
Both measured and simulated values of the phy-tochrome photoequilibrium Φcwere in the range of
val-ues reported in the literature for tree canopies [4, 8]. Values of Φc in sunlit areas was constant (about 0.7) and
equal to that of the incident radiation [4]. In case of sunny conditions, this is simply explained by the prepon-derant contribution of the direct radiation (which does not experience any spectral modification) and because Φcis computed as a ratio of radiation (see Eq. 7). In
shaded areas, Φcshowed significant variations according
to position in the crown (figures 5). Both measured and simulated Φcshowed the same relationship with red to
far-red ratio (figure 6). This means that Φccould be
esti-mated from spectral simulation at only to wavebands (660 and 730 nm), instead of an exhaustive description of the spectrum from 400 to 800 nm.
In the case of blue light, differences in transmittance between shaded and sunlit areas was marked, especially because leaf absorption of blue radiation is high. This is in agreement with blue light measurements made in peach trees [4]. Blue transmittance in shaded areas was clearly related to position within the crown. In sunflecks, blue transmittance was again simply simulated as that in shaded areas plus direct to incident radiation ratio. This shows once more that accurate estimation of MAR requires spectral information about the diffuse to global radiation ratio.
5. CONCLUSION
This work was a first attempt at describing and simu-lating MAR spatial variations within a tree canopy. Despite the relatively correct MAR prediction, the model of Sinoquet and Bonhomme (1992) was unable to simu-late data close to the measured values, especially in the far red. This is probably due to: i) the small amount of locally measured spectra within the canopy which could have been used for the comparison; ii) the simplistic treatment of scattering in the model; iii) the high sensi-tivity of input parameters such as the diffuse to incident radiation ratio; iv) the severity of the test, since the model was used to simulate spectral and local fluxes in either shaded or sunlit zones. From our knowledge no model (either based on the turbid medium analogy or ray-tracing techniques in virtual plants) has been tested against filed data at such a small scale. This however suggests that the assessment of MAR distribution in canopies would need more accurate calculation of radia-tion scattering, a precise model of the spectral of the diffuse proportion of diffuse, and probably a fine description of canopy structure. Such assumptions will be tested by comparing the model of Sinoquet and Bonhomme (1992) with a 3D model where scattering is better considered (e.g. [7]), and with models based on ray-tracing in virtual plants. In particular, it could be necessary to include leaf and soil bidirectional optical properties instead of assuming them as lambertian diffusers.
Finally, we expect that assessment of MAR distribu-tion within tree canopies will help in establishing quanti-tative relationships between MAR and morphogenetic responses at organ scale. This could ultimately allow the integration of photomorphogenesis in structural-func-tional tree models.
Acknowledgements: We are grateful to the Region
Poitou-Charentes for their financial support.
REFERENCES
[1] Anisimov O., Fukshansky L., Light-vegetation interac-tion, A new stochastic approach for description and classifica-tion, Agric. Forest. Meteorol. 66 (1993) 93-110.
[2] Anisimov O., Fukshansky L., Optics of vegetation: implications for the radiation balance and photosynthetic per-formance, Agric. Forest. Meteorol. 85 (1997) 33-49.
[3] Baldini E., Facini O., Nerozzi F., Rossi F., Rotondi A., Leaf characteristics and optical properties of different woody species, Trees 12 (1997) 73-81.
[4] Baraldi R., Rossi F., Facini O., Fasolo F., Rotondi A., Magli M., Nerozzi F., Light environment, growth and
morpho-genesis in a peach tree canopy, Physiol. Plant. 91 (1994) 339-345.
[5] Baraldi R., Rapparini F., Rotondi A., Bertazza G., Effects of simulated light environments on growth and leaf morphology of peach plants, J. Horticult. Sci. Biotechnol. 73 (1998) 251-258.
[6] Cohen S., Mosoni P., Meron M., Canopy clumpiness and radiation penetration in a young hedgerow apple orchard., Agric. Forest. Meteorol. 76 (1995) 185-200.
[7] Gastellu-Etchegorry J.P., Demarrez V., Pinel V., Zagolski F., Modeling radiative transfer in heterogeneous 3-D vegetation canopies, Remote Sens. Environ. 58 (1996) 131-156.
[8] Gilbert I.R., Seavers G.P., Smith H., Photomorpho-genesis and canopy dynamics. Phytochrome-mediated proximi-ty perception accounts for the growth dynamics of canopies of Populus trichocarpa x deltoides “Beaupré”, Plant Cell Environ. 18 (1995) 475-497.
[9] Hayward P.M., Determination of phytochrome parame-ters from radiation measurements, Smith H. (Ed.), London, 1984.
[10] Holmes M.G., Smith H., The function of phytochrome in the natural environment – II The influence of vegetation canopies on the spectral energy distribution of natural daylight, Photochem. Photobiol. 25 (1977b) 533-538.
[11] Knapp A.K., Carter G.A., Variability in leaf optical properties among 26 species from a broad range of habitats, Amer. J. Bot 85 (1998) 940-946.
[12] Kronenberg G.H.M., Kendrick R.E., Phytochrome: The physiology of action., in: Kendrick R.E., Kronenberg G.H.M. (Eds.), Photomorphogenesis in plants, Martinus Nijhoff pub-lish, Dordrecht, 1986, pp. 137-158.
[13] Lemeur R., Rosenberg N.J., Simulating the quality and quantity of short-wave radiation within and above canopies, in: Halldin S. (Eds.), Comparison of Forest Water and Energy Exhange Models, International Society for Ecological Modelling, Copenhagen, 1979, pp. 77-100.
[14] Monteith J.L., Spectral distribution of light in leaves and foliage, in: Smith H. (Ed.), Light and plant development, Butterworth, London, 1976, pp. 447-460.
[15] Moon P., Spencer D.E., Illumination from a non-uni-form sky, Trans. Illum. Eng. Soc. 37 (1942) 707-726.
[16] Olesen T., Daylight spectra (400–700 nm) beneath sunny, blue skies in Tasmania, and the effect of a forest canopy, Aust. J. Ecol. 17 (1992) 451-461.
[17] Osizik N.M., Radiative Transfer, Interscience W., New York, 1981.
[18] Ritchie G.A., Evidence for red:far red signaling and photomorphogenic growth response in Douglas-fir (Pseuditsuga menziesii) seedlings, Tree Physiol. 17 (1997) 161-168.
[19] Ross J., The radiation regime and architecture of plant stands, The Hague, 1981.
[20] Rossi F., Facini O., Holmes M.G., Light quality effects on bud differentiation in apple, XXIII International Horticultural Congress, Italy, 1990.
[21] Senger E., Schmidt W., Cryptochrome and UV recep-tors: diversity of photoreceptors., in: Kendrick R.E., Kronenberg G.H.M. (Eds.), Photomorphogenesis in plants, Martinus Nijhoff publish, Dordrecht, 1986, pp. 137-158.
[22] Sinoquet H., Bonhomme R., Modeling radiative trans-fer in mixed and row intercropping systems, Agric. Forest. Meteorol. 62 (1992) 219-240.
[23] Sinoquet H., Rivet P., Godin C., Assessment of the three-dimensional architecture of walnut trees using digitising, Silva Fenn. 31, 3 (1997) 265-273.
[24] Smith H., Light quality, photoperception, and plant strategy., Annu. Rev. Plant. Physiol. 33 (1982) 481-518.
[25] Smith H., Holmes M.G., The function of phytochrome in natural environment – III. Measurement and calculation of
phytochrome photoequilibria, Photochem. Photobiol. 25 (1977) 547-550.
[26] Varlet-Grancher C., Moulia B., Sinoquet H., Russell G., Spectral modification of light within plant canopies: how to quantify its effects on the architecture of the plant stand, in: Varlet-Grancher C., Bonhomme R., Sinoquet H. (Eds.), Crop structure and light microclimate: Characterization and applica-tions, INRA, Versailles, 1993, pp. 427-452.
[27] Varlet-Grancher C., Gautier H., Plant morphogenetic responses to light quality and consequences for intercropping, in: Sinoquet H., Cruz P. (Eds.), Ecophysiology of tropical intercropping, INRA, Versailles, 1995, pp. 231-256.
[28] Whitehead D., Grace J.C., Godfrey M.J.S., Architectural distribution of foliage in individual Pinus radiata D. Don crowns and the effects of clumping on radiation inter-ception, Tree Physiol. 7 (1990) 135-155.