Publisher’s version / Version de l'éditeur:
Vous avez des questions? Nous pouvons vous aider. Pour communiquer directement avec un auteur, consultez la
première page de la revue dans laquelle son article a été publié afin de trouver ses coordonnées. Si vous n’arrivez pas à les repérer, communiquez avec nous à [email protected].
Questions? Contact the NRC Publications Archive team at
[email protected]. If you wish to email the authors directly, please see the first page of the publication for their contact information.
https://publications-cnrc.canada.ca/fra/droits
L’accès à ce site Web et l’utilisation de son contenu sont assujettis aux conditions présentées dans le site
LISEZ CES CONDITIONS ATTENTIVEMENT AVANT D’UTILISER CE SITE WEB. Inter-Noise 2003 [Proceedings], pp. 2644-2651, 2003-08-01
READ THESE TERMS AND CONDITIONS CAREFULLY BEFORE USING THIS WEBSITE.
https://nrc-publications.canada.ca/eng/copyright
NRC Publications Archive Record / Notice des Archives des publications du CNRC :
https://nrc-publications.canada.ca/eng/view/object/?id=819f1698-086c-4476-bb24-f5b24c091298 https://publications-cnrc.canada.ca/fra/voir/objet/?id=819f1698-086c-4476-bb24-f5b24c091298
NRC Publications Archive
Archives des publications du CNRC
This publication could be one of several versions: author’s original, accepted manuscript or the publisher’s version. / La version de cette publication peut être l’une des suivantes : la version prépublication de l’auteur, la version acceptée du manuscrit ou la version de l’éditeur.
Access and use of this website and the material on it are subject to the Terms and Conditions set forth at
Localization of noise source and primary reflections in a room using a spherical array and aggregate beamforming technique
Localization of noise source and primary reflections in a room using a spherical array and aggregate beamforming technique
Havelock, D.I.; Daigle, G.A.; Gover, B.N.
NRCC-46631
A version of this document is published in / Une version de ce document se trouve dans : Inter-Noise 2003, Seogwipo, Korea, August 25-28, 2003, pp. 2644-2651
The 32nd International Congress and Exposition on Noise Control Engineering Jeju International Convention Center, Seogwipo, Korea,
August 25-28, 2003
[N275] Localization of noise source and primary reflections in a room using a spherical array and aggregate beamforming technique
David I. Havelock
National Research Council, Institute for Microstructural Sciences 1200 Montreal Rd., Ottawa ON K1A 0R6
email address: [email protected]
Gilles A. Daigle
National Research Council, Institute for Microstructural Sciences 1200 Montreal Rd., Ottawa ON K1A 0R6
Bradford N. Gover
National Research Council, Institute for Research in Construction 1200 Montreal Rd., Ottawa ON K1A 0R6
ABSTRACT
Aggregate beamforming is described as an alternative to conventional beamforming for reducing the hardware complexity of arrays with many elements. A 32-element spherical array has been designed for the analysis of directional and spatial variations of sound fields in rooms. These two technologies are combined for the purpose of localizing early reflections within a room. The alternative beamforming method and conventional methods, such as delay and sum and superdirective beamforming, are compared. The effectiveness of the methods for identifying significant reflectors and, ultimately, assessing noise control strategies is examined.
KEYWORDS: Beamforming, Microphone array, Source localization
INTRODUCTION
A noise source localization system within a room must be capable of distinguishing direct and reflected sounds. For noise control indoors it is advantageous to have accurate knowledge of the location of both the noise source and its major reflections. Beamforming with microphone arrays [1] can be simpler than holographic techniques and is more easily applied to large volumes. In this study we demonstrate that simplified beamforming methods can provide useful source localization information.
A method for reducing the hardware requirements for a beamforming array has been proposed [2,3]. This method, called aggregate beamforming, makes it possible to eliminate the analog anti-aliasing filters that are normally required on each channel of a microphone array. The method offers other simplifications to array beamforming as well, like reducing the total sampling rate and achieving higher beam-steering resolution without data interpolation.
A 32-element spherical array has been demonstrated [4] for estimating the direction of arrival of sound and sound field anisotropy in a room. This system was carefully calibrated and the array data processing was highly optimized for the application. Here we use the same microphone array with noisier data acquisition equipment and simpler beamforming algorithms.
The ability to resolve noise sources with the 32-element spherical array is compared for: (a) the optimized beamforming method,
(b) basic delay and sum beamforming, and (c) the aggregate beamformer.
THE BEAMFORMERS Optimized Beamformer
Optimized beamforming is discussed, for example in [5]. The optimized beamformer output
Bopt is
∑
− = ⊗ = 1 0 opt M m m m x h B , (1)signal on sensor m. The beamforming time delays are applied implicitly by the phase response of the FIR filter and the delays are not constrained to integral multiples of the sampling interval. Each beam direction requires its own set of optimized filter coefficients. For this study, the beamformer was optimized assuming a ratio of signal to uncorrelated noise of 5 dB over the frequency band 1000 to 3300 Hz. Designs for lower snr, which would theoretically provide better array gain at lower frequencies, were found to be ineffective at the relatively high noise and inter-channel variations of the data acquisition system.
Delay and Sum Beamformer
The delay and sum beamformer output BDS is obtained by summing the weighted and delayed
sensor channel signals,
) ( ) ( 1 0 DS m M m m mx n W n B =
∑
− τ − = . (2)The beamforming time delay τm must be quantized to the sampling interval (for basic delay
and sum beamforming) unless the sensor data is first interpolated to a higher sampling
resolution (which is not done here). Each beam steering direction requires its own set of time delays. The channel weights Wm are all equal and sum to unity for this study.
Aggregate Beamformer
The aggregate beamformer [2,3] employs a random channel-sampling method. The aggregate
beamformer output Bagg is obtained by decimating the time-aligned sequence of all the
sampled data, ) ( ) ( ) (n h k Z nK k B d os k agg =
∑
′ − , (3a)where hd is a decimation filter, Kos is the decimation (or oversampling) factor given by the
ratio of the total sampling rate of the array to the final desired signal sampling rate, and Z′ is
derived from the time-aligned sequence of sampled data Zagg
) ( ) ( ( ) ( ) agg n x n n n Z = σ′ − τσ′ , (3b)
as explained below. The time delays for each channel τm (with m=σ′(n) ) are determined as for
delay and sum beamforming but quantized to the higher sampling rate. The index σ′(n) is a
(modified) random sequence of channel indices obtained from a uniformly distributed
sequence of channel indices σ modified so as to ensure that only one channel is sampled at a
time. This is done by initially setting σ′ equal to σ and, for each successive a value of n, if
there exist n′<n such that n-τσ(n) = n′- τ σ(n′) then, based on a random choice, either σ′(n′) or
σ′(n) is set to an undefined value (such as ∞). This process is referred to as collision
management. Since the modified sequence σ′ has undefined values, so will Zagg. The final
sequence of sample data Z′ is obtained from Zagg by a process of ‘void filling’, wherein the
undefined entries are simply filled with the most recent previously defined value.
The aggregate beamformer is described in more detail in [2,3]. It provides the same signal output (on average) as the delay and sum beamformer but has an additional small amount of white Gaussian noise. The time delays of the aggregate beamformer are quantized to the total sampling rate of the collected data, thereby avoiding the costly signal interpolation necessary to obtain the same delay quantization with the delay and sum beamformer. An important advantage of the aggregate beamformer is that the incoming signal is reconstructed at a higher average sampling rate (in Zagg), making it unnecessary to apply anti-aliasing filters to each
input channel of the array.
THE MICROPHONE ARRAY
The microphone array has 32 elements and is illustrated in Fig. 1. Each sensor is a 6-mm omni directional electret microphone with an essentially flat frequency response over the audio spectrum. They are positioned on the surface of a sphere 16 cm in diameter at the vertices of a regular geodesic with isosceles triangular faces. The separations of microphones in the geodesic are 5.1 and 5.7 cm. The structure of the array is quite simple, with the electret capsules mounted on spokes radiating cylindrically from a shaft that defines the main axis of the array. The array, its design, and its application to sound field
study, the beamforming directions are constrained to the horizontal plane, with 0 degrees being in the direction of the array’s main axis. The beam width varies with frequency and beamforming method but is nominally about 30 degrees. A total of 36 beams are formed at 10-degree increments on the horizontal plane.
THE EXPERIMENTAL SETUP
The microphone array is suspended at the surface of the floor in a large test room. Two 4’ by 8’ (1.2 by 2.4 m) sheets of plywood, ¾” (19 mm) thick, are positioned vertically on opposite sides of the array so as to form parallel reflecting surfaces 3 m apart. A point source, constructed from a 1.44 m tube 25 mm in diameter attached to a compression driver, is positioned on the floor 1.5 m from the array. The array and source are equidistant from the sheets. Figure 2 shows the configuration of microphone array, source and one of the panels. The walls and ceiling of the test room are far enough away that reflections from their surfaces can be removed by time-gating techniques.
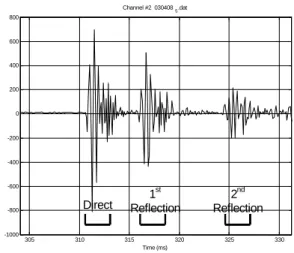
The source signal is a 2.5 ms burst consisting of a smoothly and linearly swept tone from about 1.5 kHz to about 5 kHz. The direct arrival at the array is followed by simultaneous arrival of the first pair of reflections from the panels. Note that these coincident signals would not be resolved by an intensity probe; intensity in this case would only reveal the net energy transport in the
direction of the direct sound. A series of reflections follow the direct arrival and, although several orders of these can be resolved (Fig. 3), only the first and second pairs are considered in this study.
Array
Point Source Reflecting Surface
Figure 2 Experiment setup.
Figure 3 Direct signal and first two reflections. Re 305 310 315 320 325 330 -1000 -800 -600 -400 -200 0 200 400 600 800 Channel #2 030408 5.dat Time (ms) 2nd Reflection 1st Reflection Direct -2648-
Each channel of the array has a pre-amplifier with 40 dB gain and an analog filter with a 500 Hz highpass and a 4 kHz, 12th order anti-aliasing lowpass section. The filter outputs are connected to a switching network that selects array channels under computer control. The output of the switcher goes to a 12-bit analog to digital converter sampling at 320 000 samples/s (10 000 samples/s/channel). The digitized data is transferred to a 233 MHz PC for file storage. The signal processing is done off-line using the raw array data stored on disk.
For aggregate beamforming, the filters are bypassed and the switcher channel is selected in a pre-determined random sequence. The optimized and delay and sum beamforming use sequential sampling and share the same dataset. For the optimized beamforming only, microphone and pre-amplifier calibration corrections are applied.
SIGNAL ANALYSIS
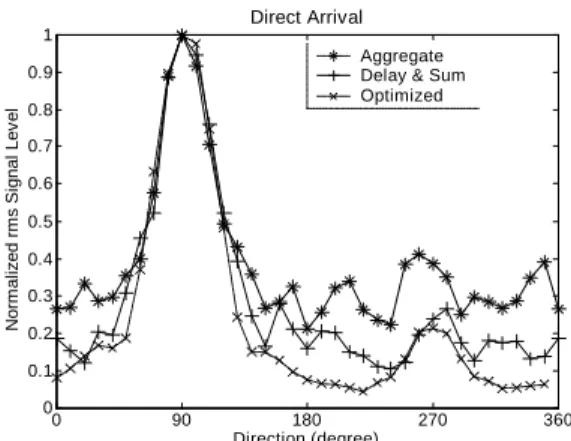
Figure 4 shows the rms signal level in each
beam for each of the beamformers during the direct arrival pulse. (The time of the direct pulse is indicated in Fig. 4.) All of the beamforming methods produce a distinctive peak in the 90 degree direction, which corresponds to the direction of the source. Similarly, Fig. 5 shows the directional response during the arrival of the first reflection pair. In this case, there is little signal arriving from the source but the reflections are clearly seen at about 30 and 150 degrees. The two reflected signals arrive at the array simultaneously yet the beamformers are able to resolve them.
Figure 5 Directional response during 1st reflection.
Figure 4 Directional response during direct arrival. 0 90 180 270 360 0 0.1 0.2 0.3 0.4 0.5 0.6 0.7 0.8 0.9 1 Direction (degree)
Normalized rms Signal Level
Direct Arrival Aggregate Delay & Sum Optimized 0 90 180 270 360 0.1 0.2 0.3 0.4 0.5 0.6 0.7 0.8 0.9 1 Direction (degree)
Normalized rms Signal Level
First Reflection Pair Aggregate Delay & Sum Optimized
Figure 6 Optimal beamformer position estimates from cross-correlation peaks.
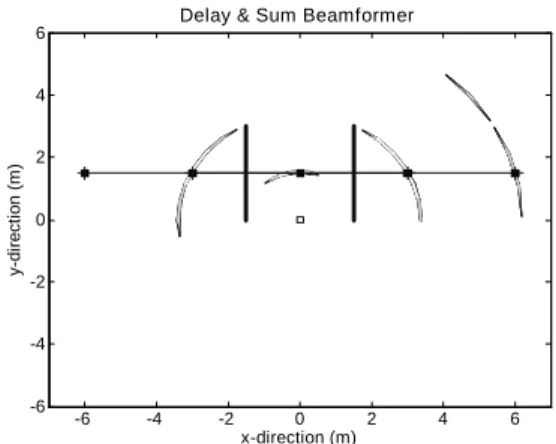
Figure 7 Delay & Sum beamformer position estimates from cross-correlation peaks. The arrival times of the direct signal and its
reflections are estimated by detecting peaks in the cross-correlation of a template of the pulse signal and the beamformed signals. The template is obtained from the waveform of the direct arrival on the 90-degree beam. If the template is normalized to unit power and the co-variance is computed, rather than the cross-correlation, then the height of the covariance pulse measures the rms power relative to that of the direct arrival.
Beamforming and cross-correlation allows the separation of signals by both direction and time of arrival. Figures 6, 7, and 8 show the direct and image source location estimates for the optimized beamformer, the conventional delay and sum beamformer, and the aggregate beamformer, respectively. A representation of the true room geometry is overlaid. The reflecting panels are indicated with heavy lines, the spherical array with an open box, and the source and image positions with solid boxes. A straight line is drawn through the images and the source. Only the optimal beamformer located the two second reflections; the D&S beamformer misses the second reflection on the left while the aggregate beamformer produces a spurious reflection. Nonetheless in each case, the position estimates intersect the actual location of the source and the first reflection pair.
DISCUSSION AND CONCLUSIONS
Although the angular resolution may be improved by using a larger array size, better position estimation precision can also be obtained if the
Figure 8 Aggregate beamformer position estimates from cross-correlation peaks.
-6 -4 -2 0 2 4 6 -6 -4 -2 0 2 4 6 Optimized Beamformer x-direction (m) y-direction (m) -6 -4 -2 0 2 4 6 -6 -4 -2 0 2 4
6 Delay & Sum Beamformer
x-direction (m) y-direction (m) -6 -4 -2 0 2 4 6 -6 -4 -2 0 2 4 6 Aggregate Beamformer x-direction (m) y-direction (m) -2650-
procedure is repeated with the array located at two or more positions within the room. The intersection of the resulting arcs would then more accurately indicate the source and image positions. The magnitude of the covariance function can be used to eliminate spurious peaks due to the side-lobes of the beamformers. The magnitude, together with the propagation time, can also provide information on the surface reflection coefficient. As demonstrated here, the physical geometry of the room can be used to localize the source and its images. The template correlation method may work poorly for sources with high anisotropy. For continuous broadband noise sources, a longer template may be needed to reduce the correlation with the background, reverberant noise energy. As the nature of the source noise becomes more tonal, the range resolution will degrade but it will still be possible to localize sources by triangulating measurements from multiple array positions.
It has been shown that by using beamforming and template matching, received signals can be resolved in both time and direction of arrival so that the physical position of the source and individual reflection images can be resolved and their relative strengths determined. Coincident, coherent arrivals are also resolved with the microphone array whereas this is not possible with intensity probe measurements. The complexity of array processing can be greatly reduced without seriously affecting the efficacy of the method. The aggregate beamformer is an effective alternative beamforming method. Although it requires a decimation filter for each beam, it avoids the use of anti-alias filters, digital interpolation filters, or snr-dependent optimized FIR coefficients on each input channel. Furthermore, for arrays with many elements, it can be operated at a lower total sampling rate without being constrained by the Nyquist sampling condition on individual input channels.
REFERENCES
1. Y.-C. Choi and Y.-H. Kim, “Noise Source Identification in a reverberant field using spherical beamforming,” Proc. INTER-NOISE 2001 (The Hague, 2001).
2. D.I. Havelock, “The aggregate beamformer,” Cdn Acoust. 30, 104-105 (2002).
3. D.I. Havelock, “Beamforming using random channel sampling: the aggregate beamformer,” submitted to J. Acoust. Soc. Am. February 2003.
4. B.N. Gover, J.G. Ryan, and M.R. Stinson, “Microphone array measurement system for analysis of directional and spatial variations of sound fields,” J. Acoust. Soc. Am. 112, 1980-1991 (2002).
5. J.G. Ryan and R.A. Goubran, “Optimum near-field performance of microphone arrays subject to a