Supporting Information for
Enolesters as chain end-functionalizing agents for the living ring opening
metathesis polymerization
Peng Liu, Mohammad Yasir, Helena Kurzen, Nils Hanik, Mark Schäfer and Andreas
F.M. Kilbinger*
University of Fribourg, Chemistry Department, Chemin du Musée 9, CH-1700
Fribourg
E-mail: [email protected]
Experimental
1
H NMR reaction of G1 benzylidene with cis/trans-BAc as terminating agent
Figure S1 Reaction between G1 and but-1-en-1-yl acetate (BAc). Spectra from bottom to top: 0h, 3h, 6h and 96h.
For clarity the full spectral window is not shown. Carbene signals from the residual initiator complex (20.01 ppm in 1H NMR spectra in methylene chloride-d
2, 400 MHz) are present at all times. trans- But-1-en-1-yl acetate at
7.05 ppm (d, J = 12.7 Hz), cis-but-1-en-1-yl acetate at 6.94 ppm (d, J = 6.7 Hz), (Z/E)-but-1-en-1-ylbenzene at 6.38 ppm (d, J = 16.1 Hz, E/Z = 87:13).
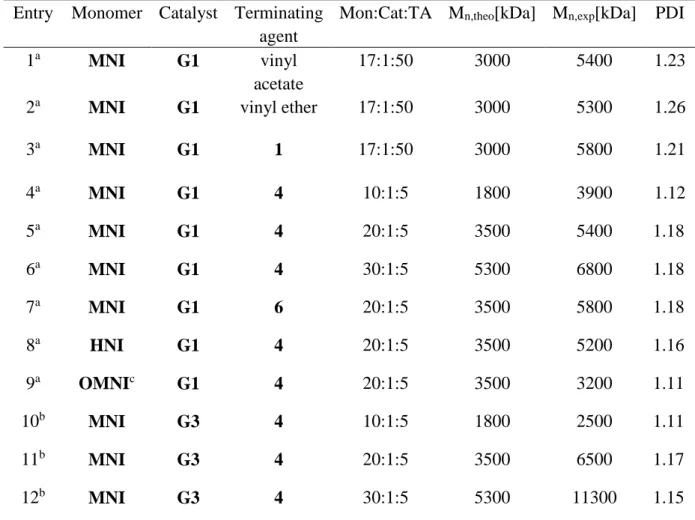
Table S1 Ring-opening Metathesis Polymerization of Different Monomers with Different Catalysts and
Terminating-Agents (TA).
Entry Monomer Catalyst Terminating
agent
Mon:Cat:TA M
n,theo[kDa] M
n,exp[kDa] PDI
1
aMNI
G1
vinyl
acetate
17:1:50
3000
5400
1.23
2
aMNI
G1
vinyl ether
17:1:50
3000
5300
1.26
3
aMNI
G1
1
17:1:50
3000
5800
1.21
4
aMNI
G1
4
10:1:5
1800
3900
1.12
5
aMNI
G1
4
20:1:5
3500
5400
1.18
6
aMNI
G1
4
30:1:5
5300
6800
1.18
7
aMNI
G1
6
20:1:5
3500
5800
1.18
8
aHNI
G1
4
20:1:5
3500
5200
1.16
9
aOMNI
cG1
4
20:1:5
3500
3200
1.11
10
bMNI
G3
4
10:1:5
1800
2500
1.11
11
bMNI
G3
4
20:1:5
3500
6500
1.17
12
bMNI
G3
4
30:1:5
5300
11300
1.15
a Mn were obtained from GPC in THF vs polystyrene standards, RI detector.
b Mn were obtained from GPC in Chloroform vs polystyrene standards, RI detector and the produce for
synthesizing Polymers 10-12 is the same with Polymers 4-6.
c Exo-N-methyl-7-oxanorbornene-2,3-dicarboximide
Table S2 Time-resolved termination reaction of MNI and 4 with G1 in CD2Cl2a followed by 1H NMR
spectroscopy.
a G1 (8.23 mg) was dissolved in 0.5 ml CD2Cl2, then MNI (10 mg) was added. After 1h, terminating agent 4
(dissolved in 0.1 ml of CD2Cl2) was added at t0. The concentration of the propagating Ru carbene signal
(1H-NMR, 400 MHz) was integrated with respect to residual protonated solvent. “0” indicates that no
Eq.
5min 10min 20min 30min 40min 50min 60min 90min 120min
1eq
4.40
1.90
1.12
0.64
0.47
0.22
0.1
0
0
5eq
0.11
0
0
0
-
-
-
-
-
10eq
0
0
0
0
-
-
-
-
-
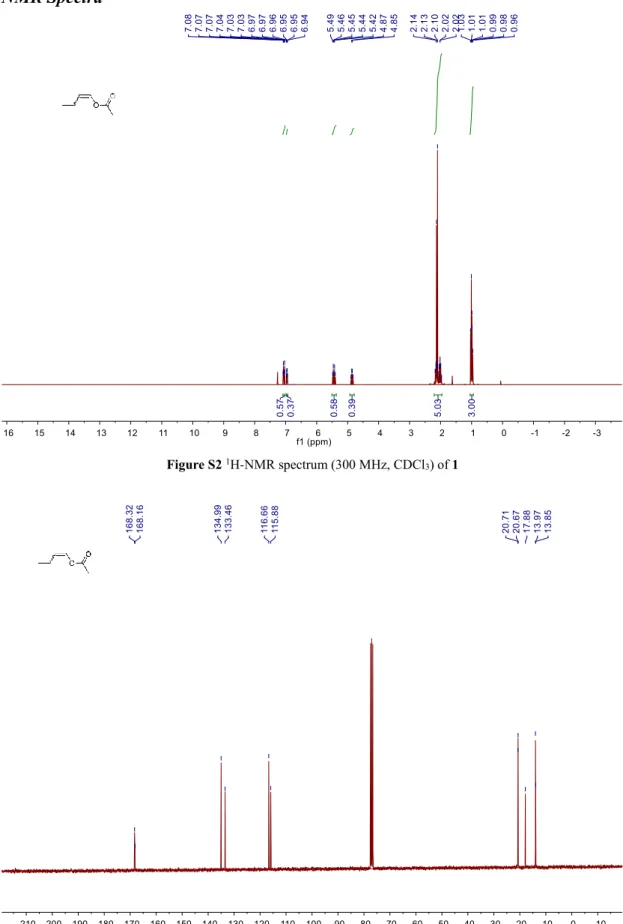
NMR Spectra
Figure S4 1H-NMR spectrum(400 MHz, CDCl3) of 2
Figure S6 1H-NMR spectrum(400 MHz, CDCl3) of 3
Figure S7 13C-NMR spectrum(101 MHz, CDCl
Figure S8 1H-NMR spectrum(400 MHz, CDCl3) of 4
Figure S9 13C-NMR spectrum(101 MHz, CDCl
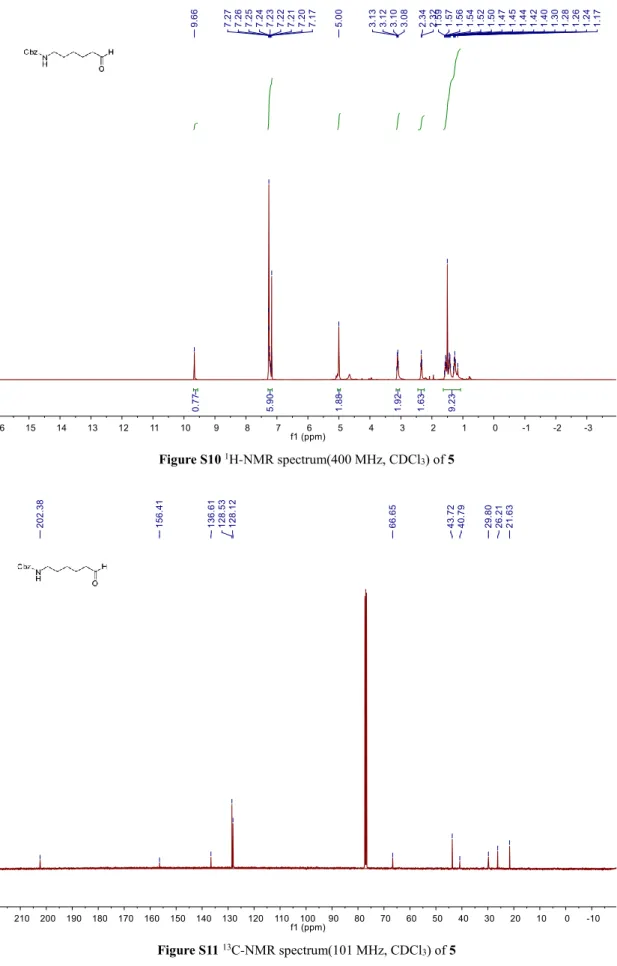
Figure S10 1H-NMR spectrum(400 MHz, CDCl3) of 5
Figure S11 13C-NMR spectrum(101 MHz, CDCl
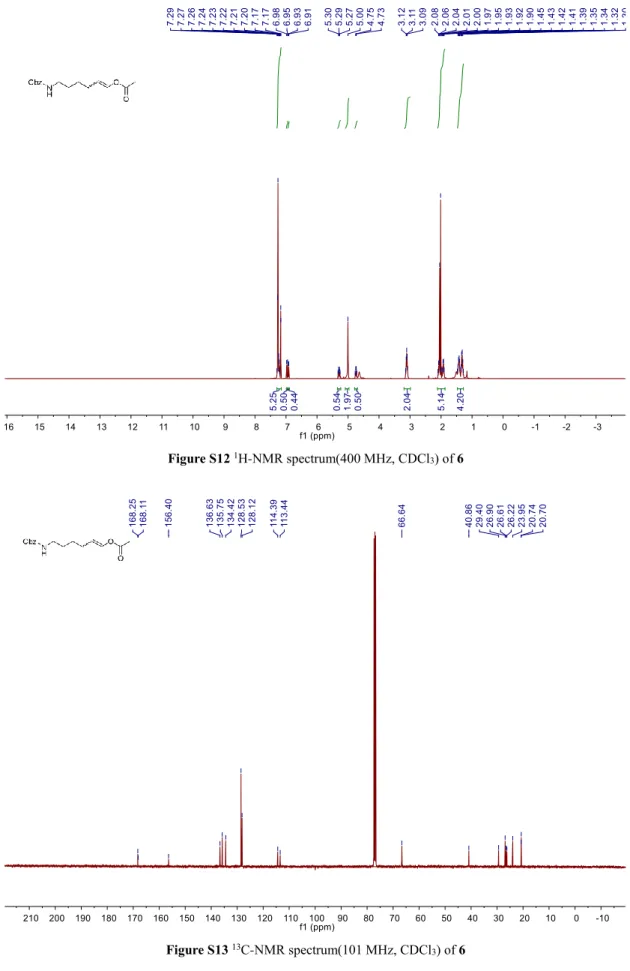
Figure S12 1H-NMR spectrum(400 MHz, CDCl3) of 6
Figure S13 13C-NMR spectrum(101 MHz, CDCl
Figure S14 1H-NMR spectrum(300 MHz, CDCl3) of Polymer 1
Figure S16 1H-NMR spectrum(300 MHz, CDCl3) of Polymer 2
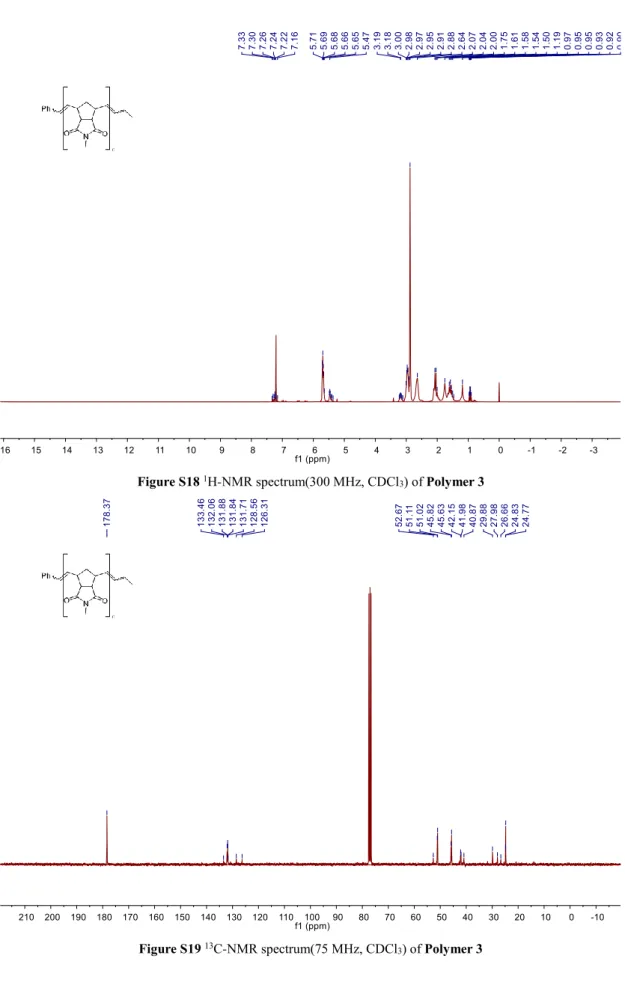
Figure S18 1H-NMR spectrum(300 MHz, CDCl3) of Polymer 3
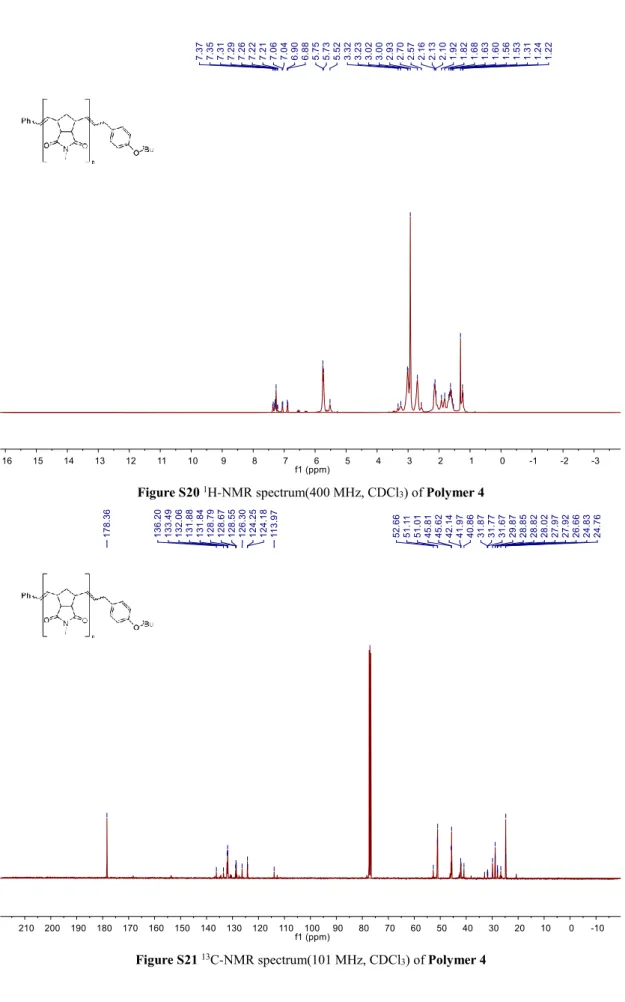
Figure S20 1H-NMR spectrum(400 MHz, CDCl3) of Polymer 4
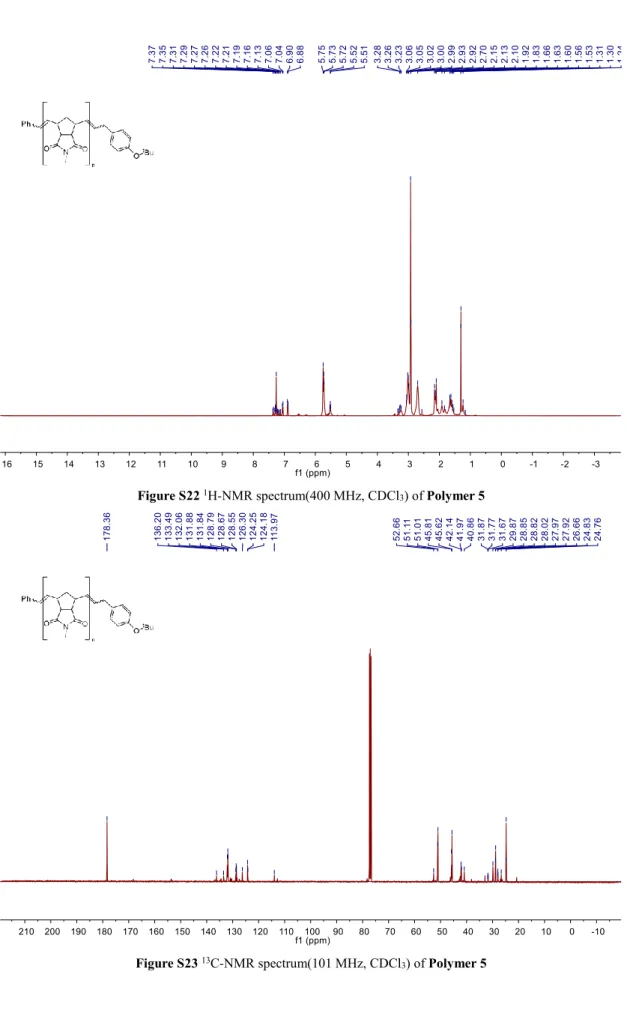
Figure S22 1H-NMR spectrum(400 MHz, CDCl3) of Polymer 5
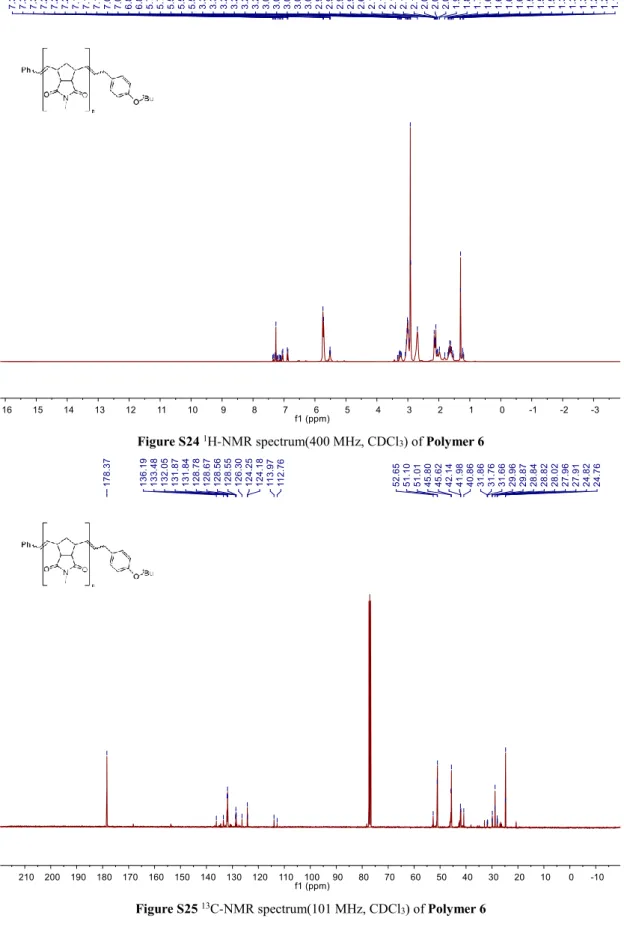
Figure S24 1H-NMR spectrum(400 MHz, CDCl3) of Polymer 6
Figure S26 1H-NMR spectrum(400 MHz, CDCl3) of Polymer 7
Figure S28 1H-NMR spectrum(400 MHz, CDCl3) of Polymer 8
Figure S30 1H-NMR spectrum(400 MHz, CDCl3) of Polymer 9
MALDI-ToF spectrometric data of Polymers
1000 2000 3000 4000 5000 1189.52 1543.68 1721.79 2075.94 2607.19 2962.34 3316.49 3670.64 4024.78 4379.91 4911.11 2635.95 m/zFigure S32 MALDI-ToF mass spectrum (DCTB, NaTFA) of Polymer 1
1000 2000 3000 4000 5000 1366.61 1721.77 2075.94 2253.02 2607.19 2962.34 3316.49 3670.64 4024.78 4379.91 m/z
Figure S33 MALDI-ToF mass spectrum(DCTB, NaTFA) of Polymer 2
2604 2605 2606 2607 2608 2609 2610 2611 2612 2613 2614 2615 2593.16 2594.182595.17 2596.16 2597.16 2606.19 2607.19 2608.18 2609.18 2610.2 2611.2 m/z 2780 2782 2784 2786 2788 2790 2792 2783.25 2784.25 2785.26 2786.26 2787.26 2788.26 m/z
2000 3000 4000 5000 6000 1394.62 1749.79 2103.95 2635.18 3167.44 3344.51 3698.68 4052.81 4407.93 4939.12 5470.27 6002.34 4463.18 m/z
Figure S34 MALDI-ToF mass spectrum(DCTB, NaTFA) of Polymer 3
1000 2000 3000 4000 5000 1174.61352.69 1529.77 1706.85 1883.94 2061 2238.09 2415.18 2592.27 2947.45 3301.59 3478.69 3655.78 4009.94 4365.09 4719.22 m/z
Figure S35 MALDI-ToF mass spectrum(DCTB, NaTFA) of Polymer 4
2632 2634 2636 2638 2640 2634.18 2635.18 2636.19 2637.19 2638.22 2639.192640.19 m/z 3297 3298 3299 3300 3301 3302 3303 3304 3305 3306 3307 3308 3299.61 3300.58 3301.59 3302.59 3303.6 3304.6 3305.6 3318.55 m/z
2000 4000 6000 8000 1529.61 1883.76 2415 2947.26 3478.56 4009.8 5428.44 6136.75 6844.98 7554.14 m/z 4542.06 4896.21
Figure S36 MALDI-ToF mass spectrum(DCTB, NaTFA) of Polymer 5
2000 4000 6000 1352.63 1706.8 1883.9 2238.06 2415.18 2770.36 3124.55 3655.82 4010.03 4365.23 4719.4 5073.57 5427.72 5782.87 6314.07 6845.27 m/z
Figure S37 MALDI-ToF mass spectrum(DCTB, NaTFA) of Polymer 6
4538 4540 4542 4544 4546 4548 4540.08 4541.05 4542.06 4543.06 4544.07 4545.07 m/z 4539.03 4360 4362 4364 4366 4368 4370 4372 4363.26 4364.21 4365.23 4366.21 4367.23 4368.25 m/z 4362.18
2000 3000 4000 1217.59 1571.75 1926.932104.01 2458.18 2812.35 3167.5 3521.66 3875.83 m/z
Figure S38 MALDI-ToF mass spectrum(DCTB, NaTFA) of Polymer 7
2000 4000 6000 1772.82 2020.08 2514.582762.78 3257.16 3751.51 4246.83 4494.01 5482.63 6225.06 6719.32 m/z 4988.28
Figure S39 MALDI-ToF mass spectrum(DCTB, NaTFA) of Polymer 8
2102 2104 2106 2108 2103.02 2104.01 2105.02 2106.01 m/z 2107.03 4492 4496 4500 4492.01 4493.01 4494.01 4495.01 4496.08 m/z 4490.98 4497.01
1500 2000 2500 3000 1363.54 1542.59 1722.66 1901.72 2259.86 2617.98 2976.12 m/z
Figure S40 MALDI-ToF mass spectrum(DCTB, NaTFA) of Polymer 9
1900 1902 1904 1906 1900.71 1901.72 1902.72 1903.73 m/z 1904.69
Figure S41 MALDI-ToF mass spectrum(DCTB, AgTFA) of Polymer 10
2320 2322 2324 2326 2328 2321.059 2322.048 2323.062 2325.067 2326.057 m/z 2392 2394 2396 2398 2400 2402 2394.037 2395.042 2396.0472397.027 2398.033 2399.039 m/z 2334 2336 2338 2340 2342 2344 2336.02 2337.038 2338.032339.023 2340.041 2341.035 2342.028 m/z N O O Ph 12 Ag Mmonoisotopic = 2335.92
1500
2000
2500
3000
3500
1333.506
1510.596
1687.693
1791.784
1968.869
2041.86
2323.062
2396.047
2500.133
2678.222
2855.315
3032.405
3105.371
3209.48
3386.569
3563.64
m/z
Figure S42 MALDI-ToF mass spectrum(DCTB) of Polymer 11
4184 4186 4188 4190 4192 4194 4185.203 4186.2 4187.23 4188.228 4189.225 4190.223 4191.22 m/z 4258 4260 4262 4264 4266 4258.233 4259.172 4260.178 4261.184 4262.19 4263.196 m/z 4198 4200 4202 4204 4206 4208 4199.339 4200.171 4201.17 4202.2024203.201 4204.201 4205.2 4206.299 4207.166 4208.332 4210.298 m/z N O O Ph 23 Na Mmonoisotopic = 4199.87 2500 3000 3500 4000 4500 5000 5500 6000 6500 2946.642 3301.818 3655.978 4187.23 4542.373 5073.625 5427.843 5960.083
m/z
Figure S43 MALDI-ToF mass spectrum(DCTB) of Polymer 12
7726 7728 7730 7732 7734 7736 7738 7728.822 7729.816 7730.81 m/z 7727.829 7731.804 7732.798 7733.701 7734.695 7735.690 7798 7800 7802 7804 7806 7808 7810 7801.805 7802.804 7803.802 7805.709 m/z 7804.801 7806.707 7807.706 7800.807 7742 7744 7746 7748 7750 7752 7743.735 7744.73 7746.719 7747.714 m/z 7745.725 7742.831 7748.756 7749.652 7750.677 N O O Ph 43 Na Mmonoisotopic = 7741.45 6000 8000 10000
6313.201
6845.408
7376.644
7730.81
8085.893
8617.157
9149.309
m/z
Figure S44 1H-NMR spectrum(300 MHz, CDCl
3) of Polymer 10
The polymer end groups corresponding to both, the vinyl acetate (a) as well as the tert.-butyl ether (b) are marked in the spectrum. The inset shows the terminating agent 4.
20.0 20.5 21.0 21.5 22.0 22.5 23.0 23.5 24.0 Retention Volume (ml)
6800 g/mol 5400 g/mol 3900 g/mol
Figure S45 GPC (THF, polystyrene as standards, RI detector) of different molecular weight of poly(MNI)-Ot-Bu
Figure S46 GPC (THF, polystyrene as standards, RI detector) of different molecular weight of poly(MNI)-Ot-Bu
with G1. “■” = Mn (g/mol) and “▲” = Mw/Mn.
Figure S47 GPC (Chloroform, polystyrene as standard, RI detector) of different molecular weight of poly(MNI)-Ot-Bu with G3. “●” = Mn (g/mol) and “●” = Mw/Mn.