CORRELATION OF PULSED AND D-C ELECTRON EMISSION
FROM AN OXIDE CATHODE
R. B. BIEN
TECHNICAL REPORT NO. 73
JUNE 29, 1949RESEARCH LABORATORY OF ELECTRONICS
MASSACHUSETTS INSTITUTE OF TECHNOLOGYC (C
-The research reported in this document was made possible through support extended the Massachusetts Institute of Tech-nology, Research Laboratory of Electronics, jointly by the Army Signal Corps, the Navy Department (Office of Naval Research) and the Air Force (Air Materiel Command), under Signal Corps Contract No. W36-039-sc-32037, Project No. 102B; Department of the Army Project No. 3-99-10-022.
MASSACHUSETTS INSTITUTE OF TECHNOLOGY Research Laboratory of Electronics
Technical Report No. 73 June 29, 1949
CORRELATION OF PULSED AND D-C ELECTRON EMISSION FROM AN OXIDE CATHODE
R. . Bien*
ABSTRACT
Under suitable temperature conditions, i.e. at 8430K and below, it was found that the temperature variation of pulsed and d-c thermionic emission is the same, and yields a single Richardson line. A variety of tubes were tested in which silicon was added as an adulteration in the oxide. Richard-son plots showed that the work functions and log A vary linearly with the percent of adulteration.
At temperatures above 843°K, a rise and a decay in temperature-limited pulsed emissions were observed. The effects were explained by temperature rise of the cathode and possible surface electrolysis or positive ion bombardment.
* This work was done during the period 1947-1948 while the author was on leave from
Hua Chung University, Wuchang, China.
----CORRELATION OF PULSED AND D-C ELECTRON EMISSION FROM AN OXIDE CATHODE
I. Introduction
Decay of thermionic emission from oxide-coated cathodes under d-c tions has been observed by Becker (1), Blewett (2), and under pulsed condi-tions by Sproull (3). One may expect that at fairly low temperatures such effects may become sensibly negligible. The present experiments show that for temperatures of 8430
K and below, pulses applied up to 3 ~Lsec and at 60 pps did not affect the emission, and from 7880K and below, even lO-psec pulses at 180 pps showed no effect. Accordingly, the pulse-emission data used in these correlation studies were taken at low temperatures in order to avoid decay effects. For d-c measurements much lower temperatures were used since it was believed, in the light of the older work referred to above,
that decay would be very slow at 600°K.
A single Richardson line given by the relation log (I/T2) = log A - (E/kT)O represents both d-c and pulsed zero-field currents, independent
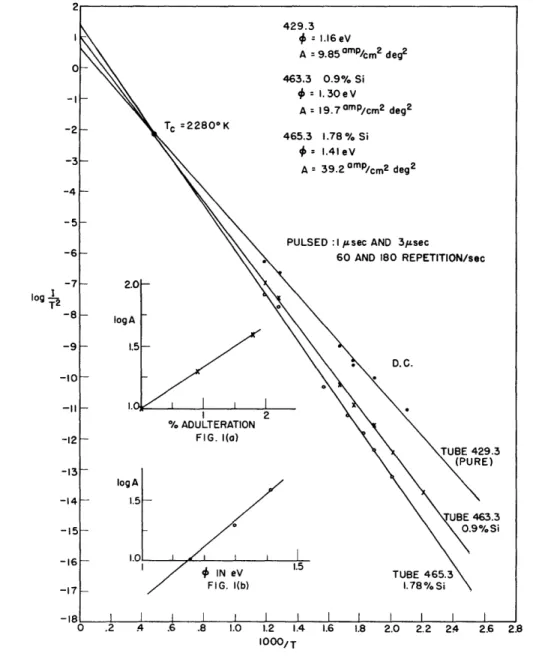
of whether these current values were determined by using Schottky plots, 3/2-power plot extrapolation for pulsed currents, or retarding field plots for d-c currents. In this equation the current density (I) is related to the temperature (T) with A and constants found by experiment. The elec-tron charge is ; k is Boltzmann's constant. It is interesting to note that the work function and observed log A values bear a linear relation to the percent of Si adulteration mixed into the cathode material for the impurity concentrations studied.
At temperatures above 843°K, a complicated behavior of rise and decay0 of current was observed with pulsed emission. It must be noted that at these high temperatures an applied field of not less than 1,000 volts
(16,300 volts/cm) had to be used in order to insure saturation. Qualita-tively these phenomena may be accounted for by the temperature rise of the cathode and surface electrolysis, or by positive ion bombardment.
On the synchroscope used for reading pulse voltage and current, the uncertainty in voltage was 2 to 5 volts or about 5 percent. In all correla-tion experiments, currents at high field were always checked at the end of each run, and the values checked at around 5 percent. After many runs of d-c and pulsed tests, pulsed currents at high fields at the initial tempera-ture were rechecked, usually to about 8 percent; on a few occasions to 10 percent. In a run, d-c test checks were always under 3 percent; and under 8 percent for overall checks.
II. Studies on Correlation
For the first series of experiments, cathodes were prepared on a base metal of type 699 nickel containing about 0.1 percent of Si by using a 60-40 Ba-Sr coating material in its pure state for tube 429.3. For tubes 463.3 and 465.3 Si impurity was introduced into the carbonate to the extent of
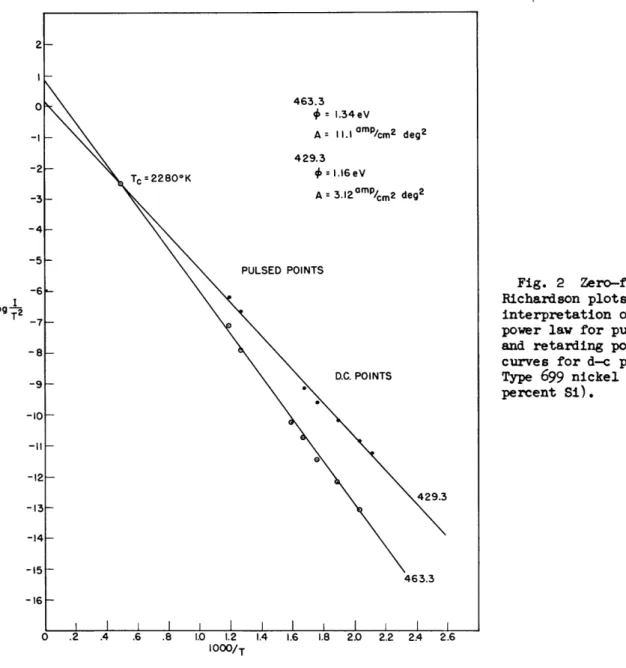
0.9 percent and 1.78 percent respectively. Figure 1 gives the Richardson plots using Schottky plots for zero-field current values. Figure 2 gives the results from using values from 3/2 power plots for pulsed currents at high temperatures, and values from retarding potential plots for d-c emission at low temperatures. It is to be observed in Fig. 1 that log A varies
linearly with the work function and the percent of adulteration. The extrapolated Richardson lines intersect at T = 2,2800K. A comparison of
Fig. 1 Richardson plots based on extrapo-lation of Schottky plots to zero field. (a) Linear relation between log A and percent of Si impuri-ty content. (b) Linear relation between log A and the work function.
-2-log T "
_
Fig. 2 Zero-field Richardson plots based on interpretation of 3/2 power law for pulsed points and retarding potential curves for d-c points. Type 699 nickel core (0.1 percent Si).
Fig. 1 with Fig. 2, where different methods were used to obtain zero-field currents, shows that the same work functions were obtained, and that the intersection points of the Richardson lines were both at T = 2,280°K.
Figure 3 shows the Richardson plots for another series of silicon adulterated cathodes similar to those of Fig. 1 except that the purest nickel (type 499) was used for the core material. The silicon impurity in percent in each of the four cathodes studied is given following the tube number. Although the work functions computed from the lines shown in Fig. 3 are slightly lower than those in Fig. 1, the limited accuracy of the experi-ments does not warrant the drawing of conclusions as to the influence of the core material on work functions. Here again, it is observed that the work functions as well as the values of log A vary linearly with the percent
-3-Iog
T2
_____ I
Fig. 3 Zero-field Richardson plots based on interpretation of 3/2 power
law for pulsed points and retarding
potential curves for d-c points. Type 499 core (purest nickel). Insert (a)
shows linear relations of log A with
impurity content and work function.
of adulteration, and that the intersection point is at a temperature of 1,220°K.
The fact that such a variety of tubes all exhibit single Richardson lines for both pulsed and d-c emission, indicates that, if the bulk and surface conditions are held unchanged, there is no difference in emission mechanism for the two methods in producing emission. With tubes E73-1 and E74-4, pulse and d-c measurements were made at 6380°K and with 500 volts to 800 volts applied. At this temperature and over this range in voltage, the pulse and d-c currents observed were the same.
III. Studies on Time Effects: Pulse Current Rise and Decay Eight tubes,representing quite a wide variety of different cathode
materials, were examined in detail for time effects on the electron emission. They all exhibited much the same general behavior. The details that apply
to two typical tubes are shown in Figs. 4-9.
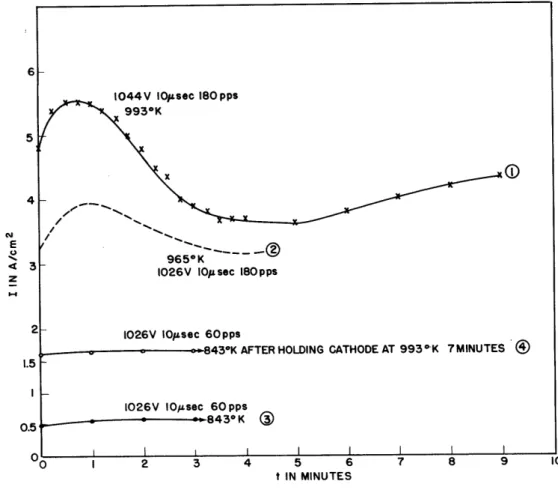
Figure 4 illustrates data taken on tube AE75-11. The core was pure nickel and the coating material was 60 Ba-40 Sr with no intentional
intro-duction of silicon impurities. Curve 1 shows the typical rise in emission
log T
E
z
I-.
t IN MINUTES
Fig. 4 Pulse emission current as a function of the time and
temperature. Pure nickel core (60-40 coating).
that is followed by a distinct reduction in emission as a result of con-tinued operation. Following a short time interval, the temperature was reduced and pulse emission again started (see curve 2). Note again the maximum that occurs within approximately one minute. The third curve was taken immediately at the definitely lower temperature of 8430K. Note that at this temperature the emission is small and no rise occurs in the first minute. The fourth curve illustrates an "activation" effect that takes place when the cathode is held at a high temperature with no current drain.
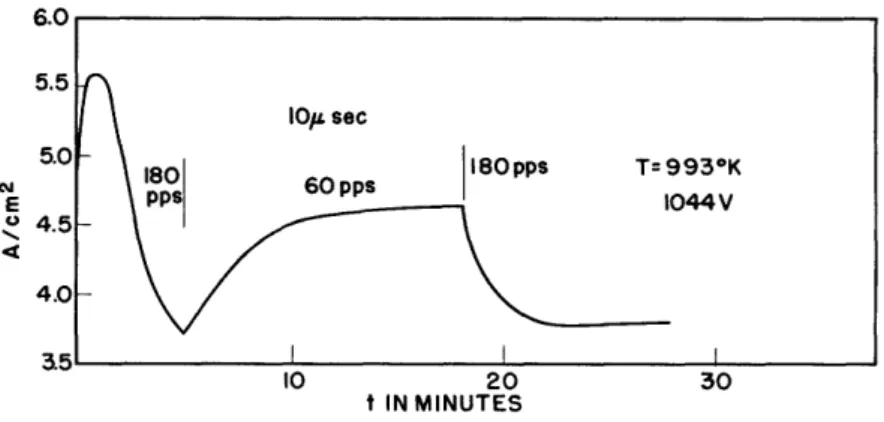
The fact that an activation effect is actually taking place is demon-strated by the sequence of experiments illudemon-strated in Fig. 5. At the be-ginning of the time scale, the pulsing was taking place at 180 pps and continued for five minutes. Note the maximum and the distinct loss in
emission. At the end of five minutes the pulse rate was reduced to 60 and immediately the emission was increased as shown, with a steady state arrived at in about six minutes. After an operation time of thirteen minutes the
pulse rate was again increased to 180 and immediately a reduction in emission took place. The obvious interpretation is that at this high temperature the condition of the cathode changes with the flow of current through it
E
4
t IN MINUTES
Fig. 5 Pulse time curves showing reactivation between pulses.
and tends to recover during the long period of time measured in microseconds between pulses. When that period of time is increased by approximately a factor of 3, more complete recovery is observable.
The initial rise of emission current can be accounted for by the
temperature rise of the cathode. Using extrapolated values from Mutter's (4) data on the specific conductivity of the oxide, exclusive of any considera-tion that ought to be paid to the interface (5), one may calculate the average power developed by the flow of pulse emission current in the body of the oxide. Table 1 shows that in all cases of rise, this pulse heating is quite appreciable when compared to the normal power input for heating the cathode. When the increase in power goes below 3 percent, the rise of electron emission with time also disappears.
TABLE I
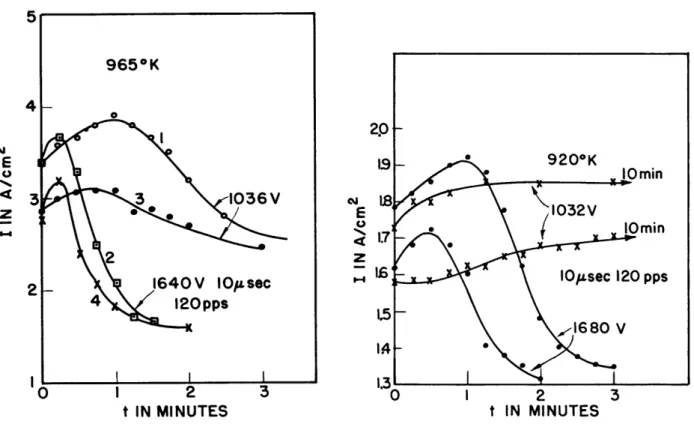
The results of additional experiments are illustrated by the sequence of curves shown in Fig. 6. After the cathode was brought to temperature equilibrium at 9650K, the first run (see curve 1) was taken and observations were made for about 100 seconds, after which the pulsing was stopped for
-6-WATTS EXTRAPOLATED RESISTANCE
Tk NPUT AVERAGE WATTS COATING SPECIFIC RESISTIVITY IN OHMS
INPUT INPUT IN OHMS-CM
993 1.58 0.189 FIG. 4 12 690 13.8 965 1.42 0.092 FIG. 4 6.5 1090 21.8 0.23 FIG. 6 16.9 0.19 FIG.6 13.6 0.15 FIG.6 10.5 0.079 FIG.6 5.5 0.061 FIG. 7a 4.3 920 1.18 0.051 FIG.7b 4.3 2400 48 0.041 FIG.7b 3.5
-15 seconds and data for curve 2 were taken. Note the maximum in curve 2 and the fact that it can best be explained on the basis of cathode heating,
rather than on the hypothesis that the maximum represents some optimum state of cathode activity. Following the termination of run 2, a time interval
of five minutes was allowed for the cathode to achieve some new temperature state, and then run 3 was taken. At the termination of two minutes of run 3, a ten-minute interval was allowed and run 4 was then completed. The evidence all points to the conclusion that the initial rise in current is a heating effect, as described above; the fall may be the result of some electrolytic changes
that take place in the cathode while electron cur-rent flows, and these changes may be in a sense reversed when the cathode stands by at the
oper-t IN MINUTES ating temperature without electron emission.
The fact that there are additional
complica-ig. 6 Emission decay tions, and in particular a "field effect", is curves with time intervals
between runs (15 seconds illustrated by Figs. 7(a) and 7(b). After curve 1 between 1 and 2, 5 minutes was taken, it was found possible to obtain the between 2 and 3, 10 minutes
between 3 and 4). Pure same emission current after the applied potential nickel core (6o-40 coating). had been raised approximately 600 volts. It is
evident that the decay associated with the higher voltages is far more rapid than that first observed. After a short interval
of time, the voltage was reduced and curve 3 was observed. It is obviously quite similar to curve 1 although it starts at a lower current value. Curve 4 again starts with an emission equal to that obtained at the lower voltage and again it is evident that with the increased voltage the decay in emission
is fairly rapid. The tentative explanation for this effect is that associ-ated with the higher voltage the cathode condition is slightly different for a given emission current, and therefore the gradient through the coating
is sufficiently greater so that the electrolytic effects take place more rapidly. The fact that this explanation must be taken as tentative is
immediately clear upon the inspection of Fig. 7(b). Here data observed at a lower temperature show no decrease in emission with time when the applied voltage is 1032, whereas after increasing the voltage to 1680, the
character-istic decay curves are again observed. Although the electrolytic hypothesis is the best that can be offered at present, its application here is obviously involved. -7-E C< Z
z
'-4 _ _ 11_ Illl--·-PII---- ·----· ^I·_-1III-···I-C··-·il··ll-- ·-- ICN
E
z
$-t IN MINUTES
Fig. 7 (a, left) Influence of (b, right) Decay present for low low field. E -z 2 C 0 10 t IN MINUTES 20 N E z w-t IN MINUTES the applied potential on emission decay. temperature and high field, but absent for
E
0
4
z
t IN MINUTES
Fig. 8 Recovery of emission observed under conditions shown with time of stand-by; observation time as short as possible. Low temperature curves of (a, left) are shown in (b, right) with expanded scale.
-8-I 4 3 9650K 1026V 920K 1680V 920K 1680 V (2) 920K 1062 V
_
I
I
-The recovery of the electron emission following stand-by at given
temperatures is illustrated by the typical data shown in Figs. 8(a) and 8(b) (tube 467-1). Previous to the study of the recovery of emission, the cathode was conditioned by allowing it to run for a considerable time during which
the emission decayed to a low value. The observations were then made by applying the pulse voltage for the shortest possible time required for the measurement. The time shown is that during which the cathode stood by at the specified temperature with no current drain. It is evident that recovery took place faster at the higher temperature. The recovery times shown in Figs. 8(a) and 8(b) are in reasonable agreement with Blewett's data (2). From the fact that it takes such a long time to recover the emission, com-pared with the time required for causing the decay, it is evident that the rates differ by a factor of approximately 2000. To compute this factor, consideration must be given to the fact that current is flowing for only one one-thousandth of the total time shown in the various figures.
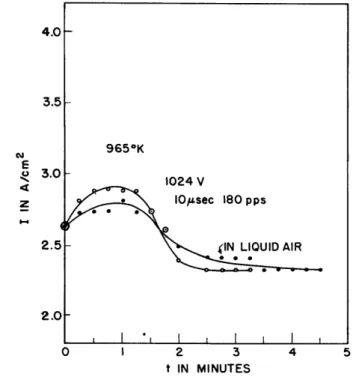
Although the curves presented show a great deal of complication, they were remarkably reproducible when similar starting conditions were maintained. They also represent behavior that was observed on other tubes and thus they may be taken as typical of a far more extensive study than that presented here. In order to look for effects of gas, tube 467-1 was operated in two widely different ambient conditions: namely, at room temperature; and with the tube immersed in liquid air. If the effects that have been described were strongly influenced by the inevitable residual gas in the tubes, it is thought that a greater difference would be found in the performance observed.
4.0 3.5 E , 3.0 z 2.5 2.0 0 1 2 3 4 5 t IN MINUTES
Fig. 9 Cathode heating and emission decay with tube at room temperature and at liquid air temperature to test for "gas" effects.
-9-965°K
1024 V
IOpsec 180 pps
(IN LIQUID AIR
, I , I I I I I ,
__~~~---The fact that the two curves of Fig. 9 are so nearly the same is inter-preted to indicate that the decay effects reported are truly cathode phenomena.
IV. Conclusion
The above experimental facts seem to rule out the effect of residual gases in the tube, and any marked growth of interface resistance during the time of the tests. These results, found with operating temperatures above 9000°K, show that the decay time of electron emission must be at least 2000 times faster than its recovery time which is of the order of minutes. The decay time is of the same order of magnitude as observed by Sproull. However, Sproull was able to reproduce his decay curves at 300 pps to 600
pps, which would indicate a recovery time at most of the order of milli-seconds instead of minutes. Our observed recovery time agrees roughly with Blewett's results. It seems possible that the decay of emission is due to
the depletion of barium on the surface or a rearrangement of the impurity centers resulting from the inward motion of barium ions under the electric field in the oxide when current is drawn. The recovery would be due to diffusion of barium ions back to the surface. The rates need not be the same.
The Richardson plots, Figs. 1, 2, and 3, were all taken at temperatures sufficiently low for such time changes of activity to disappear. They show that without the complications of these time changes of activity, the pulsed and d-c emission values fall on the same line.
Acknowledgment
The writer is greatly indebted to Professor W. B. Nottingham for many helpful suggestions, to Dr. H. Y. Fan for discussion and suggestions in the course of the work, and to the Raytheon Manufacturing Company for supplying all of the tubes tested.
Refe rence s
(1) J. A. Becker, Phys. Rev. 34, 1323 (1929).
(2) J. FP. Blewett, Phys. Rev. 55, 713 (1939); J. App. Phys. 10, 831 (1939). (53) R. L. Sproull, Phys. Rev. 67, 166 (1945).
(4) W. E. Mutter, private communication, R.L.E., M.I.T. (5) A. S. Eisenstein, Phys. Rev. 72, 531 (1947).
* * *