HAL Id: hal-00068815
https://hal.archives-ouvertes.fr/hal-00068815
Submitted on 18 Jul 2020
HAL is a multi-disciplinary open access
archive for the deposit and dissemination of
sci-entific research documents, whether they are
pub-lished or not. The documents may come from
teaching and research institutions in France or
abroad, or from public or private research centers.
L’archive ouverte pluridisciplinaire HAL, est
destinée au dépôt et à la diffusion de documents
scientifiques de niveau recherche, publiés ou non,
émanant des établissements d’enseignement et de
recherche français ou étrangers, des laboratoires
publics ou privés.
IHOP_2002-A Null Case for Convection Initiation
Huaqing Cai, Wen-Chau Lee, Tammy M. Weckwerth, Cyrille Flamant, Hanne
V. Murphey
To cite this version:
Huaqing Cai, Wen-Chau Lee, Tammy M. Weckwerth, Cyrille Flamant, Hanne V. Murphey.
Obser-vations of the 11 June Dryline during IHOP_2002-A Null Case for Convection Initiation. Monthly
Weather Review, American Meteorological Society, 2006, 134, pp.336-354. �10.1175/MWR2998.1�.
�hal-00068815�
Observations of the 11 June Dryline during IHOP_2002—A Null Case for Convection
Initiation
HUAQINGCAI
Advanced Study Program and Atmospheric Technology Division, National Center for Atmospheric Research, Boulder, Colorado
WEN-CHAULEE ANDTAMMYM. WECKWERTH
Atmospheric Technology Division, National Center for Atmospheric Research, Boulder, Colorado
CYRILLEFLAMANT
Institut Pierre-Simon Laplace/Service d’Aeronomie, Paris, France
HANNEV. MURPHEY
Department of Atmospheric Sciences, University of California, Los Angeles, Los Angeles, California
(Manuscript received 16 August 2004, in final form 1 March 2005) ABSTRACT
The detailed analysis of the three-dimensional structure of a dryline observed over the Oklahoma pan-handle during the International H2O Project (IHOP_2002) on 11 June 2002 is presented. High-resolution
observations obtained from the National Center for Atmospheric Research Electra Doppler Radar (ELDORA), S-band dual-polarization Doppler radar (S-Pol), water vapor differential absorption lidar (DIAL) Lidar pour l’Etude des Interactions Aérosols Nuages Dynamique Rayonnement et du Cycle de l’Eau (LEANDRE II; translated as Lidar for the Study of Aerosol–Cloud–Dynamics–Radiation Interac-tions and of the Water Cycle) as well as Learjet dropsondes are used to reveal the evolution of the dryline structure during late afternoon hours when the dryline was retreating to the northwest. The dryline reflec-tivity shows significant variability in the along-line direction. Dry air was observed to overrun the moist air in vertical cross sections similar to a density current. The updrafts associated with the dryline were 2–3 m s⫺1 and were able to initiate boundary-layer-based clouds along the dryline. The formation of this dryline was caused by high equivalent potential temperature air pushing northwestward toward a stationary front in the warm sector.
Middle-level clouds with radar reflectivity greater than 18 dBZe near the dryline were detected by
ELDORA. A roll boundary, which was associated with larger convergence and moisture content, was evident in the S-Pol data. It is found that the instability parameters most favorable for convection initiation were actually associated with the roll boundary, not the dryline. A storm was initiated near the roll boundary probably as a result of the combination of the favorable instability parameters and stronger upward forcing. It is noted that both the 11 June 2002 dryline and the roll boundary presented in this paper would not be identified if the special datasets from IHOP_2002 were not available.
Although all model runs [fifth-generation Pennsylvania State University–NCAR Mesoscale Model (MM5), Meso Eta, and Rapid Update Cycle (RUC)] suggested deep convection over the Oklahoma panhandle and several cloud lines were observed near the dryline, the dryline itself did not initiate any storms. The reasons why the dryline failed to produce any storm inside the IHOP_2002 intensive obser-vation region are discussed. Both synoptic-scale and mesoscale conditions that were detrimental to con-vection initiation in this case are investigated in great detail.
Corresponding author address: Huaqing Cai, Advanced Study Program and Atmospheric Technology Division, National Center for
Atmospheric Research, Boulder, CO 80307. E-mail: [email protected]
© 2006 American Meteorological Society
MWR2998
1. Introduction
During spring and early summer, hot dry air flowing off the semiarid plateau regions of Mexico and the southwest United States meets cooler moist air origi-nating from the Gulf of Mexico, forming a boundary called the dryline (Rhea 1966; Schaefer 1974, 1986). The dryline is a relatively common feature that occurs ⬃40% of the time over the Great Plains in late spring and early summertime and has been studied extensively owing to its important role in convection initiation (e.g., Schaefer 1974; Anthes et al. 1982; Koch and McCarthy 1982; Bluestein and Parks 1983; Bluestein and Parker 1993; Parsons et al. 1991, 2000; Sun and Wu 1992; Zieg-ler and Hane 1993; ZiegZieg-ler et al. 1995; Hane et al. 1993, 1997, 2001, 2002; Shaw et al. 1997; Atkins et al. 1998; Grasso 2000; Peckham and Wicker 2000; Miller et al. 2001; Weiss and Bluestein 2002; Trier et al. 2004). The structure of the dryline has been documented using various observational tools such as surface mesonets, mobile soundings, aircraft in situ measurements (e.g., Ziegler and Hane 1993; Hane et al. 1993, 1997, 2001, 2002), Doppler lidar (Parsons et al. 1991), and airborne Doppler radar with clear-air capability (Atkins et al. 1998; Weiss and Bluestein 2002).
Although drylines are favorable places for convec-tion initiaconvec-tion, not every dryline initiates storms. There have been a few hypotheses trying to explain why con-vection does not initiate even though the dryline itself seems to provide enough upward lift. In a case analyzed by Weiss and Bluestein (2002), they argued that a dry layer between the lifting condensation level (LCL) and the level of free convection (LFC) just atop of the con-vective boundary layer (CBL) played a key role in pro-hibiting convection initiation. When moist boundary layer updrafts enter this very dry layer, entrainment and evaporation will occur and eventually the updraft will lose its buoyancy. Richter and Bosart (2002) stud-ied the synoptic-scale environment of a dryline during the Verification of Origins of Rotation in Tornadoes Experiment (VORTEX 95) and found that a short-wave ridge over the dryline region caused mesoscale subsidence and warming at the middle levels, which prevented convection initiation on that particular day even though earlier forecasts suggested that severe storms would be likely. Another detrimental factor for convection initiation associated with drylines is strong shear within the boundary layer. Ziegler and Rasmus-sen (1998) suggested that strong shear enhances en-trainment and turbulent mixing and as a result of that the updraft will be diluted and becomes much weaker. On 11 June 2002 during the International H2O
Proj-ect (IHOP_2002; Weckwerth et al. 2004), a dryline
formed in the Oklahoma panhandle in the late after-noon and was retreating to the northwest at a speed of ⬃1.5–2.5 m s⫺1. All the IHOP_2002 facilities were
di-rected to the region in hope of deep convection based on early model forecasting. Nevertheless, convection did not initiate despite the fact that all models [fifth-generation Pennsylvania State University–National Center for Atmospheric Research (Penn State–NCAR Mesoscale Model (MM5), Meso Eta, and Rapid Up-date Cycle (RUC)] suggested convection initiation over the Oklahoma panhandle (see the IHOP_2002 field catalog at http://www.joss.ucar.edu/ihop/catalog/ missions.html). Although no convection was initiated near the dryline inside the IHOP_2002 intensive obser-vation region [IOR; defined as the dual-Doppler do-main of the Electra Doppler Radar (ELDORA)], three storms were initiated outside the IHOP_2002 IOR. One tornadic storm (storm A) was initiated along a stationary front near Russell, Kansas, which was⬃200 km northeast of IHOP_2002 IOR. The second smaller storm (storm B) was initiated along the stationary front ⬃100 km north of IHOP_2002 IOR. The third storm (storm C) was initiated along a preexisting fine line, which probably originated from well-defined horizontal convective rolls (HCRs; hereafter, this boundary will be called the roll boundary) ⬃80 km south of the IHOP_2002 IOR (see Fig. 1).
This paper documents the detailed structure and evo-lution of the 11 June dryline using ELDORA (Hilde-brand et al. 1994, 1996), S-band dual-polarization Doppler radar (S-Pol) (Lutz et al. 1995), the water va-por differential absorption lidar (DIAL) Lidar pour l’Etude des Interactions Aérosols Nuages Dynamique Rayonnement et du Cycle de l’Eau (LEANDRE II; translated as Lidar for the Study of Aerosol–Cloud– Dynamics–Radiation Interactions and of the Water Cycle) (Bruneau et al. 2001), Learjet dropsondes (Hock and Franklin 1999), NCAR Mobile GPS/Loran Atmo-spheric Sounding System (MGLASS) soundings (Bluestein 1993), as well as Naval Research Laboratory (NRL) P-3 flight-level data. The S-Pol radar refractivity for mapping surface moisture, the water vapor mea-surements by LEANDRE II, and Learjet dropsondes for constructing the mesoscale environment of the dryline are unique to IHOP_2002 studies since they were not available before IHOP_2002. One novel ob-servation that came out of this paper is the simulta-neous detection of the dryline and middle-level clouds by ELDORA that had yet to be accomplished in pre-vious dryline studies. National Centers for Environ-mental Prediction (NECP)–NCAR reanalysis data (Kalnay et al. 1996; Kistler et al. 2001) are used to investigate the synoptic-scale environment at middle
levels over the dryline. Various factors that may affect convection initiation along the dryline are also dis-cussed.
Section 2 briefly describes the IHOP_2002 project and data methodology. Environmental conditions and S-Pol observations are presented in sections 3 and 4, respectively. ELDORA and LEANDRE II, as well as Learjet dropsonde analyses, are respectively dis-cussed in sections 5 and 6. Factors not favorable for convection initiation in this case are discussed in section 7, and a summary and discussion are presented in sec-tion 8.
2. IHOP_2002 and data methodology
IHOP_2002 is a multiagency field campaign involv-ing scientists from numerous countries. It was
con-ducted over the southern Great Plains in spring and early summer of 2002 (Weckwerth et al. 2004). The major objective of IHOP_2002 is to improve the under-standing of the role of water vapor in various atmo-spheric processes such as convection initiation (CI). Both ground-based and airborne state-of-the-art re-mote sensing technologies are used to monitor the three-dimensional kinematic and thermodynamic varia-tions of the atmosphere in unprecedented high spatial and temporal resolution. It is hoped that these high-resolution observations that were largely unavailable before IHOP_2002 will help to further understanding of where and when convection will initiate. For an over-view of IHOP_2002, please refer to Weckwerth et al. (2004). The major instruments used in this study are discussed below.
FIG. 1. Subjective surface analyses superimposed onto visible satellite images at (a) 2000, (b) 2100, (c) 2200, and (d) 2300 UTC on 11 Jun 2002. Temperature and dewpoint temperature are shown (°C). Wind vectors are plotted with full barb and half barb representing 5 and 2.5 m s⫺1, respectively. The black box in (b) represents the approximate dimension and position of the S-Pol and ELDORA analysis domain (i.e., the IHOP_2002 IOR) for this case.
a. S-Pol radar refractivity
The S-Pol radar developed and operated by NCAR has the unique capability to map atmospheric surface moisture fields by measuring the atmospheric refractive index, N. The basic principle is to detect the phase shift of fixed ground targets such as electrical poles and de-rive the atmospheric refractive index N from the Dopp-ler phase shift (Fabry et al. 1997). In the summertime conditions of the atmosphere near the ground, the re-fractive index N is more sensitive to moisture than other atmospheric-state variables such as pressure and temperature; therefore the derived N value is a good indicator of the moisture content in the atmosphere near the ground. For details of radar-mapping surface moisture using radar refractivity, the reader is referred to Fabry et al. (1997) and Weckwerth et al. (2005).
Fortunately the dryline on 11 June 2002 during IHOP_2002 was fairly close to the S-Pol radar (less than 30 km), and accurate refractivity data were col-lected from the dryline. Both S-Pol radar reflectivity and refractivity are interpolated on the same Cartesian coordinate system as the one used in the ELDORA dual-Doppler analysis. The horizontal grid spacing was 600 m and a Cressman filter with a radius of influence of 600 m was used in the interpolation process. b. ELDORA
ELDORA has been successfully used in a number of field campaigns studying various atmospheric phenom-ena including tornadoes, supercells, fronts, and drylines (Wakimoto et al. 1996, 1998; Atkins et al. 1998; Wakimoto and Cai 2000, 2002; Dowell and Bluestein 2002a,b; Weiss and Bluestein 2002). One unique fea-ture of ELDORA is its high sensitivity (⫺12 dBZe at
10-km range) capable of detecting clear-air returns in the convective boundary layer that is not available to other X-band airborne Doppler radars. This capability is essential for detecting the dryline owing to the dryline’s weak reflectivity. The scanning parameters for this case are listed in Table 1. A careful navigation correction was applied to the original radar data (Lee et
al. 1994; Testud et al. 1995), and each sweep was manu-ally edited using NCAR SOLO software (Oye at al. 1995) to remove spurious echoes such as ground clutter, sidelobes, and second trip echoes.
The along-track resolution of⬃550 m and the sweep angle resolution of ⬃1.5° determined the horizontal grid spacing of 600 m and vertical grid spacing of 300 m, respectively. Accordingly, the fore and aft radar data were interpolated to a Cartesian grid using NCAR REORDER software. Only features with wavelengths larger than 3.6 km are resolvable in the present study based on Carbone et al. (1985). A Cressman (1959) filter is used in the interpolation process with a radius of influence of 600 m in the horizontal and 300 m in the vertical directions. Custom Editing and Display of Re-duced Information in Cartesian Space (CEDRIC; Mohr et al. 1986) was used to synthesize the dual-Doppler winds, and a two-step Leise (1982) filter was applied to the derived wind field. Vertical velocity was obtained by upward integration of the continuity equa-tion. This very same dual-Doppler technique has been used in a number of ELDORA data analyses (Wakimoto et al. 1998; Atkins et al. 1998; Wakimoto and Cai 2000, 2002; Dowell and Bluestein 2002a,b; Weiss and Bluestein 2002). For details of ELDORA, the reader is referred to Hildebrand et al. (1994, 1996).
c. LEANDRE II
LEANDRE II is a water vapor DIAL developed at the Service d’Aéronomie [Centre National de la Re-cherche Scientifique (CNRS)] in cooperation with the Technical Division of the Institut National des Sciences de l’Univers (INSU) and was funded by the Centre National d’Etudes Spatiales (CNES). The design of the LEANDRE II system and the standard DIAL signal processing are discussed in great detail by Bruneau et al. (2001). The reader is referred to Murphey et al. (2006) for the configuration and characteristics of LEANDRE II during IHOP_2002.
LEANDRE II was mounted on the same aircraft (NRL P-3) as ELDORA during IHOP_2002. The lidar was pointing horizontally out of the right side of the aircraft during convection initiation missions. Accord-ing to Bruneau et al. (2001), LEANDRE II has an along-beam resolution of 300 m and water vapor mixing ratio measurement precision better than 0.5 g kg⫺1in the 0–5-km distance range from the aircraft. Because of the saturation of the lidar signal caused by high water vapor content in the CBL and the geometric factor of the lidar system as discussed in Murphey et al. (2006) the usable lidar water vapor measurements only exist between 1.2 and 3.5–4 km along the lidar line of sight.
TABLE1. ELDORA scanning mode.
Antenna rotation rate (° s⫺1) 75
No. of samples 60 PRF (Hz) 3000 Gate length (m) 110 Sweep-angle resolution (°) 1.5 Along-track resolution (m) ⬃550 Maximum range (km) 50
Maximum unambiguous velocities (⫾ m s⫺1) 23.4
A two-pass Barnes (1973) filter was used to interpo-late the lidar water vapor field onto the same Cartesian grid used for ELDORA wind syntheses. The cutoff ra-dius, the smoothing parameter, and the convergence parameter were set to 600 m, 600 m2, and 0.3,
respec-tively. These parameters were chosen so that the reso-lution of the moisture field was comparable to the ELDORA dual-Doppler wind syntheses.
3. Environmental conditions
Subjective surface analyses superimposed on the vis-ible satellite imagery at 2000, 2100, 2200, and 2300 UTC (hereafter, all times are UTC) in the IHOP_2002 do-main are shown in Fig. 1. Upper-level charts indicate no significant disturbances over the Oklahoma panhandle where the IHOP_2002 IOR was located. A well-defined stationary frontal zone can be seen across Kan-sas from southwest to northeast at 2000. Also apparent is the dryline extending from central Kansas into the Oklahoma panhandle. A tornadic storm (storm A) was initiated around 2100 along the stationary front near Russell, Kansas. The winds northwest of the stationary front are generally weak and from the north-northeast, while the relatively strong southerly winds are advect-ing warm moist air southeast of the stationary front. The stationary front initiated another small storm (storm B) around 2207, and storm C was started along a roll boundary detected by S-Pol as a fine line south-east of the retreating dryline around 2210. During the period of intensive data collection from 2100 to 2330, no storms were formed inside the IHOP_2002 IOR in the Oklahoma panhandle, even though middle-level clouds with radar reflectivity greater than 18 dBZeand
boundary layer clouds were observed by ELDORA and IHOP_2002 personnel in the field (F. Fabry 2004, personal communication), respectively. One trend no-ticed from the surface data is the gradual drying of the surface layer throughout the region, with enhanced dry-ing on the northwest side of the dryline. This gradual drying trend may be one of the many reasons that the dryline was prevented from initiating storms in this par-ticular case.
The subjective surface analyses presented in Fig. 1 can be justified by the subjective surface potential tem-perature () and equivalent potential temperature (e)
analyses in Fig. 2. The stationary front across south-central Kansas and the Oklahoma panhandle was char-acterized by a wind shift line. The dryline over the Oklahoma panhandle, which is the main focus of this study, was formed as a result of high e air pushing
northwestward toward the stationary front in the warm sector (Fig. 2b). Both and edifferentials were
asso-ciated with this dryline, although they were relatively weak. Another dryline, which is a more traditional dryline in the sense that it separates the hot dry air on the west from the cooler moist air on the east, can be identified over the Texas panhandle. As the higheair
pushed farther northwestward, these two drylines seem to become connected (Fig. 2d). It should be noted that the dryline over the Oklahoma panhandle was not iden-tifiable if the IHOP_2002 special datasets were not available (surface analyses from NCEP did not show this dryline).
The movement of the dryline within the Oklahoma panhandle during the data collection period from 2000 to 2330 is shown in Fig. 3. The dryline position was obtained from S-Pol radar reflectivity fine lines. It is estimated that the dryline was moving at⬃2.5 m s⫺1 from 138° until 2200 when its speed slowed down to ⬃1.5 m s⫺1. The retreating dryline has been studied in
a number of cases, and the mechanism of its propaga-tion has been debated among different investigators. One hypothesis is the density current analogy. Parsons et al. (1991), among others, demonstrated that the dryline was retreating to the west at a speed close to the expected density current speed. On the other hand, Crawford and Bluestein (1997) showed surface obser-vations that suggest that the passage of a dryline does not resemble that of a typical density current, such as a gust front. This issue will be addressed in section 5 with NCAR mobile soundings and Learjet dropsonde data.
4. S-Pol radar reflectivity and refractivity
The S-Pol radar reflectivity and refractivity fields as-sociated with the 11 June 2002 dryline are shown in Fig. 4. The dryline is delineated by a radar reflectivity fine line that is oriented southwest–northeast. Generally the greatest gradient of radar refractivity is closely associ-ated with or slightly northwest of the radar reflectivity fine line. Larger refractivity values that correspond to greater moisture can generally be seen southeast of the retreating dryline. Noteworthy is the variability of moisture in the along-line direction as demonstrated in the radar refractivity fields northwest of the dryline. The NRL P-3 aircraft tracks are also plotted in Fig. 4. The radar refractivity along the track is compared with the mixing ratio at the flight level (600 m AGL) in Fig. 5. General agreement between the trend of mixing ratio and radar refractivity (N value) are found for the three legs shown in Fig. 4, although much more detailed variations can only be seen in the flight-level data. This is not surprising since the radar refractivity has a lower effective resolution (⬃4 km) compared with that of flight-level data (⬃110 m). Although the S-Pol radar
refractivity data have the same nominal resolution as radar reflectivity (⬃150 m gate length), its effective resolution is much lower as a result of filtering and smoothing by the algorithm used to derive radar refrac-tivity. Other reasons that might contribute to the dis-crepancy of mixing ratio and N values are believed to be 1) the height difference between flight-level data (⬃600 m AGL) and refractivity data (near the surface) and 2) pressure and temperature effects on the radar refractivity in addition to moisture. For a detailed in-tercomparison between S-Pol radar refractivity and other moisture measurements, the reader is referred to Weckwerth et al. (2005).
Another pronounced feature in Fig. 4 is the roll boundary that was associated with a radar reflectivity fine line southeast of the dryline. This roll boundary
probably originated from a well-defined HCR and was associated with much larger radar reflectivity values. Since stronger radar reflectivity of a fine line usually implies stronger convergence and updrafts (Wilson et al. 1994; Hane et al. 2002), the best chance for convec-tion initiaconvec-tion might well be associated with this roll boundary. In fact there was a storm (storm C in Figs. 1 and 13) that was initiated along this roll boundary around 2210.
5. ELDORA, LEANDRE II, and NRL P-3 flight-level data analysis
a. Along-line variability
The dual-Doppler synthesis from ELDORA for the 11 June 2002 dryline is shown in Fig. 6. Also plotted in
FIG. 2. Potential temperature () and equivalent potential temperature (e) analyses superimposed on the visible satellite images at
2000 and 2200 UTC on 11 Jun 2002: (a)at 2000 UTC, (b)eat 2000 UTC, (c)at 2200 UTC, and (d)eat 2200 UTC. Wind vectors
are plotted with full barb and half barb representing 5 and 2.5 m s⫺1, respectively.
the right panels of Fig. 6 are the echoes from the middle-level clouds near the dryline observed by ELDORA. In the high-resolution ELDORA observa-tions of radar reflectivity, the dryline is shown with significant along-line variability that has been docu-mented in previous studies (Atkins et al. 1998). The dryline was fairly linear in the radar reflectivity field at 2108–2116 (Fig. 6a). By 2214–2228, it developed a kink near the middle of the domain (Fig. 6c). As a result of that, the NRL P-3 actually flew within the dryline start-ing around 2221:30 when the flight-level mixstart-ing ratio showed strong variability (Fig. 5b). The mixing ratio at flight level shows a sharp drop from 13 to 9 g kg⫺1at 2223:30 as the P-3 completely penetrated the kink in the dryline. The moisture recovered shortly after 2225 when the P-3 was southeast of the dryline again (see Figs. 5b and 6c).
The strong variability of the moisture field along the dryline during 2218–2227 was also nicely captured by LEANDRE II. Figure 7 shows the water vapor mixing ratio obtained by the lidar superimposed on dryline-relative winds, radar reflectivity, and vertical velocity within the box shown in Fig. 6c. Clearly the dryline demonstrated considerable along-line variability both in terms of radar reflectivity and water vapor mixing ratio. The dryline-relative winds have a larger cross-line component northwest of the dryline kink region within the dry air, confirming that the dryline kink was a pocket of dry air pushing eastward. As shown by the S-Pol radar reflectivity and refractivity data in Fig. 4, Fig. 7 confirms that the radar reflectivity fine line is
closely associated with the greatest moisture gradient of the dryline. A careful examination of the relation be-tween local maxima of radar reflectivity, water vapor mixing ratio, and vertical velocity suggests that gener-ally the radar reflectivity maxima are closely associated with pockets of high moisture content air and updrafts with a few exceptions at the northeast corner of Fig. 7. There is also strong indication that stronger reflectivity values tend to correspond to stronger updrafts, which is consistent with previous findings (Wilson et al. 1994; Hane et al. 2002).
The dryline became quasi-linear again during 2310– 2321 and the general trend of weakening radar reflec-tivity continued (Figs. 6e,f). The flight-level mixing ra-tio confirms that the P-3 is on the dry side of the mois-ture gradient except at the very beginning of the flight leg where large variations of moisture were observed (Fig. 5c). The reason for this is because although gen-erally the aircraft was flying on the dry side, it was near the reflectivity maxima at the beginning of the track (Fig. 6e). Remember the reflectivity fine line is a good indicator of a larger moisture concentration; therefore when the P-3 was getting closer to those reflectivity maxima, the moisture increased dramatically.
b. Cross-line variability
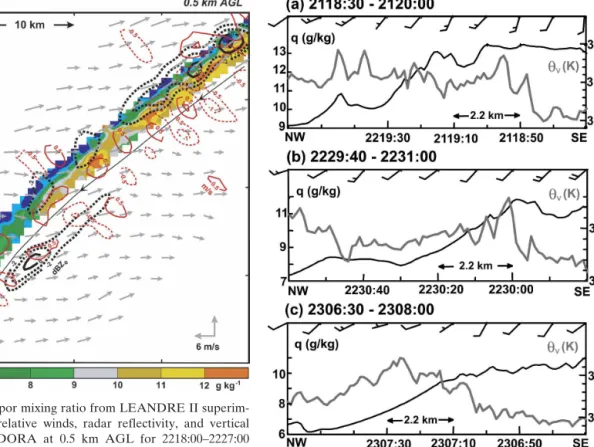
The cross-line variability of water vapor mixing ratio andvderived from NRL P-3 flight-level data is shown
in Fig. 8. The time series of water vapor mixing ratio andvfor three short legs perpendicular to the dryline
near the southwest corner of IHOP_2002 IOR are shown. The mixing ratio decreased by⬃4 g kg⫺1across the dryline zone of 4.4–6.6 km (the dryline zone width was determined by cross-line flight-level data). Al-though the moisture differential did not change much from 2118 to 2306, the boundary layer moisture de-creased by⬃3 g kg⫺1on both sides of the dryline dur-ing this same time period. The reason for this is because the south-southwesterly winds near the dryline were advecting dry air from the northern Texas panhandle to the Oklahoma panhandle, causing the general drying trend in the CBL over the IHOP_2002 IOR (see sur-face analysis in Figs. 1 and 13). The v differential
across the dryline is⬃0.5 K, but it is not necessarily collocated with the mixing ratio differential. The winds near the dryline were generally weak (2.5–7.5 m s⫺1) and had a larger westerly component northwest of the dryline, whereas southeast of the dryline winds were mostly from south-southwest.
The averaged vertical cross sections perpendicular to the dryline are shown in Figs. 9–11. These cross section were obtained by averaging over⬃8, 10, and 9 min data (which correspond to 52, 66, and 60 km in the along-line
FIG. 3. Isochrone analysis of the dryline position within the
IHOP_2002 IOR in the Oklahoma panhandle derived from S-Pol radar reflectivity for times (UTC) shown in the figure.
FIG. 4. S-Pol radar reflectivity at 0.6 km AGL and radar refractivity at surface. (a) Radar reflectivity at 2113:07– 2118:05 UTC, (b) radar refractivity at 2113:03–2113:35 UTC, (c) radar reflectivity at 2220:39–2225:35 UTC, (d) radar refractivity at 2220:36–2221:07 UTC, (e) radar reflectivity at 2317:43–2322:35 UTC, and (f) radar refractivity at 2317:40–2318:09 UTC. The NRL P-3 flight track along with flight-level winds (black line) are also superimposed on (a), (c), and (e). The dryline fine line (gray line) derived from (a), (c), and (e) are also plotted in (b), (d), and (f), respectively. The thick black lines in all panels represent the roll boundary. The short time period for radar refractivity measurements in (b), (d), and (f) is because refractivity measurements were only made at 0° elevation angle.
direction, respectively) for the 2108–2116, 2214–2228, and 2310–2321 analysis times, respectively. The aver-aged cross section increased the signal-to-noise ratio by removing random noise and preserving the mean struc-ture in the signal. Several feastruc-tures stand out in the av-eraged vertical cross sections of radar reflectivity, draft, and vertical vorticity. Generally the strongest up-draft is collocated or slightly northwest of the
reflectivity fine line. Also there are very weak down-drafts⬃3–5 km southeast of the dryline (the retreating dryline was moving from southeast to northwest, that is, from right to left in Figs. 9–11). The wavelike pattern of updraft/downdraft associated with the dryline has been documented before (Parsons et al. 1991; Ziegler and Hane 1993). Another observation that stands out is the dissipating reflectivity fine line and the decreasing dryline updrafts with time.
Previous studies have shown that drylines behave like density currents (Parsons et al. 1991; Ziegler and Hane 1993; Atkins et al. 1998). However, Crawford and Bluestein (1997) demonstrated that some drylines do not look like a density current by studying dryline pas-sage using surface mesonet data. Moreover, there are still uncertainties about whether there is a virtual po-tential temperature differential across the dryline. Early observations (NSSP Staff 1963) showed basically novdifferential across the dryline, while more recent
studies (Parsons et al. 1991; Ziegler and Hane 1993; Atkins et al. 1998) foundvdifferential of 1–2 K across
the dryline. The reconciliation of these contradicting observational results seems to come from what time during the dryline diurnal cycle the observations were made (Ziegler and Hane 1993). It is possible that when the dryline started to retreat back to the west during late afternoon hours, thevdifferential became more
pronounced and the dryline started to behave like a density current.
The 11 June 2002 dryline studied in this paper shows some interesting features that have not been noted in a retreating dryline before. The v differential derived
from NRL P-3 flight-level data (Figs. 5 and 8) is rela-tively weak (⬃0.5 K). The weak baroclinity may con-tribute to the relatively weak updrafts near the dryline. It can be inferred that the dry air on the left side of Figs. 9 and 10 is lifted over the dryline and then sinks 2–5 km downstream as previous studies have shown before. However, there is no indication of a rotation head or secondary circulation, which are common in a typical density current. Also, using the density current formula with an assumption of an internal Froude number of one, the dryline motion based on Learjet dropsonde data is found to be⬃5.2 m s⫺1, which is much larger than the dryline motion of 2.5 m s⫺1 estimated from S-Pol reflectivity at this time. Therefore, it seems that the current dryline case does not fit a density current very well.
The dryline seems to be weakening during the obser-vational period from 2100 to 2330. The radar reflectiv-ity, the updraft, and vertical vorticity all decreased sig-nificantly. The boundary layer is also drying out (see
FIG. 5. Time series of NRL P-3 flight-level data as it flew at ⬃600 m AGL along the dryline (see Figs. 4 and 6 for flight tracks). Water vapor mixing ratio (q), virtual potential temperature (v),
and equivalent potential temperature (e) are plotted. The S-Pol
radar refractivity (N) along the flight track is also plotted. (a) 2108–2116, (b) 2214–2228, and (c) 2310–2323 UTC.
FIG. 6. Dual-Doppler wind synthesis (ground relative) and radar reflectivity from ELDORA at 0.5 and 5.3 km AGL near the dryline; (a) 2108:03–2116:01 UTC at 0.5 km AGL, (b) 2108:03–2116:01 UTC at 5.3 km AGL, (c) 2214:02–2228:04 UTC at 0.5 km AGL, (d) 2214:02–2228:04 UTC at 5.3 km AGL, (e) 2310:03–2321:33 UTC at 0.5 km AGL, and (f) 2310:03–2321:33 UTC at 5.3 km AGL. Thin black contours represent radar reflectivity with dashed lines indicating negative reflectivity values. Contour interval is 1 dBZein (a), (c), and (e) and 5 dBZein (b),
(d), and (f). NRL P-3 flight tracks (black lines) along with time and flight-level winds are plotted in (a), (c), and (e). The dryline fine line positions derived from (a), (c), and (e) are plotted as thick black lines in (b), (d), and (f), respectively. N1 and N2 in (b) represent the positions of NCAR MGLASS soundings at 2137 and 2051 UTC, respectively. D5 and D6 in (b) indicate two Learjet dropsondes at 2146 and 2149 UTC, while D5⬘, D6⬘, and D7⬘ in (f) represent three dropsondes at 2331, 2334, and 2337 UTC, respectively. A–A⬘, B–B⬘, and C–C⬘ are the positions of individual vertical cross sections shown in Figs. 12a–c. The black box in Fig. 6c represents the domain used in Fig. 7.
Figs. 1 and 13) and clouds are dissipating inside the IHOP_2002 IOR.
c. The cloud fields near the dryline
The dryline was accompanied by middle-level clouds at 2108–2116 (Fig. 6b). Satellite imagery loops indicate that these middle-level clouds were advected into the IHOP_2002 IOR and they tended to dissipate after they entered the Oklahoma panhandle region. Clouds can be seen on both sides of the dryline and sometimes right over the dryline as shown in Fig. 6. Some of them have radar reflectivity values as large as 18 dBZe.
Ver-tical cross sections of both dryline and clouds are shown in Fig. 12. The clouds are middle level based and the maximum reflectivity of these clouds is located around 5.5 km AGL. All clouds are found to be within 15 km of the dryline. The dryline itself is shown as a reflectiv-ity maximum in all three analyses times and found to be associated with updrafts of 2–3 m s⫺1 (The cross sec-tions in Fig. 12 are not necessarily cutting through the updraft maximum; therefore their updraft values are lower). By 2310–2321 the clouds almost disappeared
except for a few low-reflectivity clouds just above the dryline. The reason for cloud dissipation will be dis-cussed in section 7. It should be emphasized that the middle-level clouds in Figs. 6 and 12 were not con-nected to the dryline at all and they failed to develop into storms as they moved near the dryline, although previous studies have shown that sometimes middle-level clouds did develop into storms when they ap-proached drylines (Hane et at. 1997).
The dryline, roll boundary, and Learjet dropsonde positions superimposed on satellite imagery with sur-face analysis are shown in Fig. 13. The individual clouds in Figs. 12a–c are indicated in Figs. 13a–c as small circles. The dryline and roll boundary positions are ob-tained from S-Pol radar reflectivity. It is apparent that some clouds do not show up in radar observations even though they can be clearly identified on the satellite image. One example of this mismatch is the cloud line right above the surface dryline at 2112 in Fig. 13a. Those clouds were found to be connected to the bound-ary layer and probably were initiated by the dryline
FIG. 7. Water vapor mixing ratio from LEANDRE II superim-posed on dryline-relative winds, radar reflectivity, and vertical velocity from ELDORA at 0.5 km AGL for 2218:00–2227:00 UTC. Solid (dashed) red line represents updraft (downdraft) with contour interval of 0.5 m s⫺1; thick solid (dashed) black line rep-resents positive (negative) radar reflectivity values with contour interval of 1 dBZe. The NRL P-3 flight track is drawn as the thin
black line.
FIG. 8. Time series of NRL P-3 flight-level data as it flew at ⬃600 m AGL across the dryline (see Fig. 6 for the flight tracks). Water vapor mixing ratio (q), virtual potential temperature (v),
and winds are plotted. (a) 2118:30–2120:00, (b) 2229:40–2231:00, and (c) 2306:30–2308:00 UTC.
Fig 7 live 4/C
(Fabry 2006). Interestingly those clouds did not evolve into storms and they were not detected by ELDORA. The cloud line seen by ELDORA in Fig. 6b was ⬃13 km southeast of the surface dryline in the moist air
mass and was middle level based. On the other hand, darker clouds, which might be difficult to identify in visible satellite imagery, are sometimes actually associ-ated with much large radar reflectivity, such as the clouds at the west edge of analysis domain in Fig. 13b. By 2319 the clouds inside the IHOP_2002 IOR are al-most all dissipated. Surface observations also show this general drying trend on both sides of the dryline. One interesting thing is that the roll boundary, which per-haps was associated with the best combination of con-vergence and moisture based on its much stronger re-flectivity observed by S-Pol (Fig. 4) and larger surface moisture content shown in the surface analysis (Fig. 13), did initiate a storm (storm C in Figs. 1d, 13b, and 13c) at 2207. The first echo was identified at 4.7 km AGL in S-Pol reflectivity with a value of 23 dBZe. The
echo grew both horizontally and vertically (upward and downward) and reached a maximum reflectivity value of 60 dBZeby 2300. After the initiation, storm C moved
northeast away from the roll boundary and the storm dissipated around 0015 on 12 June 2002.
6. Learjet dropsonde data analysis
One advantage of IHOP_2002 compared to other field campaigns studying drylines is its deployment of dropsonde aircraft. Many previous dryline studies re-lied heavily on aircraft in situ measurements using the stepped-traverse flying pattern and the data usually
FIG. 9. Mean vertical cross section of the dryline for 2108:03– 2116:01 UTC. Dual-Doppler winds (dryline relative) superim-posed onto (a) radar reflectivity, (b) vertical velocity, and (c) vertical vorticity.
FIG. 10. Same as Fig. 9 except for 2214:02–2228:04 UTC.
FIG. 11. Same as Fig. 9 except for 2310:03–2321:33 UTC.
have poor time and/or vertical resolution. The advan-tage of dropsonde aircraft is its ability to release sound-ings in rapid succession, and therefore the dropsonde data can cover a larger area in a relatively short time period with high spatial resolution. On 11 June 2002 a Learjet released two lines of dropsondes perpendicular to the dryline at 2134–2159 and 2322–2345 when ELDORA was collecting dual-Doppler data on the dryline. The position of each drop is plotted in Fig. 13 with respect to the dryline and roll boundary positions. The horizontal drift of the dropsondes was not
cor-rected during IHOP_2002 and it should not cause any concern if the winds aloft were not so strong. Each drop is roughly separated by 20–25 km and each cross section contains nine drops that cover a distance of⬃200 km in
→ FIG. 13. Surface analyses superimposed on visible satellite im-ages at (a) 2112, (b) 2221, and (c) 2319 UTC. Temperature and dewpoint temperature are shown (°C). Wind vectors are plotted with the full barb and half barb representing 5 and 2.5 m s⫺1, respectively. The box represents the dual-Doppler domain in Fig. 6. Thin black line represents the dryline; thick black line repre-sents the roll boundary. Dropsonde positions are plotted as aster-isks, and the black dot indicates the S-Pol radar position. D1–D9 in Figs. 13a and 13b represent the 2134–2159 UTC drop series, and D1⬘–D9⬘ in Fig. 13c represent the 2322–2345 UTC drop se-ries. The clouds shown in Fig. 12 are represented by small open circles.
FIG. 12. Individual vertical cross section of dual-Doppler winds (dryline relative) and radar reflectivity from ELDORA at (a) 2108:03–2116:01, (b) 2214:02–2228:04, and (c) 2310:03–2321:33 UTC analysis times. The positions of the cross sections in (a), (b), and (c) are shown in Figs. 6b, 6d, and 6f, respectively.
the cross-line direction. Basically the dropsonde data will provide information about the mesoscale environ-ment, not the detailed structure of the dryline.
The water vapor mixing ratio shown in Fig. 14 indi-cates that the CBL is well mixed and the boundary layer top is higher within the dry air mass. The dry layer between 700 and 500 mb is apparent on both sides of the dryline. One interesting feature in Fig. 14 is that the moist plume corresponding to the height of the 9 g kg⫺1 mixing ratio contour reached ⬃3.2 km MSL approxi-mately 60 km northwest of the dryline, but it only reached⬃2.2 km MSL southeast of the dryline. It also should be pointed out that the boundary layer is rela-tively dry even on the moist side of the dryline for this particular case (relative humidity only reaches ⬃40% near the surface at the dryline).
The instability parameters calculated from each dropsonde using NCAR System for User-editing and Display of Soundings (SUDS) software are shown in Fig. 15 for 2134–2159. The lowest 50-mb mean mea-surements were used for the calculations of all the lifted parcel parameters. The convective available potential energy (CAPE) values derived from both the drop-sonde data and NCAR MGLASS soundings were only integrated up to ⬃450 mb, which causes the CAPE values to appear to be incorrectly small and can be misleading. Therefore, attentions should only be paid to the variations, not the absolute values of the CAPE derived from dropsonde data. Caution should also be
exercised in interpreting the instability parameters cal-culated from the dropsondes since there is no way to know where those drops landed with respect to the boundary layer updrafts/downdrafts. As Fig. 15 shows, the CAPE reached a local maximum near the station-ary front at first, then decreased to a minimum⬃20 km northwest of the dryline, and increased dramatically across the dryline and continued rising southeast of it. Convective inhibition (CIN), however, reached its minimum near the stationary front and its maximum ⬃20 km northwest of the dryline. Generally the CIN values are between⫺30 and ⫺100 J kg⫺1, values that are too large for CI. Similar to CAPE, lifted index (LI) indicated very unstable air near the roll boundary. Both LCL and LFC reached their maximum⬃20 km north-west of the dryline and then decreased gradually south-eastward. Notice it is the roll boundary, not the dryline, which is associated with larger CAPE, smaller LI, and lower CIN values. The stationary front is also a favor-able place for CI since it is associated with the lowest CIN values.
The Learjet made the second line of drops at almost the same location as the first one about 2 h later. Fig-ures 16 and 17 are the vertical cross sections obtained from the dropsonde data for 2322–2345. Two significant changes occurred between the two dropsonde vertical cross sections. One is the disappearance of the moist plume⬃60 km northwest of the dryline, and another is the increase in CBL depth southeast of the dryline. This is apparent through the 9 g kg⫺1mixing ratio contour line, which used to be at the height of⬃2.2 km MSL and now reaches 3 km MSL southeast of the dryline.
FIG. 14. Vertical cross section perpendicular to the dryline based on the dropsonde data between 2134:29 and 2159:37 UTC for water vapor mixing ratio (q in g kg⫺1) and virtual potential temperature (v in K). The position of the stationary front,
dryline, and the roll boundary are indicated at the bottom of the figure. Wind vectors are plotted with the half barb, full barb, and flag representing 2.5, 5.0, and 25 m s⫺1, respectively. D1–D9 rep-resents each individual dropsonde, and their positions are plotted in Fig. 13a.
FIG. 15. Same as Fig. 14 except for relative humidity and insta-bility parameters including CAPE, CIN, LI, LCL, and LFC; LI is labeled beside each dropsonde symbol (D1–D9) at the top of the figure.
Again the similar pattern of instability parameters found in the previous cross section (Fig. 15) is recon-firmed here in Fig. 17. The stationary front was associ-ated with marginally favorable instability parameters compared with that of its immediate environment. The dry air⬃10 km northwest of the dryline had the highest LCL, LFC, and CIN and the lowest CAPE. Again, the roll boundary was associated with the most favorable instability parameters. The large decrease in CAPE and increase in CIN for the last drop is because this par-ticular dropsonde was located at a position where storm C just passed.
The virtual potential temperature in both Figs. 14
and 16 suggests there is a v differential of ⬃0.5 K
across the dryline, consistent with flight-level data in Fig. 8. Since the most favorable instability parameters as well as stronger surface convergence as indicated by the stronger radar reflectivity fine line was not associ-ated with the dryline itself but with a roll boundary 40–50 km east-southeast of the dryline within the moist air, it is not surprising that convection did not start along the dryline, but instead, along the roll boundary. Only one storm was initiated along the roll boundary (storm C in Figs. 13b and 13c), which reached a maxi-mum reflectivity of 60 dBZe. Various factors that may
contribute to “convection initiation failure” near the 11 June 2002 Oklahoma panhandle dryline will be dis-cussed in section 7.
7. Environmental conditions detrimental to convection initiation
The major reason that the dryline is often a favorable place for initiating storms is because it creates the nec-essary lift and is very close to the moist air that fuels the storm. However, observations frequently suggest that even though the lift from the dryline seems to be ad-equate and clouds are forming along the dryline, these clouds may fail to develop into storms (Atkins et al. 1998; Weiss and Bluestein 2002). Several hypotheses have been proposed by various researchers in the past to explain the lack of convection initiation along some drylines, and this section will examine them in the con-text of the 11 June IHOP_2002 dryline.
Some typical soundings on both sides of the dryline from NCAR MGLASS and the Learjet are shown in Figs. 18 and 19, respectively. The positions of these soundings relative to the dryline are shown in Figs. 6b and 6f. A pronounced cap inversion is apparent in Fig. 18 and a substantial dry layer can be seen above the well-mixed CBL from 700 to 500 mb on both sides of the dryline. This same feature is also apparent in the Learjet dropsondes as shown in Fig. 19. Weiss and Bluestein (2002) suggested that a dry layer between the LCL and LFC might be the reason why convection did not initiate along a dryline they studied. The dry layer between the LCL and LFC is detrimental to CI because updrafts originating within the CBL tend to evaporate inside this very dry layer and the evaporative cooling will make the updrafts lose their buoyancy.
Storm initiation, organization, and lifetime may be affected by the relative movement of convective clouds and convergence lines (Wilson and Megenhardt 1997). If the clouds do not propagate at approximately the same speed as the boundary, convection may be ad-versely affected. The cloud lines were moving almost
FIG. 16. Same as Fig 14 except for dropsonde data between 2322:37 and 2345:07 UTC. D1⬘–D9⬘ represent each individual dropsonde, and their positions are plotted in Fig. 13c.
FIG. 17. Same as Fig. 14 except for relative humidity and insta-bility parameters including CAPE, CIN, LI, LCL, and LFC; LI is labeled beside each dropsonde symbol (D1⬘–D9⬘) at the top of the figure.
parallel to the dryline as shown by the satellite imagery movie loops in this case (not shown). Since the dryline was retreating to the northwest at a rather slow speed of 1.5–2.5 m s⫺1, the distance between the dryline and cloud line did not change significantly over the lifetime of the cloud line; therefore, the relative movement of clouds and dryline is not likely the reason why convec-tion initiaconvec-tion did not occur in this case.
Although the temperature inversion around 700 mb was weakening in time, the moisture content at all heights also decreased during the 2100–2330 time pe-riod. The drying trend of the whole boundary layer is another factor unfavorable for CI.
By analyzing a dryline case from VORTEX, Richter and Bosart (2002) proposed that an upper-level ridge that was over the dryline region created middle-level subsidence and warming and a strong cap inversion. As a result of the strong inversion, deep convection did not start even though the dryline was initiating clouds. The NCEP–NCAR reanalysis of 500-mb geopotential height and vertical pressure velocity () covering the IHOP_2002 domain is shown in Fig. 20. Apparently the Oklahoma panhandle where the IHOP_2002 IOR was located was under the influence of middle-level subsi-dence. The middle-level warming of⬃0.4°C on the dry side and⬃1.2°C on the moist side of the dryline over a time period of⬃2 h can be estimated from soundings shown in Fig. 19. The middle-level subsidence could possibly explain why the middle-level clouds advected into this region from southwest disappeared shortly
af-ter they enaf-tered the Oklahoma panhandle. Notice that storm A in Fig. 1 was initiated in a region with middle-level upward motion. Although middle-middle-level subsi-dence that promotes middle-level drying and warming and creates strong cap inversion is unfavorable to CI, it does not mean convection will not develop under re-gions of middle-level subsidence. As long as the meso-scale or convective-meso-scale lift is strong enough and there is sufficient moisture, parcels will reach their LFC. Storm C in Figs. 1d, 13b, and 13c seems to be a good example of a storm initiated under a middle-level sub-sidence region. On the other hand, storm C was rela-tively small and short-lived compared to storm A, per-haps as a result of its being developed under the unfa-vorable middle-level conditions.
One major objective of IHOP_2002 was to identify how the special dataset collected by field campaigns can be helpful for operational CI forecasting. It appears that high-resolution four-dimensional kinematic and
FIG. 18. NCAR MGLASS soundings launched near the dryline at 2051 and 2137 UTC on 11 Jun 2002. The solid and dashed lines represent temperature and dewpoint temperature, respectively. Black (gray) lines indicate the sounding at 2051 (2137) UTC. The positions of these two soundings are plotted in Fig. 6b. The heights of the LCL and LFC for the 2051 UTC sounding are indicated in the figure. Both CAPE and CIN values are in J kg⫺1. Vertical profile of the horizontal winds is shown with the half barb, full barb, and flag representing 2.5, 5.0, and 25.0 m s⫺1, respectively.
FIG. 19. Learjet dropsondes near the dryline at (a) 2146 (gray) and 2149 UTC (black) and (b) 2334 (gray) and 2337 UTC (black). Solid and dashed lines represent temperature and dewpoint tem-perature, respectively. The positions of these four soundings are indicated in Figs. 6b and 6f. Vertical profile of the horizontal winds is shown with the half barb, full barb, and flag representing 2.5, 5.0, and 25.0 m s⫺1, respectively.
thermodynamic structures of boundaries are essential for CI forecasting and it seems that the information needed for accurate CI prediction is still not there even during IHOP_2002. One big gap that has become more apparent through this analysis is the wind fields associ-ated with boundaries whose measurements solely rely on clear-air returns detected by radars. The problem with the clear-air echo is that it tends to disappear above 2–3 km AGL, which causes lack of wind mea-surements near or above the boundary layer top. As a result of this limited height coverage of the three-dimensional wind field, it is almost impossible to know whether or not the boundary layer updrafts reached their LFC. Another deficiency from the observational perspective for CI forecasting is the four-dimensional water vapor measurements. Although IHOP_2002 was dedicated to filling the gaps in this aspect, detailed four-dimensional water vapor fields are still not available.
What has been achieved in IHOP_2002 are some hori-zontal and vertical cross sections of the water vapor field. Therefore, the lack of high-resolution three-dimensional kinematic and thermodynamic informa-tion about updrafts associated with a boundary still pre-sents a great challenge for accurately predicting which pocket(s) of those updrafts will develop into a storm.
8. Summary and discussions
On 11 June 2002 during IHOP_2002 a dryline formed over the Oklahoma panhandle as a result of higheair
pushing northwestward toward a stationary front in the warm sector. Convection was expected over the Okla-homa panhandle based on various model runs early in the morning, and an IHOP_2002 IOR was set up near NCAR’s S-Pol radar in the Oklahoma panhandle area. The evolution of the dryline’s kinematic and thermo-dynamic structure is documented in this paper by using ELDORA dual-Doppler analysis, S-Pol radar refractiv-ity, LEANDRE II water vapor measurements, Learjet dropsondes, MGLASS soundings, as well as NRL P-3 flight-level data. The dryline was retreating toward the northwest during the intensive observation period from 2100 to 2330 at a speed of 1.5–2.5 m s⫺1and was asso-ciated with a moisture differential of 4–5 g kg⫺1across a distance of ⬃4.4–6.6 km. The virtual potential tem-perature differential across the dryline was relatively weak (⬃0.5 K) and pockets of updraft on the order of 2–3 m s⫺1were found near the dryline. Boundary-layer-based clouds were observed along the dryline inside the IHOP_2002 IOR but no deep convection was initiated there. S-Pol radar refractivity shows the greatest mois-ture gradient slightly northwest of or collocated with the dryline fine line, and a general trend of drying was evident from radar refractivity as well as surface analy-sis from 2100 to 2330. LEANDRE II water vapor mea-surements reveal strong along-line variability in the moisture field near the dryline and suggest that the reflectivity maxima tend to be closely associated with pockets of rising moist air with only a few exceptions. A roll boundary, which has more intense radar reflectivity and a north–south orientation inside the IHOP_2002 IOR from 2100 to 2230, intercepted the dryline near the northeast corner of IHOP_2002 IOR. Interestingly, the interception point that should be a favorable place for CI did not initiate any storm, nor did the dryline itself. Three storms developed in the region on this particular day, and all of them were outside the IHOP_2002 IOR. Storm A, a tornadic one, was initiated near Russell, Kansas (⬃200 km northeast of IHOP_2002 IOR), at ⬃2100. Another very small storm (storm B) was initi-ated around 2207 along the stationary front⬃100 km
FIG. 20. NCEP–NCAR reanalysis of the 500-mb height and vertical pressure velocity () at (a) 1800 UTC on 11 Jun 2002 and (b) 0000 UTC on 12 Jun 2002. Thick black lines represent geo-potential heights with a contour interval of 30 m; thin black lines represent vertical pressure velocityin 10⫺3hPa s⫺1with a con-tour interval of 0.5⫻ 10⫺3hPa s⫺1. Upward motion with⬍ ⫺0.5 ⫻ 10⫺3hPa s⫺1is shaded gray.
north of the IHOP_2002 IOR. The third storm (storm C) was initiated along the roll boundary around 2210 about 80 km south of the IHOP_2002 IOR.
Middle-level clouds near the dryline were observed by ELDORA along with the dryline itself. These clouds dissipated after they entered the Oklahoma panhandle. The reason for their disappearance is speculated to be the middle-level subsidence shown in the NCEP– NCAR reanalysis. The dryline was weakening as seen by ELDORA radar reflectivity, and the boundary layer was drying out according to the S-Pol radar refractivity and soundings. The Learjet dropsonde data show that the most favorable instability parameters were actually associated with the roll boundary, not the dryline. This may explain why storm C was initiated near the roll boundary at⬃2210. The reasons why the dryline was not able to initiate any storms inside IHOP_2002 IOR were summarized as follows: 1) relatively weak up-drafts perhaps as a result of weak baroclinity across the dryline; 2) a substantial dry layer between the LCL and LFC; and 3) strong cap inversion as a result of middle-level subsidence over the dryline in the Oklahoma pan-handle region.
As an “interesting albeit frustrating” null case de-scribed by IHOP_2002 nowcasters (E. Szoke, IHOP_2002 field catalog), this dryline provides a unique dataset for examining the differences between what the models predicted and what actually occurred. The reasons why the models overpredicted the convection over the Oklahoma panhandle for this particular case remains to be an interesting research topic for numerical modelers, and the detailed observational study of this case pre-sented by this paper should be very helpful to any nu-merical simulation of this case. It is also important to note that both the dryline and the roll boundary pre-sented in this study would not be resolved by the con-ventional observational network if the special datasets from IHOP_2002 were not available. Therefore, if boundaries like this have any impact on CI, accurately forecasting CI would remain to be a great challenge for operational models.
Acknowledgments. The first author is grateful to NCAR’s Advanced Study Program and Atmospheric Technology Division for providing necessary support for this research. The comments from two anonymous reviewers greatly improved this manuscript. Thanks are also extended to Drs. Roger Wakimoto and Jim Wilson for their constant encouragements. Dr. Junhong Wang at NCAR provided the dropsonde data. Drs. Roger Wakimoto and Stanley Trier are specially thanked for their insightful reviews of an earlier version of this manuscript.
REFERENCES
Anthes, R. A., Y. H. Kuo, S. G. Benjamin, and Y. F. Li, 1982: The evolution of the mesoscale environment of severe local storms: Preliminary modeling results. Mon. Wea. Rev., 110, 1185–1213.
Atkins, N. T., R. M. Wakimoto, and C. L. Ziegler, 1998: Obser-vations of the finescale structure of a dryline during VORTEX 95. Mon. Wea. Rev., 126, 525–550.
Barnes, S. L., 1973: Mesoscale objective map analysis using weighted time-series observations. NOAA Tech. Memo. ERL NSSL-62, 60 pp.
Bluestein, H. B., 1993: CLASS for class. Bull. Amer. Meteor. Soc., 74, 1697–1702.
——, and C. R. Parks, 1983: A synoptic and photographic clima-tology of low-precipitation severe thunderstorms in the southern plains. Mon. Wea. Rev., 111, 2034–2046.
——, and S. S. Parker, 1993: Modes of isolated, severe convective storm formation along the dryline. Mon. Wea. Rev., 121, 1352–1374.
Bruneau, D., P. Quaglia, C. Flamant, M. Meissonnier, and J. Pelon, 2001: Airborne lidar LEANDRE II for water-vapor profiling in the troposphere. Appl. Opt., 40, 3450–3475. Carbone, R. E., M. J. Carpenter, and C. D. Burghart, 1985:
Dopp-ler radar sampling limitations in convective storms. J. Atmos.
Oceanic Technol., 2, 357–361.
Crawford, T. M., and H. B. Bluestein, 1997: Characteristics of dryline passage during COPS-91. Mon. Wea. Rev., 125, 463– 477.
Cressman, G. P., 1959: An operational objective analysis scheme.
Mon. Wea. Rev., 87, 367–384.
Dowell, D. C., and H. B. Bluestein, 2002a: The 8 June 1995 McLean, Texas, storm. Part I: Observations of cyclic torna-dogenesis. Mon. Wea. Rev., 130, 2626–2648.
——, and ——, 2002b: The 8 June 1995 McLean, Texas, storm. Part II: Cyclic tornado formation, maintenance, and dissipa-tion. Mon. Wea. Rev., 130, 2649–2670.
Fabry, F., 2006: The spatial variability of moisture in the boundary layer and its effect of convection initiation: Project-long char-acterization. Mon. Wea. Rev., 134, 79–91.
——, C. Frush, I. Zawadzki, and A. Kilambi, 1997: On the extrac-tion of the near-surface index of refracextrac-tion using radar phase measurements from ground targets. J. Atmos. Oceanic
Tech-nol., 14, 978–987.
Grasso, L. D., 2000: A numerical simulation of dryline sensitivity to soil moisture. Mon. Wea. Rev., 128, 2816–2834.
Hane, C. E., C. L. Ziegler, and H. B. Bluestein, 1993: Investiga-tion of the dryline and convective storms initiated along the dryline: Field experiments during COPS-91. Bull. Amer.
Me-teor. Soc., 74, 2133–2145.
——, B. B. Bluestein, T. M. Crawford, M. E. Baldwin, and R. M. Rabin, 1997: Severe thunderstorm development in relation to along-dryline variability: A case study. Mon. Wea. Rev., 125, 231–251.
——, M. E. Baldwin, H. B. Bluestein, T. M. Crawford, and R. M. Rabin, 2001: A case study of severe storm development along a dryline within a synoptically active environment. Part I: Dryline motion and an Eta model forecast. Mon. Wea. Rev., 129, 2183–2204.
——, R. M. Rabin, T. M. Crawford, H. B. Bluestein, and M. E. Baldwin, 2002: A case study of severe storm development along a dryline within a synoptically active environment. Part II: Multiple boundaries and convective initiation. Mon. Wea.
Rev., 130, 900–920.
Hildebrand, P. H., C. A. Walther, C. L. Frush, J. Testud, and F. Baudin, 1994: The ELDORA/ASTRAIA airborne Doppler weather radar: Goals, design, and first field tests. Proc. IEEE, 82, 1873–1890.
——, and Coauthors, 1996: The ELDORA/ASTRAIA airborne Doppler weather radar: High resolution observations from TOGA COARE. Bull. Amer. Meteor. Soc., 77, 213–232. Hock, T. F., and J. L. Franklin, 1999: The NCAR GPS
dropwind-sonde. Bull. Amer. Meteor. Soc., 80, 407–420.
Kalnay, E., and Coauthors, 1996: The NCEP/NCAR 40-Year Re-analysis Project. Bull. Amer. Meteor. Soc., 77, 437–471. Kistler, R., and Coauthors, 2001: The NCEP–NCAR 50-year
re-analysis: Monthly means CD-ROM and documentation. Bull.
Amer. Meteor. Soc., 82, 247–268.
Koch, S. E., and J. McCarthy, 1982: The evolution of an Oklaho-ma dryline: Part II: Boundary-layer forcing of mesoconvec-tive systems. J. Atmos. Sci., 39, 237–257.
Lee, W.-C., P. Dodge, F. D. Marks, and P. H. Hildebrand, 1994: Mapping of airborne Doppler radar data. J. Atmos. Oceanic
Technol., 11, 572–578.
Leise, J. A., 1982: A multidimensional scale-telescoped filter and data extension package. NOAA Tech. Memo. ERL-82, 11 pp. [Available from NOAA ERL, 325 Broadway, Boulder, CO 80303.]
Lutz, J., P. Johnson, B. Lewis, E. Loew, M. Randall, and J. VanAndel, 1995: NCAR’s Pol: Portable polarimetric S-band radar. Preprints, Ninth Symp. on Meteorological
Obser-vations and Instrumentation, Charlotte, NC, Amer. Meteor.
Soc., 408–410.
Miller, J. A., T. A. Kovacs, and P. R. Bannon, 2001: A shallow water model of the diurnal dryline. J. Atmos. Sci., 58, 3508– 3524.
Mohr, C. G., L. J. Miller, R. L. Vaughn, and H. W. Frank, 1986: The merger of mesoscale datasets into a common Cartesian format for efficient and systematic analysis. J. Atmos.
Oce-anic Technol., 3, 146–161.
Murphey, H. V., R. M. Wakimoto, C. Flamant, and D. E. Kingsmill, 2006: Dryline on 19 June 2002 during IHOP. Part I: Airborne Doppler and LEANDRE II analysis of the thin line structure and convection initiation. Mon. Wea. Rev., 134, 406–430.
NSSP Staff, 1963: Environmental and thunderstorm structures as shown by National Severe Storms Project observations in spring 1960 and 1961. Mon. Wea. Rev., 91, 271–292. Oye, R., C. Mueller, and S. Smith, 1995: Software for radar
trans-lation, visualization, editing, and interpolation. Preprints,
27th Conf. on Radar Meteorology, Vail, CO, Amer. Meteor.
Soc., 359–361.
Parsons, D. B., M. A. Shapiro, R. M. Hardesty, R. J. Zamora, and J. M. Intrieri, 1991: The finescale structure of a west Texas dryline. Mon. Wea. Rev., 119, 1242–1258.
——, ——, and E. Miller, 2000: The mesoscale structure of a nocturnal dryline and of a frontal-dryline merger. Mon. Wea.
Rev., 128, 3824–3838.
Peckham, S. E., and L. J. Wicker, 2000: The influence of topog-raphy and lower tropospheric winds on dryline morphology.
Mon. Wea. Rev., 128, 2165–2189.
Rhea, J. O., 1966: A study of thunderstorm formation along drylines. J. Appl. Meteor., 5, 58–63.
Richter, H., and L. F. Bosart, 2002: The suppression of deep moist convection near the southern Great Plains dryline. Mon.
Wea. Rev., 130, 1665–1691.
Schaefer, J. T., 1974: The lifecycle of the dryline. J. Appl. Meteor., 13, 444–449.
——, 1986: The dryline. Mesoscale Meteorology and Forecasting, P. S. Ray, Ed., Amer. Meteor. Soc., 549–572.
Shaw, B. L., R. A. Pielke, and C. L. Ziegler, 1997: A three-dimensional numerical simulation of a Great Plains dryline.
Mon. Wea. Rev., 125, 1489–1506.
Testud, J., P. H. Hildebrand, and W.-C. Lee, 1995: A procedure to correct airborne Doppler radar data for navigation errors using the echo returned from the earth’s surface. J. Atmos.
Oceanic Technol., 12, 800–820.
Trier, S. B., F. Chen, and K. W. Manning, 2004: A study of con-vection initiation in a mesoscale model using high-resolution land surface initial conditions. Mon. Wea. Rev., 132, 2954– 2976.
Sun, W.-Y., and C.-C. Wu, 1992: Formation and diurnal variation of the dryline. J. Atmos. Sci., 49, 1606–1619.
Wakimoto, R. M., and H. Cai, 2000: Analysis of a nontornadic storm during VORTEX 95. Mon. Wea. Rev., 128, 565–592. ——, and ——, 2002: Airborne observations of a front near a col
during FASTEX. Mon. Wea. Rev., 130, 1898–1912. ——, C. Liu, and H. Cai, 1998: The Garden City, Kansas, storm
during VORTEX 95: Part I: Overview of the storm’s life cycle and mesocyclogenesis. Mon. Wea. Rev., 126, 372–392. ——, W.-C. Lee, H. B. Bluestein, C.-H. Liu, and P. H.
Hilde-brand, 1996: ELDORA observations during VORTEX 95.
Bull. Amer. Meteor. Soc., 77, 1465–1481.
Weckwerth, T. M., and Coauthors, 2004: An overview of the In-ternational H2O Project (IHOP_2002) and some preliminary
highlights. Bull. Amer. Meteor. Soc., 85, 253–277.
——, R. P. Crystalyne, F. Fabry, S. Park, and J. W. Wilson, 2005: Radar refractivity retrieval: Validation and application to short-term forecasting. J. Appl. Meteor., 44, 285–300. Weiss, C. C., and H. B. Bluestein, 2002: Airborne pseudo-dual
Doppler analysis of a dryline-outflow boundary intersection.
Mon. Wea. Rev., 130, 1207–1226.
Wilson, J. W., and D. L. Megenhardt, 1997: Thunderstorm initia-tion, organizainitia-tion, and lifetime associated with Florida boundary layer convergence lines. Mon. Wea. Rev., 125, 1507–1525.
——, T. M. Weckwerth, J. Vivekanandan, R. M. Wakimoto, and R. W. Russell, 1994: Boundary layer clear-air radar echoes: Origin of echoes and accuracy of derived winds. J. Atmos.
Oceanic Technol., 11, 1184–1206.
Ziegler, C. L., and C. E. Hane, 1993: An observational study of the dryline. Mon. Wea. Rev., 121, 1134–1151.
——, and E. N. Rasmussen, 1998: The initiation of moist convec-tion at the dryline: Forecasting issues from a case study per-spective. Wea. Forecasting, 13, 1106–1131.
——, W. J. Martin, R. A. Pielke, and R. L. Walko, 1995: A mod-eling study of the dryline. J. Atmos. Sci., 52, 273–285.