Development of a Biofeedback System for
Optimizing Cycling Performance Assessment
During Wind Tunnel Testing
byLudovic Talon
Submitted to the Department of Aeronautics and Astronautics in partial fulfillment of the requirements for the degree of Master of Science in Aeronautics and Astronautics
at the
MASSACHUSETTS INSTITUTE OF TECHNOLOGY
July 2002
@ 2002 Massachusetts Institute of Technology.
All rights reserved.
A u th or... . .. ... ...
Department of Aeronautics and Astronautics July 15, 2002
Certified by...
A
... . . ... ...
Kim B. Blair Director, Center for Sports Innovation Thesis Supervisor
/~ A A,
I
C ertified by... ... ... .. .. .. .. ... ....
SJohn-Paul
B. ClarkeAssociate Professor of Aeronautics and Astronautics
Accepted by...
MASSACHUSETTS INSTITUTE OF TECHNOLOGY
...
Edward M.Greitzer Professor of Aeronautics and Astronautics Chair, Committee on Graduate Students
Development of a Biofeedback System for
Optimizing Cycling Performance Assessment
during Wind Tunnel Testing
by
Ludovic Talon
Submitted to the Department of Aeronautics and Astronautics on August 10,
2002, in partial fulfillment of the requirements for the degree of Master of
Science in Aeronautics and Astronautics.
Abstract
Up to 90% of the power generated by a cyclist is used to overcome aerodynamic
drag. While technical breakthroughs and improvements have resulted in bike frames wheel and component designs optimized for aerodynamic performance, the rules of the Union Cycliste Internationale (UCI) on these bicycle shapes restrict future optimization, and have actually disallowed many extremely aerodynamic bikes and components. Additionally, bike geometry restrictions also restrict some of the gross parameters of the rider's position on the racing bike. However, cycling events are often decided on the order of seconds. Thus, optimizing the performance of the bike/rider system is of utmost importance, especially with increased equipment restrictions.
One key to increasing cycling performance is to determine the optimum between a good aerodynamic position and a position conducive to a high power output. Previous wind tunnel testing used only drag data to improve the cyclist's position. This thesis describes a novel system for optimizing cycling performance by integrating cyclist power output with wind tunnel aerodynamic data. This data is used to calculate the optimization parameter of a virtual velocity to predict cycling performance.
Additionally, wind tunnel testing has is usually "no-feedback" testing. The cyclist is enclosed in the wind tunnel and cannot get any information about his performance during the test. The system presented in this work includes a near real-time feedback to the rider in the wind tunnel through the use of a helmet mounted display. As the cyclist is under near maximal effort during these tests, human factors issues were considered in the design of the data displays.
Thesis Supervisor: Kim B. Blair
Nomenclature
This nomenclature will be used in the expression of the cyclist's power output:
VG Ground Velocity (in mph) V,: Virtual Velocity (in mph)
Pcycus,: Cyclist's Power Output (in W)
PBackWheel : Rear Wheel Power Output (in W) FDA: Total Force of Aerodynamic Drag (in N)
CR: Coefficient of Rolling Resistance (due to tire and type of surface on the road)
mrOT : Total Mass of Cyclist and Bike (in lbs)
g: Constant of Gravity (9.81 m/s2)
Cw,: Coefficient of Frictional Losses in Wheel Bearings Ec: Drive Chain Efficiency Factor
1. Introduction
At speeds over 25 mph, aerodynamic drag contributes as much as 90% of the total resistive force on a cyclist [1], [2]. Since the margin of victory in time-trial events is on the order of seconds, riders and coaches often conduct wind tunnel tests to determine the rider position that minimizes the aerodynamic drag of a cyclist. The position that minimizes aerodynamic drag may however substantially limit the athlete's ability to power the bicycle. Thus, this loss in power may in fact offset some of the gains made by decreasing the drag.
A key objective in race cycling then is to determine the rider position that
optimizes the trade-off between aerodynamic drag and rider power output [3], [4]. The rider position that optimizes both drag and power output will by definition achieve the highest racing velocity. Since in a wind tunnel test, the actual racing velocity cannot be measured directly, a virtual velocity must be determined through a calculation of the virtual velocity. This virtual velocity is determined by measuring the power output and the aerodynamic drag of a cyclist, and using a mathematical model for road cycling power [5]. Once a baseline virtual velocity is established, changes in rider positioning or cycling equipment used can be compared against this baseline. This method allows for optimization of the bike-rider system against the metric of on-road performance.
Wind tunnel testing of rider position is normally conducted without feedback, i.e. aerodynamic and power data are not displayed to the cyclist. Thus, small changes that may gain precious seconds in improvement are not perceptible by the athlete. Small changes in the value of drag are just not perceptible to a cyclist. Similarly, the actual effect on the rider power output of small changes in rider position cannot be directly observed by the cyclist. What "feels faster" may in fact result in a loss of power, and consequently speed.
Providing near real-time feedback of the athlete's performance can allow the cyclist to test new posture adjustments directly in the wind tunnel, without having to interrupt the test, review the previous data, and compare it with the next test's data. These new solutions could be tested in real-time, without any interruptions. Optimizing the drag and rider power Optimizing the drag and rider power output through this continuous improvement process could be done in a shorter time. Providing feedback directly to the cyclist will also give the cyclist a far better feeling of what is an improved position on the bicycle. This data feedback would allow the cyclist to find his own improved position on the bike, making these positions more natural. Additionally, the feedback to the athlete can also aid in teaching the athlete the cost, in terms of performance, of not maintaining the optimal position during a race.
2. Previous Work
Wind tunnel tests have been conducted on a wide array of ideas designed to improve the aerodynamic characteristics of the rider and the bicycle. Previous wind tunnel tests and studies have focused on the body position of the cyclist, racing helmets and clothing, and on the bicycle. The most relevant studies and their results are described below.
2.1 Studies on Cycling Components
M. Zdravkovich [12] investigated the effect of splitter plates on the aerodynamics of bike wheels and frame. Splitter plates are flat pieces of material placed behind a bluff body to reduce the vortex shedding and the drag coefficient. Zdravkovich concluded that
these splitter plates have little effect on the drag of these bike components.
B. Parker [2] studied the difference between open and closed bike frames, and the importance of pedal spacing. Parker found that the closed frame produced a lower aerodynamic drag, but was more sensitive to pedal spacing. Further, it was found that reducing the spacing parameter too far could increase drag.
L. Brownlie [4] investigated the effects of cycling clothes texture on boundary layer transition. The author tried to trigger the laminar to turbulent boundary layer transition on the cyclist's body, using different types of fabric and texture. Brownlie attempted to delay the boundary layer separation from the cyclist's body by changing the boundary layer from laminar to turbulent to decrease the cyclist's drag. The flow transition in wind tunnel tests of a cyclist model was unobservable, and thus clothing modifications could not significantly decrease the cyclist's drag.
C. Kyle [10] investigated the effect of crosswind on cyclists' performance,
depending on the bike and type of wheels used. Kyle found that in favorable wind conditions, appropriate aerodynamic bicycle components can act like sails and help to lower the cyclist's drag. In particular, for winds coming from the front side, the use of disk wheels and aero frame can significantly improve a cyclist's performance in a time trial.
This same author also studied the aerodynamics of cycling components: racing helmets, handlebars and clothing in [9] and [11]. He compared the drag of several bike frames, combined with different handlebars, and measured the differences in term of time trial race times.
In this study, we will test various bikes, with various components: normal handlebar, aero bars (horizontal bars on the center of the handlebar, mostly used by triathletes, to reach a more streamlined position), helmets and different types of wheels. These previous experiments help develop a preliminary idea of the expected differences between these components.
However, each of the previous studies focused mainly on components comparison and methods of improvements. As cycling is governed by strict equipment regulations from the UCI (Union Cycliste Internationale), and extensive work was already done on the bicycle components, only minor improvements can be achieved in this field. Moreover, all riders have access to the same selection of equipment.
The missing key in most of these previous studies is the optimization of the bike and rider system against an acceptable performance parameter. We know from [1] and [2] that the rider's position accounts for the greatest percentage in the total drag of the bike/rider system. Decreasing the cyclist's drag will thus be one objective. However, keeping a high power output will also be of great importance.
Only C. Kyle addressed this problem of system optimization in [10] and [11], but Kyle touched on specific problems such as crosswinds. He did not address the general problem of system optimization in racing condition. Furthermore, this study was completed on the road, which is not a particularly controlled (in terms of accuracy and knowledge of the key variables such as drag and power output) environment.
2.2 Studies on Rider Positions
A. Gross [1] studied the effect of different streamlined bodies used on
human-powered vehicles (including bikes) to reduce the drag by improving the aerodynamic shape of the rider. Results of his work indicate that totally streamlined human-powered tandem could even reach the speed of 70 mph. This work illustrated the great importance of the rider's drag and the huge aerodynamic effects of his position on the bike. This prompted the impulse to focus on the rider's position in this thesis.
M. Flanagan [3] measured the importance of a cyclist's posture in terms of total drag in a wind tunnel. He studied several positions on the bicycle that showed sizable aerodynamic drag differences. This motivated our focus on the rider's posture for this work. Flanagan also addressed the issue of measurement uncertainty and disturbances, mainly due to the cyclist pedaling. These pedaling disturbances could be avoided by averaging the measured data on an appropriate period of time of several pedal revolutions. One of the most important conclusions of this work was the issue of situation repeatability. Flanagan found that basic data repeatability was mainly a function of precise body position and pedal cadence (both human factors) and these were not repeatable from one test to another to the accuracy desired. For example, subtle variations while trying to repeat a previous rider's position (from one test to the next one) caused drag variations of as much as 1.4 lbs on a total drag of 10 lbs. This uncertainty of more than 10% is totally unacceptable, and forbids all kind of comparison between different wind tunnel tests. To eliminate some of the test-to-test variability, the current work will provide near real-time feedback of a cyclist's performance in order to run only one single
test. Using a single test allows the rider to focus on optimizing their position by a performance parameter. Thus, the test-to-test data variations are minimized.
A majority of wind tunnel cycling tests have focused only on the aerodynamic
position of the cyclist, regardless of power output. Almost none of these previous studies and tests even mentioned the problem of power transfer efficiency and comfort of the rider, in terms of the power he is able to produce on the bike. Clearly, any rider position that reduces power-output may result in reduced race performance, even if the aerodynamic drag is reduced.
In addition to these previous studies, wind tunnels in several countries regularly work with professional cycling teams to improve a rider's time trial performance. These include the Texas A&M wind tunnel in Texas, USA; the Pininfarina wind tunnel in Italy, the Michelin wind tunnel in France, and several other wind tunnels in England, Japan and Germany. Although test methodology and results are highly guarded, it appears that none of these facilities measure any variables besides aerodynamic drag. Several web sites are also dedicated to cycling research and wind tunnel testing [13].
2.3 Mathematical Model for Road Cycling Power
J. Martin [5] developed an accurate mathematical model of cycling power and determined the values for each model parameter. The model was validated by comparing the values of cycling power predicted by this model with the power measured by a tested and reliable bicycle-mounted power measurement system. These results demonstrated that cycling power can be accurately predicted by a mathematical model. This study oriented us towards the measurement of the cyclist's power output, which was unusual but very important during wind tunnel cycling tests. The application of this model in our system will be detailed in Chapter 4.
3. Objective
The objective of this thesis is to design a system that a cyclist can use during wind tunnel tests to determine the position that optimizes race performance. That is, this system will allow the rider to determine the position that optimizes the trade-off between aerodynamic drag and power output. We will introduce two new concepts in wind tunnel testing:
e The use of an optimizing variable, the cyclist's virtual velocity, calculated from
performance data gathered in the lab. Obviously, a refined position results in an increase in the virtual velocity.
* A near real-time feedback of performance given to the cyclist inside the wind tunnel, in order to be able to test and compare different rider postures during one single test. Moreover, the cyclist will develop a more accurate understanding of the improved positions on his bike.
The system will be designed to be used within the Wright Brothers Wind Tunnel facility at MIT. Further, the system will provide feedback to the rider and any observers of a metric of optimized performance throughout the testing process. The system design will need to include specification of data acquisition, data processing and data feedback equipment. Finally, a prototype of the system will be built and installed. Proof of functionality tests will be completed.
4. Model for the Optimum Cycling Performance
This chapter will explore the analytical relationships that can be used to evaluate a cyclist's performance.
4.1 Modeling Power Consumption
The power output of the cyclist is needed to both propel the cyclist forward and to overcome losses in the system. A model of the system then must include all the components of the system that utilize the cyclist's power. This relationship has been developed and validated in [5].
In this thesis, we will assume a flat course (no changes in potential energy) so gravity is a non issue, and a steady state of the rider and his bike (in particular, no changes in kinetic energy). Moreover, the wind is assumed to be parallel to the bike plane (no crosswind) so the yaw angle of the bike and rider will be zero. Further, we will assume that our typical test will involve one rider on one bike with small adjustments. So we can assume the given value of drive chain efficiency, wheel bearing and rolling resistance coefficients are the same throughout the test.
The sources of power loss in riding a bike are:
* Aerodynamic Resistance: the force due to the cyclist's drag, called FDA here. e Rolling Resistance: this force is related to the weight of the bike and rider, tire
pressure, and gradient and texture of the riding surface. The effects of tire and surface characteristics are usually expressed as the coefficient of rolling resistance
CRR , which is the ratio of the tangential force to the normal force. Thus, the force due to rolling resistance is: CRRMTOTg .In the study [5], the author used the
average value of the results of a previous study completed by R. Kyle in [14]. The author took: CRR =0.0032.
e Frictional Losses in Wheel Bearings: this force is due to load and rotational speed
and appears in the wheel bearings of the wheels. The frictional force is CwBVG and the value of CWB = (91+8.7 -VG) in [5] is based on the values reported by Dahn et al. (1991) in [15].
* Frictional Loss in the Drive Chain: this loss occurs in the drive chain and is related to the power transmitted to the rear wheel. Since this loss occurs between the crank and the rear wheel, it can be viewed as a chain efficiency factor Ec Previous research using power measurements at the crank set and the rear wheel lead to Ec =97.7% [5].
There are two different types of measured power for the cyclist: the power output measured at the crank of the bike, called here Pcycle,, that reflects the power "in the cyclist's legs", and the power output measured at the rear wheel of the bike, called here
PBackWheel , that reflects the power at the end of the bike system, after the different types of
loss in the bike.
Given the cyclist's total drag and his power output, the mathematical model for road cycling power [5] can lead to the cyclist's virtual velocity. The cyclist's power
output needs to overcome the different losses of the system: the aerodynamic drag, the rolling resistance, the frictional losses in wheel bearings and the frictional loss in the
drive chain:
Pcyclist =(FDA -9 - V O G +VG 8- VG)-10- I Ec (1)
So with approximations validated in [5], the speed of the cyclist can be determined as:
VG Cyclist (2)
If we consider the power output at the rear wheel of the bike, we do not take into
account the different losses in the bike. This power output only needs to overcome the aerodynamic drag:
PBackWheel = FVG3)
And so, knowing the power at the rear wheel, the cyclist's velocity can be predicted as:
VG BackWheel (4)
FDA
Several variables from above are very hard to measure accurately and efficiently: the different coefficients of resistance and loss in the bike are very hard and subtle to measure. As the purpose of this thesis is to design a system that enables cycling tests in laboratories, the ground velocity will not be very easy to measure either.
From the above variables, the cyclist's power output (measured at the crank or at the rear wheel of the bike) and the total force of aerodynamic drag will be our two inputs for this model. Our system will thus need to measure these two variables and this model will output the cyclist's virtual velocity. Thus, the virtual velocity determined in the experiment is the same as the predicted ground velocity:
Vy =VG FBackWheel (5)
FDA
Using this mathematical model and this calculable virtual velocity, we are now able to reach an optimum between low cyclist's drag and high cyclist's power output.
4.2 Optimizing Function
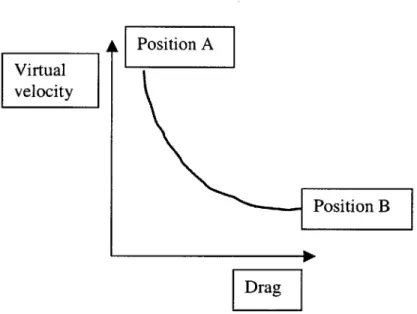
Using equation (2) above, and varying the drag with a given power output, or varying the power output with a given drag, we can easily show the influence of drag on virtual velocity (Figure 1) and also the influence of power output on virtual velocity (Figure 2).
For a given power output, a low drag leads to a high virtual velocity (Position A on figure 1) and a high drag, through high aerodynamic loss, leads to a low virtual velocity (Position B on figure 1).
For a given drag, a low power output leads naturally to a low virtual velocity (Position C on figure 2) and the opposite is true (Position D on figure 2).
Virtual velocity
L Position A
Figure 1: Effects of drag on virtual velocity for a given power output Drag
Virtual Position D velocity
Position C
Power Output
Figure 2: Effects of power output on virtual velocity for a given drag
Any change in the riding posture changes both drag and power output. The cyclist's position effects drag through his frontal area and his boundary layer's shape and nature (laminar or turbulent). Power output is affected when this position becomes uncomfortable and hard to hold during the effort. These changes are not empirical and are function of the rider.
Measuring the cyclist's total drag and power output is interesting, but being able to find the position optimizes these two variables is far more important. This is illustrated in Figure 3. The cyclist could indeed reach a very aerodynamic posture on the bike (very low drag), but according to all cyclists, this posture is difficult to maintain for a long time because of its discomfort. In this extremely aerodynamic position, the cyclist compromises power output to the extent of reduced racing performance (position E on Figure 3). On the other hand, letting the cyclist find a comfortable position in order for him to exert the most possible power, would result in a poor aerodynamic position. This bad aerodynamic position (high drag) would make the cyclist waste a great deal of power in aerodynamic loss, significantly decreasing his racing performance (position F on Figure 3). Finding the optimal balance between these two extreme positions appears to be a key point in race cycling.
Ground Optimal Positioning velocity
Position E: Position F:
Low drag/ Low power High drag/ High power
Figure 3: Combined effects of drag and power output on virtual velocity
We now have to find an optimization variable, which would reflect the degree of optimization between the two extreme positions E and F on Figure 3.
From Figure 3, it is clear that the relationship between rider power and drag need to be explored to optimize the rider's performance. During a race, the critical performance parameter is the finishing time. For a given riding position, if the power output and drag can be measured, the values can be used in equations (2) or (4) to predict the rider's speed. We define this predicted speed, our optimization variable, as the virtual velocity, V,.
5. Human in the Loop
Figure 4 shows the mechanism of this biofeedback. The cyclist, through his experience, has an idea, a precognitive scheme, of what is a good aerodynamic position and what is a comfortable position. This precognitive position on the bike, processed by neurons, travels through the spinal cord to be achieved by the muscles. This first closed loop (Loop 1 in the neuromuscular actuation system) shows that muscles can achieve a certain position of the body by unconsciously measuring tendon tension and muscle tension [7]. This is how the body regulates physically and unconsciously the position of our limbs. The second closed loop (Loop 2 in the perceptual system) is a proprioceptive adjustment, or perceptual adjustment, of the body position: we look at our body position and adjust it as we want.
These two closed loops enable us to fully adjust our body position to the precise idea of body posture we have. This riding position determines the cyclist's power output and aerodynamic drag which can be used to estimate the virtual velocity.
Without any feedback to the cyclist, the test mechanism would remain an open loop: giving a precognitive idea of position as an input, the cyclist could only test a single position. He would need one test for every precognitive idea requiring multiple tests to explore the entire range of positioning options. This, however, is not the way an athlete learns the skills of their sport. Typically, they rely on continuous feedback from their environment and/or coaching staff.
Feedback of drag, power output and virtual velocity information in real-time to the cyclist allows the cyclist to close this open loop. Thus, the cyclist would be able to test the efficiency of his precognitive position idea in real-time, and thereby improve it. This closed loop would allow him to change his position and test this change in real-time, in order to quickly reach an optimum position. Through only one test, numerous ideas
could therefore be tested. Moreover, the cyclist would acquire a better understanding, while on the bike, of what is an improved position and what is not.
PERCEPTUAL (BRAIN) NEUROMUSCULAR ACTIATION SYSTEM I ---I I Spinal Cord
Drag and Power Information through Video Screens (Real-time feedback) Disturbances
zi
cIQ CD H CD 0 -t CD 0 CD 0 0 (12 0 CD CD 0~ 06. Design of the Test Environment
In Chapter 4, it was shown that for a given set of conditions and equipment, a cyclist's power output and drag could be used to predict a virtual velocity. Refinements to a cyclist's position will be reflected in changes in drag and power output, which can be combined to predict the rider's virtual velocity. In this chapter, the design of a system for testing the cyclist is presented. The system allows for optimizing a cyclist's position, measured by maximizing the rider's virtual velocity.
6.1 System Requirements and Functions
The top-level goal of this system was to provide an environment whereby a cyclist can ride in race-like conditions. During each ride, the system needed to allow the safe variation of the rider's position and be able to accurately measure the effects of these position changes on the performance. The results of these changes were then presented to the rider in a manner that the rider can further refine his performance. It was convenient to define the following subsystems to meet this task.
* Clearly, safety concerns and data requirements dictate that the testing was done in controlled laboratory conditions. As shown in Chapter 4, the rider's drag was one of the most important predictors to performance. Thus, the test system was based in the MIT Wright Brothers Wind Tunnel, a facility large enough to accommodate a cyclist and capable of providing aerodynamic data. Thus, one major component of the system was the wind tunnel.
" A second component of the system was the device used to safely mount the cyclist
race conditions. This device also needed to vary the amount of the resistance the rider feels to mimic race conditions. The device must allowed for adjustments of varying bike sizes. Ideally, mounting a bicycle should take on the order of 15 minutes to allow minimal interruption between test subjects.
* A third component of the system was a device used to measure the rider's performance, in this case the rider's power output. This value, along with the
aerodynamic drag was used to predict the rider's virtual velocity. This sub-system needed to provide highly repeatable data. Accuracy was not as important as repeatability, as the rider is primarily concerned with the test-to-test variation, and not the absolute numbers.
* The next subsystem consisted of the software used for data acquisition, data reduction, and data presentation. This sub-system needed to interface to existing WBWT instrumentation, and be scalable such that future instrumentation and data presentation systems could be added. The primary function of this subsystem was to calculate the rider's virtual velocity.
* The final subsystem provided feedback to the rider; one subsystem will be the feedback device. This system required that feedback be provided to the rider in a non-intrusive manner. In addition, the feedback provided the rider was designed such that the rider could ascertain the effects of small changes in his position.
6.2 Sub-System Design
Individual sub-systems were designed using as many off-the-shelf components as possible. The innovation in this thesis is not the design of any component, rather the combination of technologies to provide a new measure of cycling performance. Additionally, the use of existing components provides for acceptability by the cycling and scientific communities.
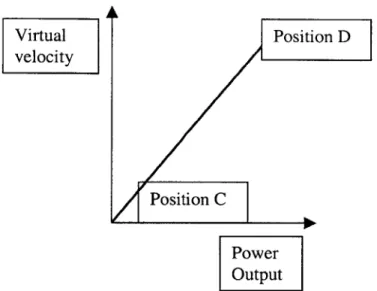
6.2.1 Wright Brothers Wind Tunnel
The Wright Brothers Wind Tunnel is a closed-return variable density wind tunnel. The 15-foot long test section has an elliptical cross section, with minor and major axes of
7.5 and 10 feet. The dimension of this test section inside the wind tunnel allows easy
fitting of a bicycle as well as the appropriate support for this bike and the cyclist. This system is capable of accurately measuring the rider and bike total drag along with other variables describing the general test conditions such as wind speed, temperature, or relative humidity.
I .... - - _ -73*
Figure 5: Exterior view of the Wright Brothers Wind Tunnel and its test section
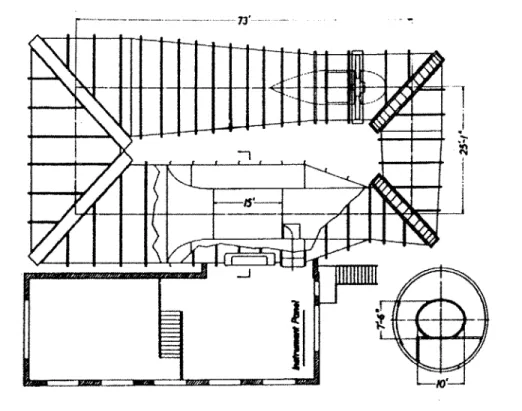
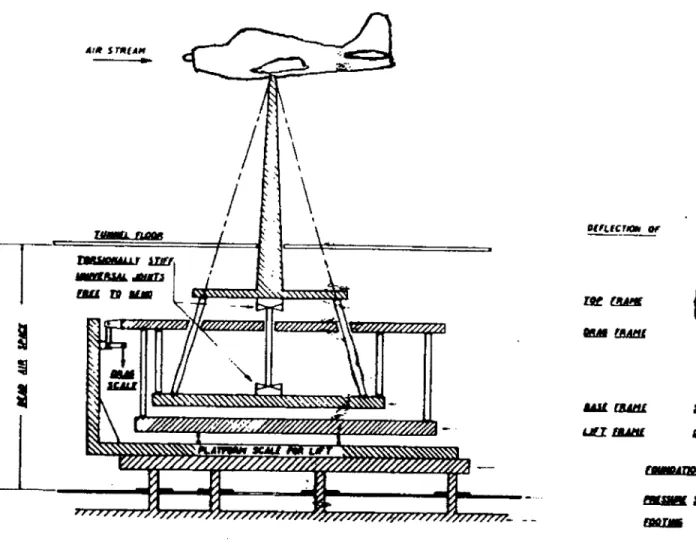
The aerodynamic balance is the drag-measuring component. This aerodynamic balance is a six-component pyramid balance that measures all three moments (rolling, yawing, and pitching) and all three forces (drag, side force and lift). The measurements of all six components can be made independently and remotely. Only the measurement of
the cyclist's drag will be of interest for this research. The sensitivity of the drag load cell will allow an accuracy of ±0.03 lbs for the drag measurement. Given that typical total drag values for a bicycle and rider vary between 6-8 lbs depending on the equipment used, this instrumentation provides drag data accurate to 0.5%.
Ali 5IWMAN
/
/
DEFLECT~ Or AWL fBA L~a MAME MB IwFigure 6: Six-component pyramid-type aerodynamic balance
YVvs
119
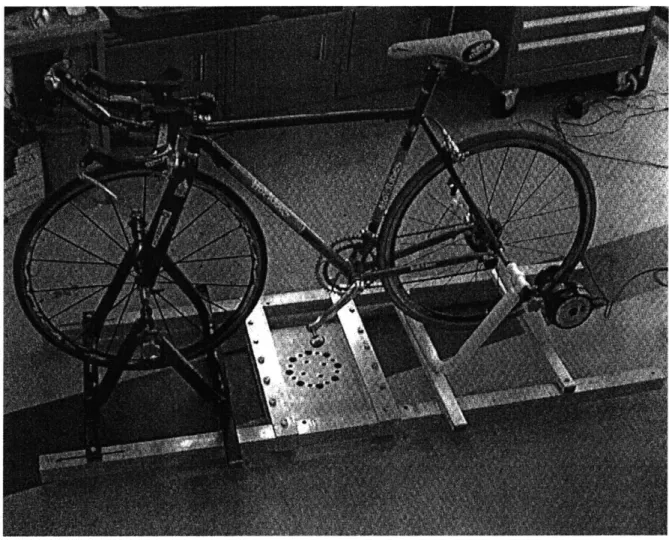
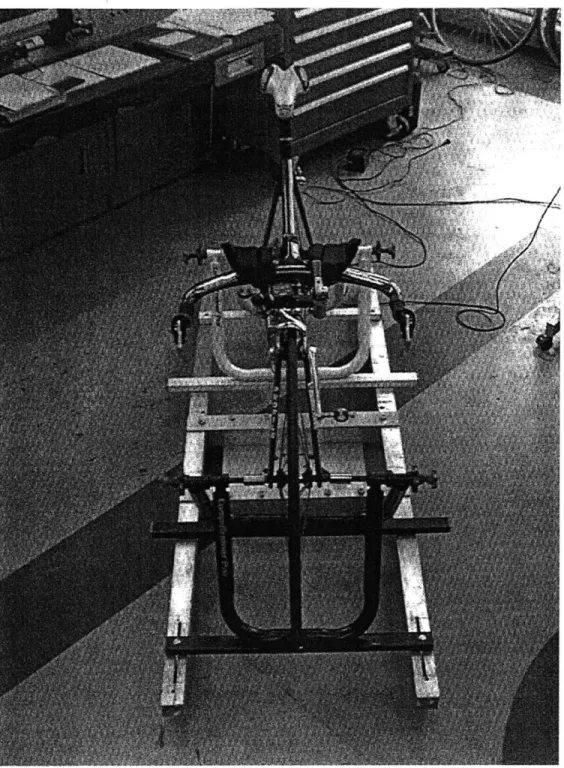
6.2.2 Bike Support Sub-System
The bike support (our connection subsystem) holds the rider and his bike inside the wind tunnel and connects to the WBWT main balance. In addition, the bike support may serve as a mounting point for any measurement or control devices connected to the bike. Figures 7 and 8 show the bike support design.
This bike support was designed to be connected with the aerodynamic balance through a material interface. The central part of the support is easily connected to the balance upper mount with screws.
To hold the bike in a stand still position, we used two rear mount stands of the CompuTrainer system, one holding the axle of the front wheel (the black mount stand on Figure 7) and the other one holding the axle of the back wheel (the white mount stand on Figure 7). The location of the front stand is adjustable to allow for testing different size bikes. In addition, mounting the bike through the axles allows the wheels to spin. The support is narrow in order to avoid a high drag disturbance due to excessive turbulence and is constructed of aluminum to have a light support, in order to be able to manipulate and carry it easily.
The use of the CompuTrainer system for the rear wheel mount also allows for the use of the CompuTrainer system for controlling the resistance the rider feels. This system has a programmable magnetic resistance system. There are a variety of modes that can be used to set the resistance, but the most useful for this experiment was to have the rider maintain a constant power output. This system also allows for the future addition of a adding a resistance control loop connected to the drag measurements taken in the WBWT.
6.2.3 Power Measurement Sub-System
The cyclist's power output is given by one of our two power measuring subsystems: the SRM system (Schoberer, 1994) that measures the cyclist's power output directly on the pedals of the bike and the CompuTrainer system that measures the cyclist's power output at the bike's rear tire.
The SRM system is directly mounted on the bike crank set and gives a direct output of the rider's power at the pedals. The advantage of this system is that there are no concerns for losses through the cycling drive train. The main disadvantage is that the
system needs to be moved from bike to bike. This can be complicated, as not all bottom-bracket systems are compatible with this crank-set. The mounting of this system on a bike could take up to one hour.
The CompuTrainer system is integrated into the test stand. A thumb-screw adjusts the preload of a small roller attached to the rear tire. While easily adaptable to a variety of bicycles, the measured power output is highly dependent on the tire contact. Thus, repeatability across tests can be compromised. However, as the main goal of this system is to accurately measure variance within a test, this should not be a concern.
As shown in Chapter 4, the output of the two different power measuring systems are used differently in the calculation of the virtual velocity. For the SRM system, the cyclist's power output directly on the pedals would give us Pcycus, and the CompuTrainer system that measures the cyclist's power output at the rear wheel would give us P .ackfheel
These two systems were tested in [5] and were proved to be accurate within 2%.
Both the SRM and the CompuTrainer systems allow for collection and display of other data such as bike speed, rider heart rate, and cycling cadence (pedal revolutions per minute). While not specifically used for this study these capabilities will likely be useful in future modifications of the system.
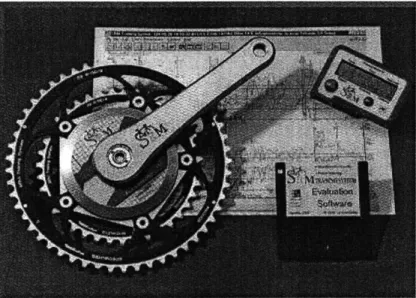
The SRM system (Figure 9) consists of four main components:
" A custom made, strain-gauge instrumented crank set (the Powermeter) that enables
pedal rate, effective torque and power output to be measured on all forms of bicycles and ergometers.
" A sensor cable, comprised of a receiver coil for data transmitted from the
* A handlebar mounted data logger and display unit (the Powercontrol) which incorporates an inductive receiver for Heart Rate transmission chest straps.
" Software that enables detailed analysis of individual exercise sessions and a user
defined range of files.
Figure 9: SRM System components
The CompuTrainer System (Figure 10) consists of four main components:
" A Handlebar Control Module placed on the front of the bike is a microprocessor
controller to select and cotrol the software functions.
" A Cadence Sensor that gives the pedaling rate in revolutions per minutes (rpm).
e An Electronic Load Generator to measure the cyclist power output and create a
Front Wheel Support
Posilock Rear Mount Stand
Holds the bike's rear wheel axis firmly in a stand still position.
Handlebar Control
Module
Controller for selection and control of interactive software functions. LCD display shows: Speed, Power Output, Pedal Cadence, Heart rate, Distance, Time, Rolling Resistance Calibration
Ear clip Heart rate Monitor .7-M-W Cadence Sensor Mounts on rear chamn stay Electronic Load Generator
Measures the cyclist's power output and creates a resistance on the rear wheel of the bike.
Eigure 10: CompuTrainer System components
Several distinct advantages are inherent with the use of the CompuTrainer system. The bike support was designed to hold a CompuTrainer rear mount stand on the rear wheel of the bike, so the use of this power measuring system is effortless. This device is measuring the cyclist's power output at the rear wheel whereas the SRM is measuring the cyclist's power output on the pedals. The CompuTrainer's way of measuring the power output does not involve anymore knowing the rolling resistance of the tires on the riding surface, the frictional losses in wheel bearings and the frictional loss in the drive chain to calculate the final power output of the cyclist on the road.
6.2.4 Data Handling Subsystem
The previous subsystems output the key variables of the cyclist's performance. The interface between the incoming drag and power output data and the final version presented to the cyclist is manipulated using the data handling subsystem.
Currently, the WBWT data acquisition system is based in LabView. This program, designed specifically for laboratory systems, is graphical in nature and easily expandable. Thus, this work will builds upon the existing LabView program used in WBWT for other wind tunnel tests.
Programming in LabView, one creates a "Virtual Instrument" (VI). Using this software and a VI we designed to our needs, we could process the incoming data, sequence it and display the final results on the video screens.
In addition to the expressed requirement of calculating the virtual velocity, other features are required for proper manipulation of the data.
* The user must be able to modify the data averaging time if the pedaling cadence is changed. The time averaging of the drag and power output measurements must be chosen accurately considering the previous work [3]: it must be fast enough to provide a near real-time drag measurement to the cyclist, but it must be long enough
to prevent disturbances from affecting the accuracy of the measurement (especially disturbances due to pedaling). Setting the pedaling rate at about 90 rpm (revolutions per minute), an averaging time of 20 to 30 seconds would be appropriate considering the previous study [3]. It would filter all the pedaling disturbances and would be fast enough to provide a near real-time data.
* The temperature and relative humidity inside the wind tunnel must be measured and taken into account in the calculation of the wind speed.
e The user must be able to change the digits of precision for every variable.
* Depending on the power output measuring system (SRM or CompuTrainer), the user needs to select the method of calculating of the virtual velocity using either equation
(2) or (4).
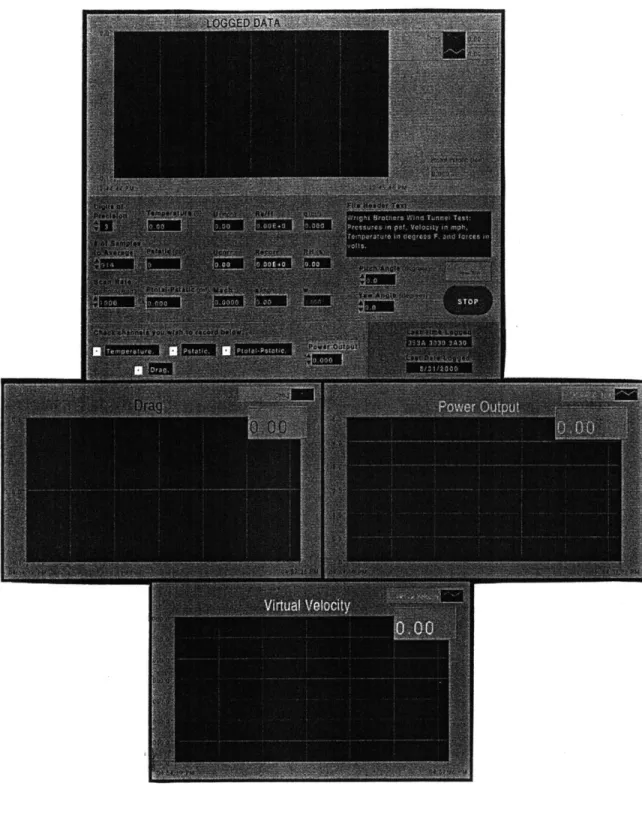
The LabView front panel displayed in the wind tunnel laboratory proposes all the possible settings and modifications on the screen as Figure 11 shows. All the details of this VI are given in Appendix A.
This software calculates in real-time the virtual velocity and displays the drag, power output and virtual velocity on three different real-time evolving graphs (to avoid the problems of data overlapping and multiple scaling).
Given these two variables (drag and power output), we implemented an algorithm that takes them as its two principal inputs (among other inputs from the wind tunnel), and calculates in real-time the virtual velocity. We then display these three variables on three real-time evolving graphs (we will separate the variables on different graphs to avoid the problems of data overlap and multiple scaling). Additionally, the algorithm had to be adaptable to and account for the wind tunnel parameters such as wind speed, temperature and relative humidity, and include calculation options such as time averaging.
6.2.5 Data Presentation Subsystem
This subsystem builds directly on the previous subsystem, taking the output from the data handling subsystem and displaying it to the rider. This subsystem consists of two parts: the software (also in LabView) that creates the visual displays, and the hardware used to display this data to the rider.
Finally, we need to display these graphs inside the wind tunnel to provide this real-time feedback of his performance to the cyclist. The type of display (analog, digital, audio, video...) and the position of these displays inside the wind tunnel will be very important considering the human factors involved: the ease of reading and accessibility to data will be key points for the cyclist. Further, the following design considerations are needed for this project.
e The staff using this instrumentation always has to keep in mind that the cyclist is in
the middle of a great effort, so his data processing time is longer. Giving him less data to process and analyze while he is riding is very important.
e The position of the different instruments inside the wind tunnel must be the most
appropriate possible to allow the cyclist to easily get all the information he needs while he is in a racing posture. In particular, any data displays (drag, power output and virtual velocity) must be in the middle of his riding position field of view, so that he should not move his head, but only his eyes, to see the data.
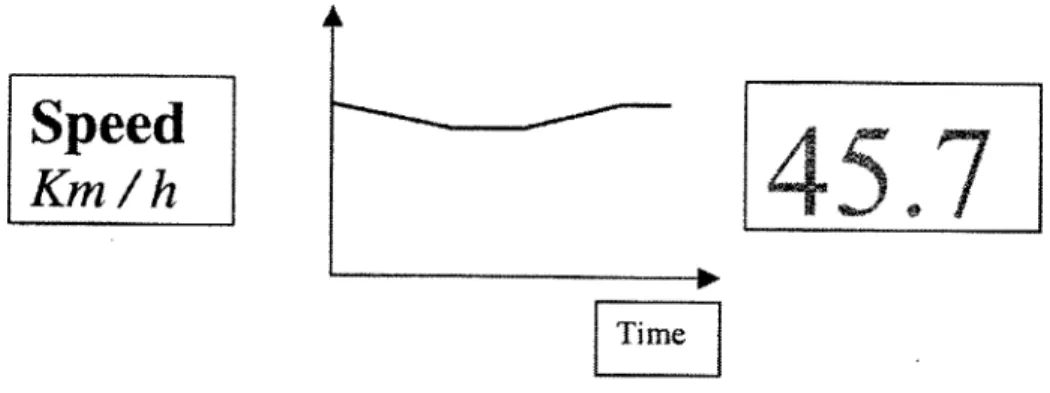
This final data, coming out of the previous calculation interface subsystem, has to be shown in the most appropriate way to the cyclist through a displaying subsystem. Studies in Human Factor Engineering [6] have shown that the most appropriate visual display to give a precise quantitative value is the digital display (here, the speed in km/h) and the most appropriate display for the human to detect variations is the analog display (here, the graph of the variations of speed). Consequently, the type of display was chosen to combine the accuracy of the digital display, which gives the cyclist exact values, and the ability to easily read variations of the analog graphic, in order for the cyclist to better detect an increase or decrease of his velocity. The cyclist has the option of viewing either drag, power output or virtual velocity in these formats.
An example of this display format for virtual velocity is shown in Figure 12. This performance information will be displayed in the form of a real-time evolving graphic that will show the variations of the cyclist's virtual velocity and the digital value of his speed (in km/h).
Speed
Km/h
45.7
Time
Figure 12: Virtual velocity display
The use of a helmet integrated visual display was selected for providing information to the rider. This helmet provides a small viewing area near the left eye. This was felt to be the optimal solution, as there is no need for the cyclist to move their head to view the data.
This helmet-integrated visualization system can receive a video signal through a video receiver and sends this signal to a model video projector. This model video projector displays the information on a tiny screen in front of the user's left eye. All the video image is focused at infinity, so that the user's eye does not need to adapt and focus to easily see the information displayed. All these components are built in the cycling helmet to enable the cyclist to move his head freely.
The interaction between the cyclist and the laboratory staff, through this whole system, is visualized on Figure 13.
WIND
TUNNEL
I
CD t).) 0 CD -t 0 0 0 CD CD -i CD C) 0 0 CD 0 CDI
I
LAB
Video Screen: Drag and Power Information
Helmet Visualizatioi of Virtual Speed
Drag
Measurement
Computer
Power
Measurement
'rofile
Researchers
/ Coaches
Advice tihrough
Video Profile
(Real-time)
Virtual Speed
Information
Try / Find
Improvement
(
-
: Real-time FEEDBACK
)
00Position of
Cyclist
7. Evaluation of the System
The design and construction of the system was followed by a short test session to verify that the system met the functional requirements outlined above. It should be noted that at this time, it was not possible to get the output from any of the power measurement devices into the WBWT computer system. Negotiations with vendors are ongoing to resolve this issue. However, the Computrainer allows for a setting that varies the resistance the rider feels such that the rider is maintaining a pre-set power output. In the validation test, this pre-set power output was used for the input to the calculation of the virtual velocity.
7.1 Scope of the Test
The first wind tunnel test utilized the bike support, the drag measuring system, the power measuring system and the LabView software and verify their interconnection. We showed that the basic components of this system are working together and that the first experimental results meet the expected results from the previous studies.
7.2
Method of the Test
We first ran a tare test with only the bike support and the power measuring system inside the wind tunnel to determine the drag of these two components. This value was then subtracted from the total measured drag to obtain the drag of the cyclist and bike
only.
In this first test, we used one rider (triathlete, 24 years old, healthy), two different bikes with different components and the basic components of our system.
* Bike 1 was equipped with pursuit bars (wide handlebar) and aero bars. On this bike, Position 1 was on the pursuit bars and Position 2 was on the aero bars.
* Bike 2 was equipped with a normal racing handlebar. On this bike, Position 3 was on the top of the handlebar (called general touring pose in [3]) and Position 4 was on the bottom of the handlebar (called drop touring pose in [3]).
The main setting of this test was to stabilize the power output of the cyclist at 280 Watts. This was easily achieved with a CompuTrainer option to hold the cyclist's power output at a constant value. The wind tunnel wind speed was set to 25 mph, the estimated 20 K time trial speed of this rider.
For each bike, the data was collected during six minutes. For bike 1, position 1 was held during the first three minutes, and the rider adopts position 2 without interrupting the test. For bike 2, the same movement was repeated between positions 3 and 4.
The sampling rate was set at 1000 samples per second, and the averaging time was 1 second. We chose this very short averaging time in order to be able to detect the pedaling disturbances and determine their importance on the total drag measurement. Moreover, this short averaging time would demonstrate if the rider posture is comfortable or not by showing if he had to pedal with strongly marked pedal revolutions. An uncomfortable position is indeed usually forcing the rider to end each pedal revolution with a shock. This can be detected with such a short averaging time.
7.3 Results and Discussion
The results of this test are shown in Table 1:Drag Drag Virtual Virtual
Average Standard ground ground
in lbs Deviation velocity velocity
in lbs Average St Dev in mph in mph Bike 1 Position 1 6.34 0.215 31.5 1.28 Bike 1 Position 2 5.39 0.313 37.1 2.12 Bike 2 Position 3 7.52 0.24 26.6 1.54 Bike 2 Position 4 6.64 0.263 30.1 1.70
Table 1: Drag and virtual velocity measurements of this test
During this experiment, the tested components (bike support, drag measuring system, power measuring system and software) interacted to give the cyclist's virtual velocity. All the design goals were met: connecting the rider and its bike to the aerodynamic balance to measure the drag, connecting the power output measuring system to the bike and interacting with the software designed for this task.
We noticed first that the pedaling disturbances were accounting for up to 6% of the total drag in the worst case. These disturbances could be avoided by averaging the data over an appropriate period of time [3]. Indeed, if we average the drag data over a period of 20 seconds (30 revolutions of pedals) by averaging 20 successive values (each of one averaged over 1 second), the standard deviation of the new drag values drops to
1.5% of the total drag. This shows that we can almost avoid the pedal disturbances by
averaging the drag data over a longer period of time.
The aero bars confirmed their efficiency, improving the drag of almost 1 lb (a gain of 15% on the drag) and increasing the virtual velocity of 5.6 mph compared to the pursuit bars. These results are in good correlation with a previous study [9].
Position 4 (drop touring pose) is also decreasing the drag of 0.88 lb (almost 12% of the total drag) and increasing the virtual velocity of 3.5 mph compared to position 3 (general touring pose). These trends are also correlated with a previous study [3].
Finally, we observed that the standard deviation was the highest for position 2, showing that the cyclist is giving more shocks during a pedal revolution. It suggests that this position (which is the less natural posture on the bike among the four positions) was less comfortable than the others. This position could lead the cyclist to decrease his power output in a longer test because this posture was not comfortable for him. The rider's comments confirmed this trend when he said that position 2 was hard to hold.
8. Conclusions
A system was designed to provide near real-time feedback of performance to a
cyclist undergoing aerodynamic testing inside the Wright Brothers Wind Tunnel. This system provides an analytical estimation of cycling performance based on laboratory-measured parameters. The use of the virtual velocity, drag and power output gives a sense of performance to the cyclist. Then, giving a near real-time feedback directly to the cyclist allows him to improve his position very quickly and efficiently. This feedback is also of great importance for him to get the feeling of improved postures.
Based on previous studies of aerodynamics cycling equipment and cycling performance, we determined the requirements for our system given the goal of providing the cyclist with quantified values of his cycling performance such as virtual velocity, drag and power output in near real time. Based on these requirements, we integrated several data acquisitions systems into the WBWT test environment. The integration of these systems required a bike/rider mounting system be designed. Additionally, rider power measurement systems were integrated into the test stand. The LabView software used in the WBWT facility was modified to receive the addition rider power output, calculate the rider's virtual velocity based on this power output and the previously existing drag sensing systems. New output screens were also designed in LabView to project the test parameters in near real time to the rider through a helmet-mounted display.
Finally, testing evaluated the interaction between the main components of this system. One rider was successfully tested in two riding positions each on two different bicycles. One bike was a typical road racing bicycle, the other was a bicycle designed for time trailing. The results agreed well with the analytical predictions as well as previous test results. The expected trends of cycling performance were observed along with subtle data characteristics that were found to correlate with the rider's perceived comfort of a given posture.
A logical extension of this study would be to incorporate the cyclist's power
output information into the LabView system. In particular, other products used to measure cycling power output could be investigated to facilitate this link from the bike to the computer's laboratory. Closing this loop in the system would allow the rider to vary their power output during a test. Additionally, the resistance on the rear wheel could be controlled to be proportional to the drag experienced during the test. It would be worthwhile to determine the limits of a rider's level of perception in power changes due to small position adjustments resulting in small changes in system drag.
Studies of athletic performance have shown video feedback to be a valuable training tool. Consequently another logical step would be to incorporate video feedback showing the body position to the rider, and test its interactivity with the laboratory's staff. This video feedback could also be coupled with an audio link for coaching directly inside the wind tunnel. It is expected in this application that a rider could more quickly adapt to an optimal position when provided with visual feedback of this position.
9. Appendix A
Details of the Virtual Instrument (VI) on LabView used in this study.
The Front Panel is the interface with the user, to enable him to change the settings, enter new values or have a real-time visualization of the incoming or processed data.
The Block Diagram is the hidden part of the VI. It is also the main body of this VI where all the information is processed and where the functions of this VI are created and materialized.
This Front Panel consists of four real-time evolving screens. The main block enables the user to change the settings of the scan rate (which is the number of samples taken per second) and the number of samples taken to give an averaged data. This averaged data will be showed on the real-time evolving graph. The digit of precision of the data can also be changed. The lower part of this main block allows the user to choose which channels he wants to record on a separate file.
The three blocks at the bottom are giving a real-time evolving graph of the cyclist's drag, power output and virtual velocity.
The Block Diagram materializes the different functions of this VI, with different operators wired together. The incoming raw information is taken at the entrance, processed through the different functions, and displayed on the various real-time evolving graphs.
This VI was created and used with LabView 5.1
E tr T
a froes A
LLJ5~2J 4 S~-l
Arvt Plot
$t'tw ,gnaI/ts antS owe
I4
a I
has "eor et 40o
rLMfl
Figure 15: Block Diagram Of the VI used in this study
... .. ....
Rol",
W001 UP64Mf "04M to Q4
.. ...
Mf
2*O 2 too data ton no# Chow* AwnItar of tim~pmts L2' IJi",s/ 2W. J1 tct A*g. dlMej3/ * ) I c 313 fastr~n AtIP atoo wIts
Px
=1V
15
Qi-i )
3/31t 4r -] d71 ... Fin ... DAtAj I T to-, $46 STOP AftReferences:
[1] Gross A.C., Kyle C.R. and Malewicki D.J. (1994) "The Aerodynamics of
Human-Powered Land Vehicles" Sci American, 249, 142-152
[2] Parker B.A., Franke M.E. and Elledge A.W. (1996) "Bicycle Aerodynamics and Recent Testing" 3 4th Aerospace Sciences Meeting & Exhibit, AIAA 96-0557
[3] Flanagan M.J. (1992) "Consideration for Data Quality and Uncertainty in Testing of
Bicycle Aerodynamics" 17th Aerospace Ground Testing Conference, AIAA 92-4038 [4] Brownlie L.W., Gartshore I., Chapman A. and Banister E.W. (1991) "The
Aerodynamics of Cycling Apparel" Cycling Science September/December 1991, 44-50
[5] Martin J.C., Milliken D.L., Cobb J.E., McFadden K.L. and Coggan A.R. (1998)
"Validation of a Mathematical Model for Road Cycling Power" Journal of Applied Biomechanics, 1998, 14, 276-291
[6] Sanders M.S. and McCormick E.J. (7h edition) "Visual Displays of Dynamic
Information" Human Factors in engineering and Design, 2, 132-160
[7] McRuer D.T., Clement W.F., Thompson P.M. and Magdaleno R.E. (1989) "Pilot
Modeling for Flying Qualities Application" Systems Technology, Inc., Technical Report No. 1235-1
[8] Sanders M.S. and McCormick E.J. (7th edition) "Human Output and Control" Human
Factors in engineering and Design, 3, 225-383
[9] Kyle R.C. (1989) "The Aerodynamics of Handlebars and Helmets" Cycling Science
December 1989, 22-25
[10] Kyle R.C. (1991) "The Effect of Crosswinds upon Time Trials" Cycling Science
September and December 1991, 51-56
[11] Kyle R.C. (1991) "Wind Tunnel Tests of Aero Bicycles" Cycling Science September
and December 1991, 57-61
[12] Zdravkovich M. M. (1992) "Aerodynamics of Bicycle Wheel and Frame" Journal of Wind Engineering and Industrial Aerodynamics, 40, 55-70
[13] Web sites:
-www.bicyclesports.com (last visit: 06/21/02) -www.pkracing.net (last visit: 06/21/02)
-www.visiontechusa.com/windtunnel1995.asp (last visit: 06/21/02) -www.slowtwitch.com (last visit: 06/12/02)
-www.visiontechusa.com (last visit: 06/03/02) -www.labicicletta.com (last visit: 06/03/02)
[14] Kyle R.C. (1988) "The Mechanics and Aerodynamics of Cycling" Cycling Science
September 1988, 34-40
[15] Dahn K., Mai L., Poland J. and Jenkins C. (1991) "Frictional Resistance in Bicycle Wheel Bearings" Cycling Science September-December 1991, 28-32