MITLIBRARIES
3
9080 02237 2673
i iliiiilililillli: 'am
11m
!iMliit;
iiiS
il'I'ii'.fiiiHI'iri.i:.!!/'!' lffl^^l!f!/Wli;);Mllffl;l'i::iiii
:;i|||i
^1iiii:
:;:||li|li|||j||ii|f||||||||p^^^-'iifeiisfv.,
,llliiiill
-iiiiii
iiiiiii:
Ipiiili
iiiliiiiiii
\Mi!i(i;i!i;iiSll :i,;!!iiii|i!l;:|!;!|Digitized
by
the
Internet
Archive
in
2011
with
funding
from
Boston
Library
Consortium
IVIember
Libraries
^^H^y
Massachusetts
Institute
of
Technology
Department
of
Economics
Working
Paper
Series
DO
CEOs
SET
THEIR
OWN
PAY?
THE
ONES
WITHOUT
PRINCIPALS
DO
Marianne
Bertrand,
UChicago
&
NBER
Sendhil
Mullainathan,
MIT
&
NBER
Working
Paper
00-26
September 2000
Room
E52-251
50
Memorial
Drive
Cambridge,
MA
02142
This
paper can be
downloaded
without
charge
from
the
Social
Science
Research
Network
Paper
Collection
at
MASSACHUSETTSINSTITUTE
OFTECHNOLOGY
OCT
3
2000
ABSTRACT
We
empiricallyexamine two
competing views of
CEO
pay. In the contractingview,pay
isused
to solve
an agency problem:
thecompensation committee
optimallychooses
pay
contractsthatgivethe
CEO
incentivestomaximize
shareholderwealth. In theskimming
view,pay
is theresult of
an
agency problem:
CEOs
have
managed
tocapture thepay
process so that theyset theirown
pay, constrainedsomewhat by
the availabilityof
cashorby
fearof drawing
shareholders'attention.
To
distinguish theseviews,we
firstexamine
how
CEO
pay
responds
toluck, observable
shocks
toperformance
beyond
theCEO's
control.Using
severalmeasures of
luck,
such
aschanges
in oil price for the oil industry,we
find substantialpay
for luck.Pay
responds
about asmuch
to a "lucky" dollar as to a general dollar.Most
importantly,we
find thatbetter
governed
firmspay
theirCEOs
less for luck.Our
second
testexamines
how much
CEOs
are
charged
forthe options theyare granted. Since optionsnever appear
on
balance sheets,theymight
offeran
appealingway
to skim.Here
againwe
find a crucial role forgovernance:CEOs
inbetter-governed firms are
charged
more
forthe options they aregiven.These
resultssuggestthat
both
views of
CEO
pay
matter. In poorlygoverned
firms, theskimming view
fits better(payforluck
and
littlecharge foroptions)while inwell-governed
firms,the contractingview
fitsbetter (filteringout
of
luckand
chargingforoptions).1
Introduction
There
aretwo predominant ways
to thinkabout
CEO
pay.The
first one,which
we
refer to as thecontracting view, relies
on
principal-agentmodels.Because
CEOs
oftenown
very little ofthe firmthey control, shareholders face a classic
moral
hazard problem:CEOs
may
not alwaysmaximize
firm value in
making
their decisions.Under
the contracting view, shareholders (actingthrough
the
board
or thecompensation committee)
useCEO
pay
to reducemoraJ
hazard. Explicitpay
for performance, such as long
term
contracts or options,and
implicitpay
for performance,such
as
a bonus payment,
areallused
by
boards to increaseCEOs'
incentives tomaximize
shareholderwealth.^
The
second view,which
we
referto as theskimming
view, hasbeen
championed
by
practitionerssuch
as Crystal (1991). It also beginswith
the separation ofownership
and
control, but it arguesthat this separationallows
CEOs
to gaincontrol ofthepay
setting process itself.By
packing theboard with
their friends, orany
othermean
ofentrenchment,many
CEOs
de facto set theirown
pay.
They
skim
what
theycan
from
shareholders, constrainedperhaps
by
theamoimt
offundsinthe firm,
by an
unwDlingness todraw
the attention of shareholder jictivistgroups
orby a
fearofbecoming
a takeover target.Within
these constraints, however, theypay
themselves asmuch
as possible.Whereas
pay
in the contractingview
isan
attempt
to solvemoral
hcizard,pay
in theskimming
view is the resultofmoraJ
hazard.We
propose two
tests to differentiate these models. In thefirsttest,we
examine whether
CEOs
'Murphy (1985, 1986)
b
a forerunner ofthe vast literature that has empirically analyzedCEO
compensationinthe context ofthe princip>al-agent model. The resulting literature is summarized in Murphy (1999).
The
majoreconometric work has been to test for vaJue-optimizing incentivescheme by studying the correlation between pay andperformance. Jensenand Murphy(1990) usethisframeworktoarguethatpoliticalconsiderationsconstrainpay
so that incentivesare too low. Joskow, Rose £ind Shepard (1993) empirically examine thisargument in regulated industries. Othertests ofthe agencyframework can be foundin Gibbons and
Murphy
(1990),who
testfor relativeperformance evaluation andcareer concerns, Garen (1994) and Aggarwal and Samwick (1999a), who test for
risk-return treideofe, and Hubbard and Palia (1994) and Bertrand and Mullainathan (1998),
who
test whether payare
rewarded
for observable luck.By
luck,we
mean
changes
in jBrmperformance
that arebeyond
CEOs'
control. In simpleagency
models,pay
should notrespond
to luck sinceby
definition theCEO
cannot influence luck.Tying
pay
to luck will not provide better incentives; it will onlyadd
risk to the contract (Holrostrom, 1979).^
Under
theskimming
view,on
the otherhand,
pay
willrespond
to luck since theCEO
can
divert those "lucky" dollars topay
herself as easily as shecan
divert earned dollcu^.
To
empiricallyexamine
the responsiveness ofpay
to luck,we
use three differentmeasures
ofluck. First,
we
perform a
casestudy
ofthe oil industrywhere
largemovements
in oil pricestend
to affect firm
performance on
a regularbasis. Second,we
use changes in industry-specificexchange
rate for firms in the traded
goods
sector. Third,we
use year-to-year differences inmean
indiistryperformance
toproxy
for the overalleconomic
fortune ofa
sector.This
lastmeasure
verymuch
resembles the
approach
followed in the relativeperformance
evaluation literature.For
all threemeasures,
we
find thatCEO
pay responds
to luck. Infact,we
find that for all three luckmeasures
CEO
pay
is as sensitive toa
"lucky dolleir" as toa
"general dollar."This
basic finding ofpay
for luck, however,can be
explainedby
complicating the basicagency
model.
For
example,suppose boards wanted
theirCEOs
to forecast orrespond
to luck shocks.Tying
pay
to luck in this casemay
be
necessary to provide better incentives. In the oil industry,rewarding
theCEO
after the fact for seeingan
oilshock
coming
encourageshim
tokeep
his eyesopen
before the fact. Alternatively,suppose
the "value" ofa
CEO's
hiiman
capital rises cuid fallswith
industry fortunes.One
would
then
find thatpay
correlateswith
luckbecause
theCEO's
outside
wage
moves with
luck.While
we
wiU
argue thatthesearguments
may
be
incorrect,theymotivate ustosearchforfurther ^Note our emphasis on observable luck. In any model, given the r£indomness ofthe world,CEOs
(and almosteverybody else) will end up being rewarded for unobservable luck. Note also our emphasis on the fact that this prediction holds in simple agency models. As we will discuss shortly, complications to the agency model can in principlealter thisresult.
tests.
We
thereforeexamine
another direct implication of theskimming
model, thatskimming
willbe
less important in well governed firms.Good
governance willmake
ithard
for theCEO
to gaincontrol ofthe
pay
process.So
ifpay
for luckcomes from skimming,
we
expect to see less of it in the bettergoverned firms.We
test this hypothesis usingseveralmeasures
ofgovernance: presenceof largeshareholders {onthe
board
and
overall),CEO
tenure (interactedwith
the presence of large shareholders to betterproxy
for entrenchment),board
sizeand
fraction of directors that are insiders. Consistentwith
skimming,
we
generally find that the bettergoverned
firmspay
less for luck.^These
effects are strongest for the presence of large shcireholderson
theboard
who
reducepay
for luckby
between
23
and
33%.
Large shareholders are especiallyimportant
asCEO
tenure increases, consistentwith
the idea that
unchecked
CEOs
can
entrench themselves over time.The
findingson
governance
castdoubts on
the alternative interpretationswhich
make
pay
for luck optimalthrough
complicationsto the agency model. If
pay
forluckwere
infactoptimal,we
would
not expect to see wellgoverned
firms use less ofit. For example,
whether
or not a large shareholder is present,CEOs
would have
to
be
rewairded for arise in the vcilue of theirhumjin
capital.These
findings instead suggest thatat least
some
ofthepay
for luck in poorly governed firms isdue
toskimming
by
CEOs.
Our
second test revolvesaround
another aspectofCEO
compensation
that hasreceivedatten-tion in recentyejirs: the greinting of
new
stock options. Principal-agenttheory predicts thatwhen
options aregranted, other
components
ofcompensation
shouldbe
adjusteddownwards
to leave theCEO
indifferent. In other words, theCEO
shouldbe charged
for the options she is granted, ifnottheir Black-Scholes value
then
atleast this value timesa
riskcorrectionfactor.'* Supporters ofthe ^Wheneverwe refer to "less pay for luck" we meanthat there is less payfor luck relativeto theamount ofpayfor performance. Thus, these results would not be driven bywell governed firmssimply givingless overedl payfor performance.
^Thebasic ideais that options havevalue. For example, supposea
CEO
isgranted 10,000 options with astrike price of50,a horizonof 3years andthefirmiscurrentlytradingat 50. Theseoptionshave valueinandofthemselves because evenifthefirmunder-perfonns relative tothemarketandearnsacumulative3-year{nomincil)returnofonlyskimming
view,on
the other hand,emphasize
that stock optionsdo
notappear
on
balance sheets.Because
ofaccounting treatments, firmsdo
not takea
financial chargeforgranting options.CEOs
can
thereforepay
themselvesthrough
option grantswithout
affecting thecompany's
bottom
line.Under
theassumption
that shareholders only (or mostly)pay
attention to the accountingbottom
line,thegrantingof
new
stock optionswould
representan
easyway
toskim
more
without
attracting shareholders' attention.No
cut in the othercomponents
ofpay would
be
necessary.Thus
whileagency
theory predictsa
largecharge for options,skimming
predictsabout no
charge.Unfortxmately,
a
directmeasure
ofhow much
CEOs
are in factcharged
for their options isnot possible
because
ofa
naturalomitted
variable bias.Taking
oiu: leadfrom
thepay
for luckfindings,
we
thereforefocuson
the questionofhow
governance
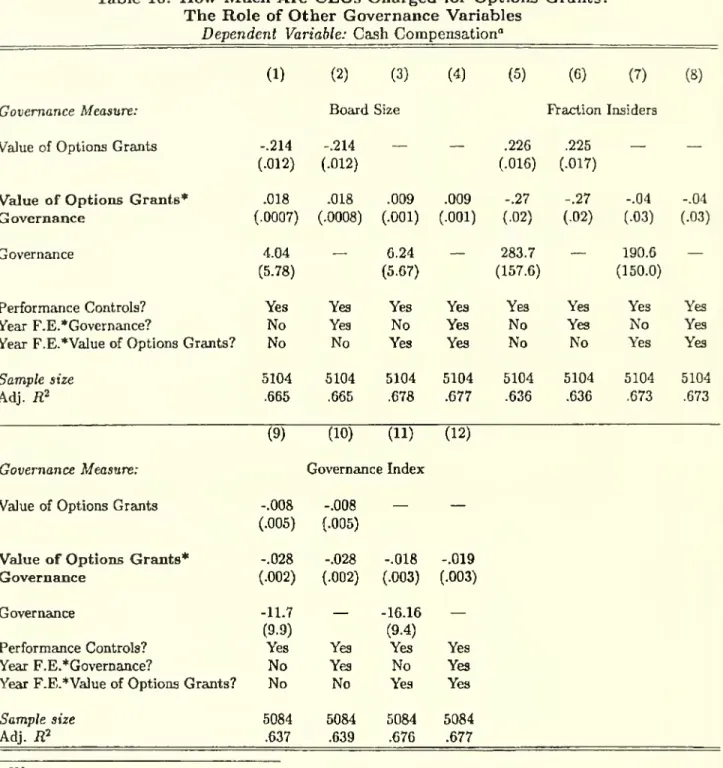
affectsthe charge for options.Using
the
same
measures
ofgovernance,we
generally find thatmore
poorlygoverned
CEOs
arecharged
less for their
new
options grants. Forexample,
foran
options grantworth
1 million dollars (inBlack-Scholes terms),
an
extra large shareholderon
the bocird increases the charge for optionsby
between
30and
50 thousand
dollars.As
before,we
also find that asa
CEO
tenure increases, thecharge for optionsdiminishes in firms
without
a
large shareholder.In
summary,
thispaper
containsthreemain
results. First,CEO
compensation shows
on
averagea
significantamount
ofpay
forluck. Second,wellgoverned
firms displaylesspay
forluck, suggestingthat it is possibleto filterout luck. Third,
CEOs
in well governed firms arecharged
more
for theirstock options grants.
At a
first glance, these resultsseem
to providesupport
for theskimming
view.
CEOs
arerewarded
for luckand
seem
tobe
able toskim
using options.But
noticethatthey
also provide
support
for the contracting view.Well
governed firmsdo
manage
to filter outsome
luck
from
performance
and do
manage
to chargemore
for options.We
feel thattheresults suggest10%, hestillgains(.1) 50 10,000
=
50,000dollars. Eveniftheoptionisgranted outofthemoney,the sameeffect will arise becausethe optionmay
come into the moneyjust because ofmovements in share pricethat comes fromthefirm's natural volatility. Agency theory therefore predictsthat
CEOs
shouldbe chargedforthe gift implicit inas a
whole
thatboth
views ofCEO
pay
are true. In practice, executivecompensation seems
tobe
better characterized
by
either theskimming
or the contractingmodel
depending
on
the extent towhich
there isan
active "principal" (or principals) present toactually designpay
contracts. Bettergovernance
means
that there ismore
ofan
active principaland
optimal contracting fits better.Worse
governance
means
that there is less ofan
active principaland
theCEO
ismore
likelyto sethis
own
pay.^The
rest ofthispaper
is organized as follows.We
startby
presenting our test of the lack ofperformance
filtering (section 2).We
first presenta
very simple theoreticalbackground
(section2.1), review the existing evidence (section 2.2)
and
explain the empiricalmethodology
(section2.3).
We
then
establish the existence of pay-for-luck,both
in the specific case ofthe oil industry(section 3.1)
and
formore
general sets of industries (section 3.2). In section 3.3,we
demonstrate
the role of
governance
in limiting the extent of pay-for-luck. In section 4,we
establish that thesame
governance
variables alsomatter
in limitingthe gift nature ofnew
stock option grants.We
siunmarize
and
concludein Section 5.2
Pay
for
Luck
Test:
Background
2.1
Theoretical
Background
Our
first test focuseson
whether
CEOs
arerewarded
for observable luck.A
simple theoreticalmodel
willmake
precisewhat
agency
theory saysabout
thereward
for luck.Consider
astandardagency
setupwhere
risk-neutral shareholders,perhaps
operatingthrough
theboard, try to inducea risk-averse top
manager
tomaximize
firm performance. Since the actions of theCEO
can
be
'This confirma the sentiment that emerges from conversations with compensation consultants as they describe being hired bytwotypesof firms: the oneswheretheyclearly havetorespondtotheCEO
andthe oneswherethey clearly have torespondtotheshaureholders.hard
to observe, shareholders willbe unable
to signa
contractthatspecifies these actions. Instead,shareholders will offer a contrax:t to the
CEO
where
hercompensation
level ismade
todepend
on
the firm's performance. Letp
represent firmperformance
and
a
theCEO's
actions,which by
assumption
areunobservableby
theshareholders.Firm
performance depends
on
theactions oftheCEO
and
on
random
factors.We
split therandom
feictors intotwo components:
those thatcan be
observed
by
shareholdersand
those that cannot.For
an
oil firm, the price ofcrude
oilwould
be
an
observablerandom
factor. Lettingo be
the observable factorand
u
be
the unobservable noiseterm,
we
assiune thatperformance
can
be
written as:Under
some
technicalconditions,Holmstrom
cuidMilgrom
(1987) calculatetheoptimal
incentivescheme
for this model.^ Let sdenote
this incentive scheme. Since shareholderscan
only observetwo
variables,p and
o, the incentivescheme
could atmost
depend on
thesetwo
variables. In fact,shareholders
wiU
onlyreward
CEOs
forperformance
net ofthe observablefactor.s
=
Q
+
/3(p-
Jo)=
a
+
;0(a+
u) (1)In other words, the optimal incentive
scheme
filters theobservable luckfiromperformance.This
is because leaving o in the incentive
scheme
providesno added
benefit to the principal as,by
definition, the agent has
no
control over o. "Incentivizing" heron
o has thereforeno
incentiveeffects.
Beyond
providingno
benefit, it actually costs the principalbecause
not filtering out luckincreases the variance oftheincentive scheme, thereby forcing the principal to increase
mean
pay
to
compensate
the risk averse agent.^
How
might
we
expect filteringof lucktooccur
in practice? Explicit incentive contracts,such
as'Essentially,
we
need toassume thattheCEO
hasCARA
utility andthat outcomes followa Brownian process.A
much
moregeneral result can be found in Holmstrom (1979).options, rarely filter. For example, options axe rarely ifever
indexed
againstmarket
performance.This need
notbe
inconsistentwith
alack offiltering, however.One
might
expect that thebestway
to filter luck is
through
theuse of subjectiveperformance
evaluation. Inpractice,we
would
expectthe
board
tobe
theprimary
mechanism
for doing this.The
board
should use the discretionarycomponents
ofpay, suchas bonus, salary ornew
options grants, torespond
to luck shocks.2.2
Existing
Evidence
Previous
work
already hints ata
relationshipbetween pay
and
luck. First, Blanchard,Lopez-de-Silanes
and
Shleifer (1992) find that windfallgainsfrom
court rulings raise thepay
ofCEOs.
Second, as
we
just mentioned, the stock options that are granted toCEOs
are very rarely indexedto the market.
While
interesting, thesetwo
facts are only suggestive.A
court rulingmay
notbe
luck, but rather the result ofthe
CEO's
work.And,
as noted, while optionsmay
notbe
indexed(perhaps for simplicity or tax reasons), the
board
can always reissuethem
or adjust other parts ofpay.
For
many,
the apparent lack of relativeperformance
evaluation(RPE)
isprobably
the best existing piece ofevidence ofpay
for luck.*Even
with this evidence though,some
problems
arise.First,
mean
industrymovements
aiea
specialform
of luck. Filtering this specific kind ofluckmay
notbe
optimalfrom an
agency
theoretic point of view. In fact.Gibbons and
Murphy
(1990)themselves note that relative
performance
evaluationcan
distortCEO
incentives iftheycan
"takeactions that affect the average
output
of the reference group."^Aggarwal
and Samwick
(1999b)alsodevelop
a
specificmodel
inwhich
relativeperformance
evaluationschemes
may
notbe
optimcil*While Gibbons and Murphy(1990) findsomeevidenceforRPE, someof their resultsarepuzzling. Forexample, there appears to be more filtering of general stock market shocks than of shocks specificto the relevant industry.
Most ofthe otherwork on thetopic,suchasJanakiraman et al. (1992) andAggarwalandSajnwick (1999a), findno
evidenceof
RPE.
®They list four different kinds of such actions: sabotcige, collusion, choice of reference group and production
for shareholders aa they try to provide
CEOs
with
the best incentives.^"^Our
test addresses thesecriticisms.
We
willexamine
a variety of shocks, including but not restricted tomean
industrymovements.
We
willverify thatothershockstoperformance
that areeven
more
objectivelybeyond
managerial influence,
such
as shocks to theprice ofcrudeoil orexchange
rates shocks, also fail tobe
filtered.2.3
Empirical
Methodology
Within
theagency framework,
moat
ofthe empirical literature estimatesan
equation ofthe form:Vit
=
oii+
at+
ax
*^it+
P
*per
fit+
eu (2)where
yit denotes totalCEO
compensation
infirmi attime
t, a,- are firmfixed efi'ects, at aretime
fixed effects,
Xn
arefirm (andCEO)
specificvariables such as tenure or firm size,and
per
fitrep-resents
a
performance
measure.The
coefficient^
captures the strength ofthepay
forperformance
relationship.
Performance
istypicallymeasured
eitheraschangesinaccountingprofitsorstockmarket
returnsand
we
will xiseboth
measures.^* Inmeasuring compensation,
y^t,one
problem permeates
theliterature
and
our
paper
isno
exception. Ideally, thecompensation
ina
yearwould
include thechange
in valueofunexercised optionsgranted in previous years.Such
a
calculation requiresdata
on
theaccumulated
stock ofoptionsheldby
theCEO
eachyear,whereas
existingdata
contains onlyinformation
on
new
options grantedeach
year. Consequently,our compensation
measure
does notinclude this
component
ofthechange
in wealth.As
we
discuss in Section 3.2.1, thisdata
problem
'''The basic ideaisthattheniean performanceintherest ofthe industrymay
actuallyprovide someinformationabouttheCEO'seffortto attenuate orstrengthenthelevelofcompetition inthat industry. Forexample,ifproduct marketcompetition in an industry needs to besoftened, shcireholdersmight in anefficient contracting environment rewardthe
CEO
whentherest oftheindustry isdoingwell asthis mightindicatethat theCEO
actedsuccessfullyin attenuating the competitive pressures inthat industry.
"Theseareflowmeasures. In practice,given the firmfixedeffects,wewillusemarketvalueandlevelof accounting
should, ifanything, biasour resultstowards overstating the case towardsfiltering
and
understatingthe extent of
pay
for luck.To
estimate the general sensitivity ofpay
to performance,we
willfoUow
the literatiureand
estimate equation (2) using a standard
Ordinary
Least Squares(OLS)
model.To
estimate thesensitivity of
pay
to luck,we
need
to use amore
complicatedtwo
stage procedirre. In the first stage,we
will predictperformance
using luck.This
will isolate changes inperformance
that arecaused
by
luck. In the second stage,we
will seehow
sensitivepay
is to these predictable changesin performance. This
two
stageprocedure
is essentiallyaJi Instrumental Variables (IV) estimationwhere
the luck variable is the instrument for performance.^^Letting o
be
luck, the firstequationwe
estimate is:perfit
~
ai+at
+
ax
*X^ +
b *oa
+
en (4)where ou
represents the luckmeasure
(oil price for example). Again, this equation allows us topredict a firm's
performance
using only informationabout
luck.We
then askhow
pay
respondstothisluck induced performance, perf^^:
yu
=
ai+
at+
ax
*Xu +
PlucK *per
fit+
en (5)The
estimated coefficient pLj^ck indicateshow
sensitivepay
is to changesinperformance
thatcome
firom luck. Since
such
changes shouldbe
filtered, basicagency
theory predicts /3[,y,ck should equal0.
'^One might wonder
why
we should use this procedure rather than simply include o directly into the pay forperformanceequation (2) and run
OLS
to estimate:Vit
=
at+
at+
ax
*Xit+
*perfu+
7 o+
e<e (3)This equation ishardto interpret,however. Evenifthereis no payforluck, thecoefficient 7will not equal
—p
butrather —05, aswe can seefrom equation I. Sincewe wedonot estimate S, the estimatedcoefficient7 can besmall eitherbecause thereispayforluckorsimplybecause Sis small. ThefirstequationintheIVprocedure,on the other hand,scalestheeffectofluckonperformance, circumventingthis problem.
3
Testing
for
Pay
for
Luck
3.1
Oil
Industry
Study
We
now
tiimto theoilindustryto testwhether
infact there iszeropay
for luck.As
Figure 1 shows,the price of crude oil has fluctuated dramatically over the last 25 years.
These
large fluctuationshave
caused largemovements
in industry profits.Over
this period,a
CEO
ofone
of these firmswould have found
thata measurable
variable (oil prices) greatly influenced theperformance
ofhis firm. Moreover, these large fluctuations in
crude
oil prices are likely tohave
been
beyond
thecontrol of
a
singleUS
CEO.
For example, the sharp decline in crude oil price at theend
of 1985was
causedby
Saudi
Arabia'sdecision toreform itspetroleum
policyand
to increase itproduction,an
action hardly attributable(and
never attributed) to theCEOs
ofUS
oil firms. Similarly, thelargeoilpriceincrease
between
1979and
1981 is usually attributed toan
internalpolicychange
by
OPEC.
Oil pricemovements
therefore providean
ideal place to test forpay
for luck: they affectperformance, are
measurable
and
axe plausiblybeyond
the control oftheCEOs.
We
usea data
seton
thepay
and
performance
for the51 largestUS
oilcompanies between
1977and
1994 toimplement
themethodology
of the previous section.^^ Beforemoving
to regressionanalysis,it is useful to look directly at
how
pay
fluctuatescompared
to themovements
inFigm-e 1.InFigure2,
we
have
graphed
changes inoil prices for each yearand
changes
inmean
logpay
intheindustry.
Two
strikingfacts emerge. First,pay changes
cind oil pricechanges
correlate quite weU.In 12 ofthe 17years, they areofthe
same
sign:both
au^eup
orboth
aredown. This
issuggestiveofa
largeamount
ofpay
for luck.The
second factcomes
firom theremaining
5 yearswhere
they are'^We are extremely grateful to Michael Haid for making the data set used in this Bection available to us. See
Haid (1997) for further details about the construction of the data set. Tiible
Al
in the appendix providesmean
and standard deviationsfor themain variables ofinterest. Whiletheoriginal datasetcovers 51 companiesoverthe period1977 to 1994,informationon
CEO
payisavailable foronly 50 of theseoriginal 51 companies. Moreover,CEO
pay isavailablefrom 1977 onforonly 34 of these 50 companies. The finaldataset
we
use covers 827company/year observations.ofoppositesign: all these 5 years cire years in
which
oilpricedropsbut pay does
not.This
hints atan
asymmetry:
whileCEOs
are alwaysrewarded
forgood
luck, theymay
not alwaysbe
punishedfor
bad
luck.While
we
will not formallypursue
theasymmetry,
it isworth
keeping inmind.
This
figure, however, does not allowus toquantify thesize ofpay
for luck:how
does itcompare
to the
pay
for general performance? It also does not control for other firm specific variables thatmight
be
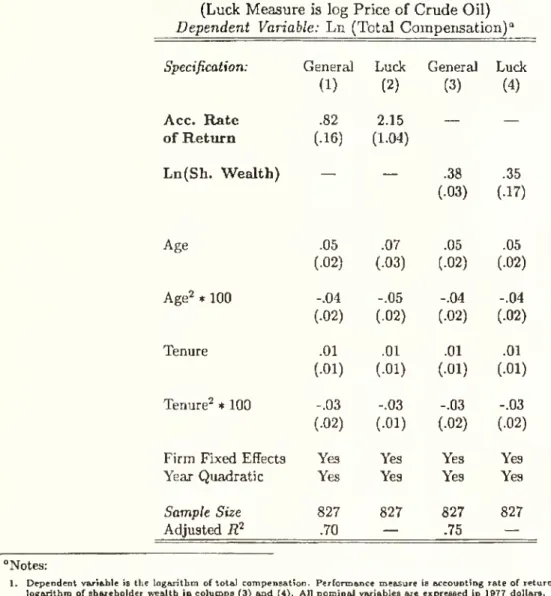
changing over time. Table 1 follows the empiricalmethodology
presented in Section 2.3,which
allowsamore
systematic analysis.The
regressionsuselog(totalcompensation)
asdependent
variable
and
include firm fixed effects, ageand
tenure quadraticsand
a performance
measure
asdependent
variables.*'*We
also allow for a year quadratic to allow for the fact thatCEO
pay
has
been
trendingup
duringthis period.Column
(1) estimates the sensitivity ofpay
to a generalchange in accounting performance.
The
coefficient of .82 suggests that ifan
oil firm increases itsaccounting return
by
one
percentage point, totalcompensation
risesby
.82 * .01=
.0082«
1 logpoints. Roughly, a
one
percentage pointincreaseinaccountingreturns leads toa
.8percentincreaseinpay.
Note
that the signand
magnitude
ofallthe othercovariates in theregressionseem
sensible.Pay
increases with ageand
to a lesser extent with teniu-e.Both
the ageand
tenure profile areconcave (the negative coefficient
on
the quadratic term).Colimin
(2)estimatesthesensitivityofpay
toluck.As
described,we
instrumentforperformance
withlog oil prices.'^
This
aUows
us tonarrow
down
on
movements
in accounting returns that aredue
to oil price changes.The
coefficient incolumn
(2)now
rises to 2.15.This
suggest thata one
percentage point rise inaccoimting returns
due
to luckraisespay
by
2.15 percent.Given
the largestandcird errors, one cannot reject that the
pay
forluckcoefficientand
pay
forgeneralperformance
coefficient are the Scune.
One
can
however
strictly reject the hypothesis ofcomplete
filtering: oil '"Tbtal compensation in this table and all others includessalary, bonus, other incentive payments and value of options grantedinthat year."This table does not report the first stage regressions ofperformance measure on oil price. But as one would
CEOs
are paid for luck thatcomes
from
oil pricemovements.
Columna
(3)and
(4)perform
the Scune exercise but for amarket
measure
of performance:shareholder wealth.
The
coeflBcient of .38on column
(3) suggests thata one
percent increase inshareholder wealthleads to roughly
a
.38 percent increase inCEO
pay. Incolumn
(4),we
find thata one
percent increasein shareholder wealthdue
to luck leads to .35 percent increase inCEO
pay.Again,
pay
for luckmatches
pay
for general performance.3.2
More
General
Tests
The
oil industry case study hasbeen
instructiveabout
themagnitude
ofpay
for luck.CEO
pay
responds as
much
toa
lucky dollarthan
to ageneralperformance
dollar.This
is onlyone
industry,however,
and
one might
askhow
generalizable these results are. In this section,we
willexamine
luck shocks that affect
a
broader set of firms.We
focuson two measures
ofluck:movements
inexchange
ratesand
mean
industry performance.By
affecting the extent ofimport
penetrationand
hence
foreign competition,exchange
ratemovements
can
strongly affecta
firm's profitabihty.Movements
inmean
industryperformance
alsoproxy
for luck to the extent thata
CEO
does notinfluence
how
the rest of her industry performs.^^3.2.1
CEO
Compensation
Data
To
implement
these tests,we
usecompensation
dataon
792 large corporations over the1984-1991 period.
The
data
setwas
graciouslymade
available to usby
David
Yermack and
Andrei
Shlerfer. It is extensively described inYermack
(1995).Compensation
data was
collectedfrom
the corporations'
SEC
Proxy, 10-K,cmd 8-K
filings.Other data
was
transcribedfrom
the Forbesmagazine annual
survey ofCEO
compensation
as well asfrom
SEC
Registrationstatements, firms'As we mention before, this \ast assumption is more questionable. In practice,
we
find thatmean
industryAnnual
Reports, directcorrespondencewith
firms, press reports ofCEO
hiresand
departures,and
stock prices
pubhshed
by Standard
&
Poor's.Firms
were selected into thesample
on
the basisof their Forbes rankings. Forbes
magazine
publishes annual rcinkings of the top500
firmaon
fourdimensions: sales, profits, assets
and
market
value.To
qualify for thesample
a corporationmust
appear
inone
of these Forbes 500 rankings at least four timesbetween
1984and
1991. In addition,the corporation
must have been
publicly traded forfour consecutive yearsbetween
1984and
1991.Yermack
data is attractive in that it providesboth governance
variablesand
informationon
options granted, not just information
on
options exercised. It does not, however, include changesin the valueofoptions held.
Our
compensation
measure, therefore,wiU
not include thechange
invalueof pre-existing options. Ifanything, this biases us towardsfinding less
pay
forluck than thereis. Since options are not indexed, changes in the value ofoptions held
wUl
covary perfectlywith
luck. Including
them
would
onlyincrease themeasured pay
for luck.This data
limitationthereforepushes us towards favoring the filtering hypothesis,
making
our statistical rejection ofcomplete
filtering that
much
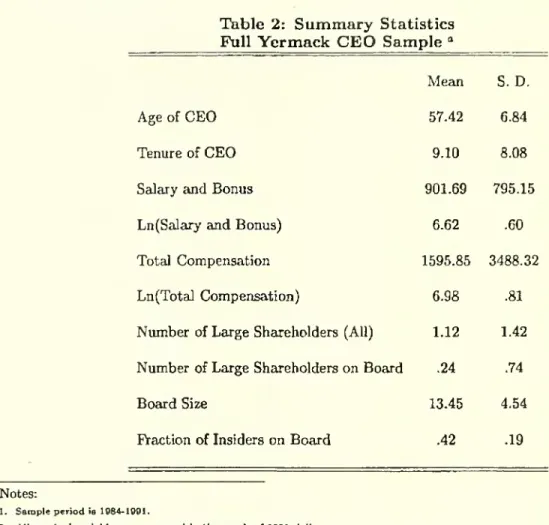
stronger.Tkble
2 presentssummary
statisticsforthemain
variablesofinterest inthefullYermack
data.^'^All
nominal
variables are expressed in 1991 dollars.The
averageCEO
earns 900thousand
dollars insalaryand
bonus. His totalcompensation
is nearly twice thatamount
atone
millionand
600thousand
dollars.The
differenceindicatesthelarge fraction ofa
CEO's
pay
thataredue
tooptionsgrants.
The
averageCEO
is roughly57
years oldand
hasbeen
CEO
ofthe firm for 9 yccirs.As
far asgovernance
goes, the average firm in oursample
has 1.12 large shareholders, ofwhich
lessthan a
fourth are sittingon
the board.There
cireon
average 13 directorson
a board. 42 percentof
them
are insiders.^®'''in practice,depending onthe requiredregressors, the varioustestsin thefollowing sectionswillbe performed on
various subsamplesoftheoriginal data. None of these main variables of interest significantly differ in any ofthese subsamples.
3.2.2
Exchange
Rate
Movements
asMeasures
of
Luck
Our
first generalmeasure
of luck focuseson
exchange
ratemovements.
We
exploit the fact thatexchange rates
between
theUS
dollarand
othercountry currencies fluctuate greatlyover time.We
alsoexploit thefact that different industries are affected
by
different countries'exchange
rates. Forexample,sincethetoy industry
may
be
more
affectedby Japanese
imports while thelumber
industrymay
be
more
affectedby
Bolivia, thesetwo
industriesmay
experience very different shocks in thesame
yeax.This
allows us to construct industry-specificexchange
ratemovements
which
we
arearguably
beyond
CEOs'
control since they are primarilydetermined by
macroeconomic
variables.The
exchange
rate shockmeasure
isbased
on
the weighted average ofthe log realexchange
ratesfor
importing
countriesby
industry.The
weights are theshare of each foreign country'simport
intotal industry
imports
in abase year (1981-1982).Real
exchange
rates arenominal exchange
rates(expressedin foreigncurrency perdollar) multiplied
by
U.S.CPI
and
dividedby
theforeigncountryCPI.
Nominal
exchange
ratesand
foreignCPI's
arefrom
the International FinanciaJ Statistics ofthe International
Monetary
Fund.
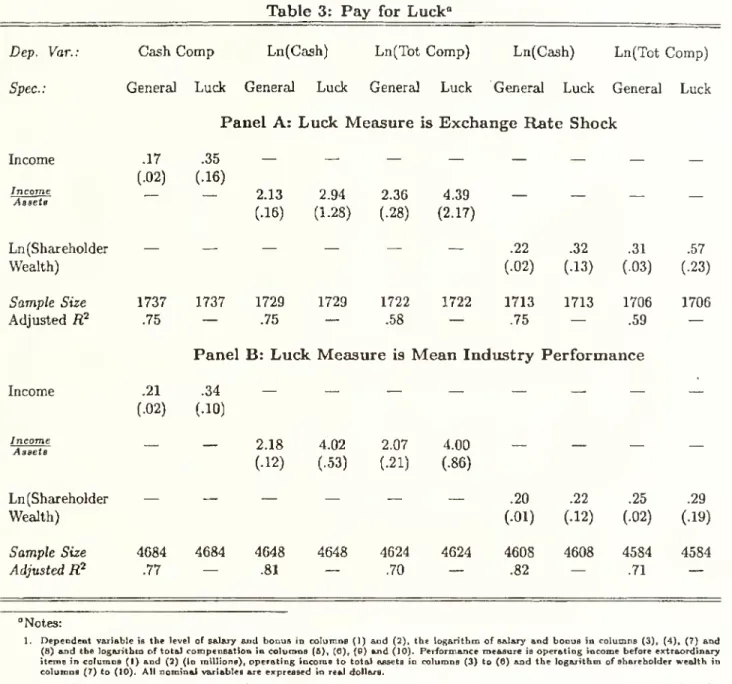
Panel
A
ofTable
3examines
the effect of thismeasure
of luck.Note
that since theexchange
rate
measure can
onlybe
constructed for industrieswhere
we
have imports
data, thesample
sizeis
much
smallerherethan
forour
fullsample. All regressions controlfor firmand
yearfixed effectsas well as for quadratics in tenure
and
age.^^Column
(1) uses asdependent
variable the level(not the log) of cash (not total) compensation.
Thus,
relative toour standard
specification,we
run
this regressionin levelsand do
not includeVcilue ofoptions granted. Sinceprofitsarereportedin millions
and
pay
is reported in thousands, the coefficient of .17 incolmnn
(1) suggests that thatisa currentorformerofRcer ofthecompany.A
greydirectorisarelativeofacorporateofficer, orsomeonewho
hassubstantial businessrelationshipswiththe company.'*We do not report thecoefficientson age Jind tenureto savespace, butthey resemble theoil indxjstry findings: positivebutdiminishingeffectsoftenureand age.
SI,
000
increasein profitsleads toa
17 cent increase in performance.Column
(2) performs thesame
exercisebut
now
forpay
forluck:we
instrument forperformance
using theexchange
rateshocks.^'^As
in the oil case,we
finda
pay
for luck coefficient that is ofthesame
orderofmagnitude
as thepay
for generalperformance
coefficient.Columns
(3)through
(6)run
themore
standard regressionwhere
we
use the logarithm ofpay
and an
accountingmeasure
ofperformance
(operatingincome
dividedby
total assets). Incolumns
(3) BJid (4)
we
use only cash compensation, whileincolumns
(5)and
(6)we
usetotalcompensation.In
both
cases,we
find the sensitivity ofpay
to luck tobe
about
thesame
as the sensitivity ofpay
to a general shock.
When
accountingperformance
risesby
one
percentage pointcompensation
(either total or cash) rises
by about
2 percent,whether
that risewas
due
toluck—
exchange
ratemovements
—
or not.Colmnns
(7)through
(9) replicate these foiir colimansbut
formarket measures
ofperformance.Again,
we
findpay
for luckthatmatches
thepay
sensitivitytoa
generalshock.A
riseinshareholderwealth of
one
percentleads toa
riseinpay
(again either total or cash) ofabout
.3percentirrespectiveof
whether
this risewas
causedby
luck.Two
importantpoints shouldbe
takenaway
from
thispanel. First, toa
firstapproximation, theaverage firm rewards its
CEO
asmuch
for luck as itdoes
for a generaJmovement
in performance.There seems
tobe
verylittle ifany
filtering. Sincewe
use a totally different shock, these findingsaddresstheoreticalconcerns
about
the useofmean
industryshocks (suchasthoseraised inGibbons
and
Murphy
(1990)and
Aggaxwal and
Samwick
(1999b))and
shows
that the lack of filteringobserved in
RPE
findings generalizes to other sources ofluck.Second, there is as
much
pay
for luckon
totally discretionarycomponents
ofpay
(salaryjmd
^''Firststageregressionsarereportedin'RibleA2. In practice
we
use as instrumentsasetofdummy
variablesthat indicate any significantexchangerateappreciations ordepreciations in the currentand past year. The instruments arejointlyhighly significant.bonus) as there is
on
othercomponents
such as options granted.This
rules out the notion thatpay
for luckmight
arise because firmscommit
(implicitly or explicitly) to multi-year stock optionplans
where
thenumber
ofoptions grants is fixedahead
oftime.As
firm vaJues rise, the prices ofoptionsrise
and
so does the value of options grants (Hall, 1999).More
generally,bonus
is themost
subjective
component
ofpay
forperformance
sensitivity.To
findpay
forluckon
thiscomponent
isquite suggestive.
Boards
are rewardingCEOs
for luckeven
when
they could filterit.3.2.3
Mean
Industry
Movements
as
Measures
of
Luck
In Panel
B
ofTable 3,we
replicatePanel
A
except that ourmeasure
ofluckbecomes
mean
perfor-mance
of the industry,which
ismeant
to capture external shocks that are experiencedby
all thefirms in the industry.
More
specifically, asan
instrument for firm-level rate ofaccounting returnin a given year,
we
use the weighted average rate ofaccounting return in that year in the 2-digitindustrythatfirmbelongs to, excluding thefirmitself
from
the calculation.^^The
weightofa
givenfirmin
a
given year is theshare ofitstotal assets in the "total" total assets ofthe 2-digit industrythe firm belongs to. Similarly, as
an
instrument for firm-level logarithm of shareholder wealth ina
given year,we
use the weighted average of the log values ofshareholder wealth in the 2-digitindustryin that year, again excluding the firm itself
from
thecalculationand
using total assets toweight each individualfirra.^^
Like in Panel A, all regressions includefirm fixed eflFects
and
year fixed efiects.We
also controlfor a quadratic in
CEO
ageand
a
quadratic inCEO
tenure.The
regressions includemore
than
twice the
data
points ofPainelA
because
we
can
now
use all firms, not only those in the traded'*
We
also investigatedthe useof 1-digit and3-digltindustrymeansasinstrumentsandfoundqualitcitivelysimilar
results.
'^These mean industry performance measures are constructed from
COMPUSTAT.
To maximizeconsistency of theperformancemeasuresbetweenYermaclc'sfirmsandtherestof industry,we
alsocomputeshareholderwealthand incometo assets ratiosfromCOMPUSTAT
for the firmsinYermack's. Because notallfirms in Yermack'sdata aie presentinCOMPUSTAT
in everyyear, weloseabout 800 firm-yearobservations.goods
sector. PanelB
shows
a pattern quite similar to Panel A.The
pay
for luck relationship inall specifications again roughly
matches
thepay
for general performance. Besides reinforcing thefindings of Panel A, these latest findings suggest that previous
RPE
results arose probably notbecause of
miameasurement
ofthe reference industryor ofthe industryshockbut
because of truepay
for luck.3.2.4
Could
Pay
forLuck
Be
Optimal?
Sincethe resultsso far clearlyestablish
pay
for luck ora
lackofperformance
filtering, it is naturaltoask
whether pay
for luck could infactbe
optimal.Are
therecomplicationstothe agencymodel
that
would
generatepay
for luck inan
optimal
contract?We
could think ofat least three.First,
we
have
assumed
thato
is contractible. Ifocannotbe
contractedupon
ormeasured
well,the empiricaltesta developed in section 2.3 are
no
longer valid. In practice,we do
not believe thisis
important
formost
ofourfindings. First,it is difficultto believethat non-contractingissuescan
explain
our
resultsintheoU
industrycase study: theprice ofcrudeoilcan
easilybe measured
ajidwritten into a contract. Second, even inthe presenceof non-contractibility, subjective
performance
evaluationshould efl'ectively filter (seeBaker,
Gibbons and
Murphy,
1994).The
onlyproblem with
subjective
performance
evaluation relates tocommitment
issues,but
these are unlikely tobe
a
problem
for theboards
of directors ofthe large firmswe
study
here.Second,
we
have
neglected the possibility of indirect incentivesone
may
want
to provideto theCEO,
forexample
to forecast,respond
to, orhedge
against luck.^^This
kind ofargument can
be
most
readilyevaluated in ouroil industryapplication.Suppose
aparticularlytalentedCEO
in theoil industry
understood
the political subtleties oftheArab
countriesand
forecastedthecoming
of^'
An
argumentsimilar tohedging hasbeenmade
byDiamond
(1998). Tying paytoluckmay
generateincentives for theCEO
tochangehiscorrelationwith the luckvariable. In practice, diversificationwouldseem tobeintheinterestofmanagementandnotsheixeholders. Tiifano (1996),forexample,demonstratesthat managerialcharacteristics,such
the positive oil shock at the beginning of the 1980's.
By
increasingoutput from
existing oil wells,increasing inventories, or intensifyingsearchfor
new
wells, he couldhave
increased hisfirm's profitswhen
theshock
didcome.
Shouldn't shareholdersreward
thisfarsightedCEO?
The
important
pointhereis that those
CEOs
who
were
exceptionalinhaving
forecasted should indeedbe
rewarded.But
thisis not
what
we
testfor.We
usenone
ofthe firm to firm variation in responseto the oil shock.We
merely testwhether
the average firm experiences arise (orfall, for the negative shocks) in pay.Put
another
way, our results suggest thata
CEO
who
responds to theshock
exactly thesame
way
as every other oil
CEO
is rewarded.This
cannotbe
areward
forhaving
forecasted well. Again,one
may
want
toreward
CEOs
for exceptional responsiveness to shocks,but
there is little reasonto
reward
them
forjust average responsiveness.Third, the reservation utility ofthe
CEO
couldbe
affectedby
therandom
factor o.When
theoil industry enjoys
good
fortune, thehuman
capitalofoilCEOs
may
simply
become more
valuable.Firms then
pay
their oilCEOs
more
simply
tomatch
their increased outside options. Thus,pay
for luck is optimal here not as
an
incentive device, butmerely
becatise theoptimal
level ofpay
increases
with
luck.Some
objectionscan
be
raisedagainst thisview
aswell. First, it isunclearwhy
CEO
human
capitalshouldbecome
more
valuableasindustryfortunes rise. Forexample, itmay
be
exactlyin
bad
times thathaving
therightCEO
ismost
valuable.A
priori,eitherrelationshipseems
plausible. Second,
we
have found
some
evidence ofasjonmetries in the pay-for-luck relationship that arehard
to reconcilewith
thatview
(and easy to reconcilewith a
skimming
view)."Good
luck"
seems
tomatter
more
than
"bad
luck".For
example, averageCEO
compensation
in the oilindustry always goes
up when
the priceof crude oilgoesup
but
does not alwaj^ godown when
theprice of
crude
oil goesdown.
Also,when we
separate positiveand
negativemean
industry shocks,(whilethere are
no asymmetries
in the sensitivityofpay
to individual firm performance).^^Finally,
one might
argue thatpay
for luck is aform
ofrisksharingbetween
CEOs
ajidfirms. Iffirms are effectively risk averse,
perhaps
because of liquidity constraints, theymay
want
to sharesome
ofthe risks they facewith
theirCEO.
This
argument
is best evaluated in the context ofouroil industry study. It is
hard
to imaginewhy
the large oil producerswe
study,which
are usuallyawash
incashand
haveexcellentbond
ratings (perhapsbecause
largeholdingsofpledgeableassets),would need
to shareriskwith
theCEO.
Even
ifthese firmsneeded
to lay offrisk, theycan
readilytake futures positionsin oil
which would
allowthem
to shaxe theriskwith
amarket
better able totake
on
theriskthan
theCEO.
Similarly,exchange
rate futuresmarkets
areactive.Of
course,one
could argue that for
mean
industrymovements
futuresmarkets
may
notbe
as readily available.But
this explanationwould
then only apply to this third luck measure,whereas
our results holdsimilarly forall the measures.
While
we
have
providedarguments
against these variousextensions ofthesimpleagency
model,in the
end
we
stiU believe that they merit serious consideration.They
suggest to us that thepay
for luck findingdoes not per se ruleoutagency
models.We
dealwith
this issueby examining
how
corporategovernance affects
CEO
pay.3.3
The
Effect
of
Governance
The
skimming
view
makes a
further prediction. Since itemphasizes
theCEOs'
ability to gaincontrol ofthe
pay
process, corporate governance should playan
important
role inskimming.
It isexactly in the poorlygoverned firms
where
we
expectCEOs
tomost
easilygain control of thepay
process. This suggests that
we
should expectmore
pay
for luck in the poorlygoverned
firms.To
examine
how
pay
for luck differsbetween
welland
poorly governed firms,we
estimatetwo
'*Theseresults, notdirectlyreported here,aieavailableuponrequestfrom the authors. They holdquitestrongly
equations. First, in order toprovide
a
baseline,we
askhow
pay
forgeneralperformance
(not luck)differs
between
welland
poorly governed firms.We
estimatean
OLS
equation similar to equation(2) except that
we
allow thepay
forperformance
coefficient todepend
on
governance:Vit
=
ai+
at+
ax
*Xu
+
ao
*Govu
+
0*
perfu
+
7
*{Govu
*perfu}+
eu (6)where
Govu
is ameasure
ofgovernance.To
xmderstand
this equation,differentiateboth
sideswithrespect to perfu:
dperfit
The
sensitivity ofCEO
pay
toperformance depends on
thegovernance
variable.A
positive valuefor
7
would imply
that bettergoverned
firmsshow
greaterpay
for performance.Equation
(6) ofcourse tells usnothing about
pay
for luck,merely about pay
for performance.To
get atpay
for luck,we
re-estimate this equation using ourtwo
stage instrumental Vcuriablesprocediire.'^
We
then
compute
an
estimate of the effect ofgovernance
on
pay
for generalperfor-mance,
7
and
an
estimate ofthe effect ofgovernance
on
pay
for luck,^luck-Oiu- test
then
consists incomparing
7
and
jLuck-We
willspeak
ofmore
pay
for luck inpoorlygoverned firms
when
poorly governed firms displaymore pay
for luck relative topay
for generalperformance. Ifpoorly
governed
firmssimply gavemore pay
forperformance
and pay
for luck roseas
a
consequence,we
would
not refer to this asmore
pay
for luck. In practice,we
willsee that itis
pay
for luck that changeswith
governance, whilepay
forperformance
hardly changes.^"'Anextremelyimportantcaveathere: our approcich allowsforthepossibilitythat bettergovernedfirms
may
have adifferentresponsivenessofperformancetoluck. Technically, performance perfa, theendogenous variable we needtoinstrument,appearsbothdirectly andindirectly (theterm Govit*perfu) in this equation. ^Vhenwe instrument,
we perform two first stages, one for the direct effect perfu and one for the interaction term GotHt*ptrfu- This
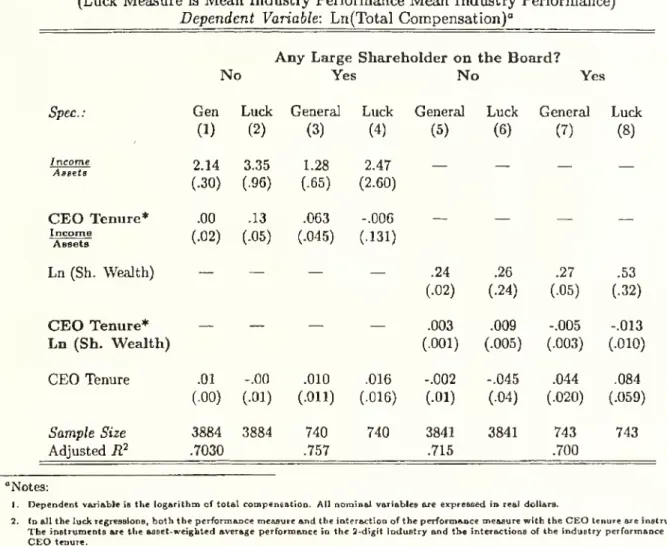
3.3.1
Large
Shareholders
In Table 4,
we
implement
thisframework
for the case of large shareholders.We
askwhether
thepresenceof large shareholdersaffects
pay
for luck. Shleiferand Vishny
(1986),among
others, arguethat large shareholders
improve
governance ina
firm.A
single investorwho
holds alarge block of shares ina
firm willhave
greater incentives towatch
over the firmthan
a dispersedgroup
ofsmallshareholders.'^ In our context, the idea oflarge shareholders fits
most
naturally as thismatches
our intiiition of "having a principal around."
Yermack
data
contains a variablewhich
counts thenimiber of individuals
who
own
blocks of at least 5 percent of the firm'scommon
shares.^^We
further
know
whether
these large shareholdersareon
theboard
or not.A
priori,one might
expectthat large shareholders
on
theboard have
the greatestimpact.They
can
exert their controlnotjustthrough
implicitpressureor voting, but alsowith
adirectvoiceon
thebocird. Sincetheinformationis available,
we
willconsider theeffectofboth
alllarge shareholdersand
of onlythoseon
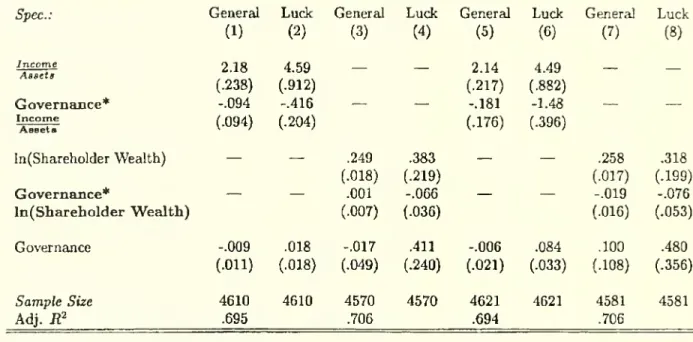
theboard.The
first fourcolumns
of T^ble 4 useaU
large shareholders as ourmeasure
of governance.AU
regressions include the usual controls.Column
(1) estimateshow
the sensitivity ofpay
toperformance
depends
on governance
for accountingmeasures
ofperformance.The
firstrow
tellsus that afirmwithno
large shareholdersshows
asensitivityof logcompensation
toaccounting returnof 2.18.
An
increase in accounting return ofone
percentage point leads toan
increase inpay
ofabout two
percent.The
second
row
tells usthatadding a
large shareholder onlyweakly
decreasesthe sensitivity of
pay
to general performance,and
this effect is not statisticadly significant. Forexample,
a one
percentage pointincrease inaccounting retm^inow
leads to a2.09 percent increasein
pay
when
the fixm hasone
large shareholderand
nota
2.18 percent increase in pay.Colmnn
They alsopointout apossibleoppositeeffect: verylargeshareholders
may
have agreater ability toexpropriate rentsfor thenaselves. This effectislikely tobegreatest in othercountrieswhere investorprotectionisweakest.(2) estimates
how
large shareholders affectpay
for luck.^As
before, the firstrow
tells us thatthere is significant
pay
for luck.The
secondrow
here tells \is, however, that thispay
for luckdiminishes significantly inthe presence of a large shareholder.
A
one
percentage point increase inaccounting returns
due
to luck leads to roughly a4.6 percent increaseinpay
when
there isno
largeshareholder but only a 4.2 percent increase in
pay
when
thereisone
more
largeshareholder.Each
additional large shareholder decreases this effect
by
.4 percent.This
is a10%
drop
in thepay
forluck coefficient foreach additional large shareholder.
,/;
Columns
(3)and
(4) estimate thesame
regressions usingmarket measures
of performance.In this case, the
pay
for generalperformance
does notdepend
at aJlon
the existence of a largeshareholder (a coefficient of .001 with a
standard
errorof.007).We
again find, however, thatpay
for luck diminishes
with
the presence ofa
large shareholder.WhUe
the result is only significant atthe
10%
level, theeconomic
magnitude
islarger.The
pay
for luck coefficientnow
drops^
«
17%
for each large shareholder.
In
columns
(5)through
{8)we
repeat theabove
exercisebut
altering thegovernance
measure.We
now
focus onlyon
large shareholderson
the board.Comparing
columns
(6)and
(2),we
see that the
governance
effect strengthens significantlywith
respect to the filtering ofaccountingperformance.
We
see thatthepay
forluckdrops by
33 percentforeachadditional large shareholder.The
results are very statistically significant.On
market performance
measures,we
find the effect also risesbut
less dramatically. Incolumn
(8), thepay
for luck drops 23 percentwith each
largeshareholder
on
the board. Moreover, this last result is insignificant. Insummary,
our findings inTable 4 highlight
how
large shareholders (especially thoseon
the board) affect the extent ofpay
forluck.
Firms with
more
large shareholdersshow
farlesspay
for luck.*In all that follows, we will usemean industry performanceasotirmeasureofluck since this produces themost
3.3.2
Entrenchment and
Large Shareholders
The
results in Table4 simplycompare
firmswith
largeshareholders to firms without. Thisignoresthe effects of
CEO
tenure, anotherimportant determinant
of governance.A
common
beliefis thatCEOs
who
havebeen with
the firm longerhave
had
a chance tobecome
entrenched, perhapsby
appointing friends
on
the board. In this case,we
woxild expect high tenureCEOs
toshow
thegreatest
pay
for luck. Moreover,we
would
expect this effect tobe
strongest in those firmswhere
governance is
weak
and
thereisno
large shareholder present to limit the increased entrenchment.Hence, in the absence of large shareholders,
we
expect fairly stronggovernance
early in aCEO's
tenure but this
governance
shouldweaken
overtime
as he entrenches himself. In the presence oflarge shareholders,
we
not only expect stronger governcince but aJso that this strongergovernanceshoiddlast
throughout
theCEO's
tenure. It is harderfor aCEO
to begin stacking theboard
when
thereis
a
largeshareholder aroimd.Thus
we
expect ariseinpay
forluckwith
tenureintheabsenceofalarge shareholder,
but
lessof a rise (oreven
no
rise) in the presence ofa
large shareholder.T^ble 5 tests this idea.
We
first sort firms intotwo
groupsbased on whether
theyhave
alargeshareholder present
on
the board.^^This
produces 740 or sodata
points forfirms with largeshareholders
and 3880
or sodata
pointsfor firmswithout
large shareholders. For each set,we
now
separatelyestimate regression 6 for these
two
groupswith
tenureasour governance
measure.Columns
(1)and
(2) focuson
accountingmeasures
ofperformance
in firms without a largeshareholder.
The
secondrow
tells us that while tenure does not affectpay
for performance, itgreatly increases
pay
for luck. In fact, aCEO
with
(roughly) themedian
teniure of 9 yearsshows
about
^5^
w
35%
greaterpay
for luckthan one
who
justbegan
at the firm. Let us contrast thiswith