Advanced Design Concepts for PWR and BWR High-Performance Annular Fuel Assemblies
by
Tyler Shawn Ellis
Submitted to the Department of Nuclear Science and Engineering in partial fulfillment of the requirements for the degrees of
BACHELOR OF SCIENCE and
MASTER OF SCIENCE in
Nuclear Science and Engineering at the
Massachusetts Institute of Technology June 2006
© 2006 Massachusetts Institute of Technology All rights reserved
Signature of Author:
Certified by:
Department ofLuclear Science and Engineering June 9h, 2006
U. Professor M jid, . Kazimi (Thesis Supervisor) TEPCO Professor ofllear Science and Engineering
Dr. Pavel Hejzlar (TAesis Reader)
P
AWrincipal Research Scientist Accepted by:
Professor Jeffrey A. Coderre Chairman, Department Committee on Graduate Students
MASSACHUSETTS INSTITUTE OF TECHNOLOGY
OCT
12 2007
LIBRARIES
ARCHIVES
- --~I '--. ,,Advanced Design Concepts for PWR and BWR High-Performance Annular Fuel Assemblies
by
Tyler Shawn Ellis
Submitted to the Department of Nuclear Science and Engineering
on June 9th, 2006, in partial fulfillment of the requirements for the degrees of
Bachelor of Science and
Master of Science
Abstract
Sobering electricity supply and demand projections, coupled with the current volatility of energy prices, have underscored the seriousness of the challenges which lay ahead for the utility industry. This research addresses the impending global need for electricity through the
development of advanced annular fuel designs with both internal and external cooling which can achieve higher power densities and hence, higher electricity output from the same basic reactor vessel and containment. Therefore the objectives of this project are to determine the optimal geometrical design parameters of an annular fuel assembly for both PWRs and BWRs for the purpose of achieving maximum power density. It is theorized that utility companies can utilize this design through either retrofitting of their existing reactor facilities or incorporation of the fuel design into new plant concepts.
For the case of annular fuel for PWRs, a high performance uranium nitride fuel assembly concept capable of achieving a 50% higher power density was successfully developed. It is shown that a 5% enriched UN annular-fuel assembly can operate at 150% power density for about 50 effective-full-power-days more than that of the nominal 17xl7 solid-fuel-pin assembly operating at 100% power density. Furthermore, neutronic simulation times of this assembly was reduced from approximately 2 days per simulation for a Monte Carlo based analysis to
approximately 2 minutes for a deterministic based simulation via the development of an
appropriate correction factor for the CASMO-4 neutron transport code. It was shown that a 25% increase in U238 number density for the un-poisoned pins and a 35% increase for the 10 weight
percent gadolinium nitride poisoned pins produced the optimal plutonium tracking and infinite multiplication factor simulation. Finally, the 13x13 annular fuel assembly was shown to have a smaller reactivity swing over the fuel lifetime. Thus it was concluded that an annular uranium nitride assembly at 150% power density can be designed for PWRs so as not to require
enrichments above 5% in order to reach the desirable cycle length of 18 months.
For the case of annular fuel for BWRs, thermal hydraulic simulations were carried out for a 9x9 solid fuel reference assembly and three different annular assemblies with 5x5, 6x6 and 7x7
fuel pin geometries. Prior research had utilized the Hench-Gillis CPR correlation for all thermal hydraulic simulations and determined that as much as an 11% uprate for 5x5 annular geometries and an 18% uprate for 6x6 annular geometries might be achievable. However, since Hench-Gillis uses bundle average conditions for its calculations, it was theorized that this treatment was not appropriate for annular fuel. A benchmarking analysis against experimental critical power data for a 9x9 assembly confirmed this is a more appropriate heat balance correlation, the EPRI-1 Reddy Fighetti, which was adopted in our simulation of the critical power using the subchannel analysis code VIPRE. Several different strategies were pursued in order to improve the minimum critical heat flux ratio of the three different annular fuel assemblies including optimization of the fuel pin dimensions, fuel pin gap, and orifice loss coefficients. However it was concluded that annular fuel is not a promising strategy for increasing the power density. This can be due to the fact that the CHFR margin gained from the increase in heat transfer surface area is being lost due to the need for increased flow velocity, which retards the CHF for BWR conditions. This is exacerbated by the inability for the coolant in the inner channels to mix with the surrounding subchannels.
Thesis Supervisor: Mujid S. Kazimi
TEPCO Professor of Nuclear Science and Engineering Director, Center for Advanced Nuclear Energy Systems
Acknowledgements
First and foremost I'd like to thank those most directly responsible for my ability to complete this thesis, Professor Mujid Kazimi and Dr. Pavel Hejzlar. Their constant guidance and inspiration throughout the years have been invaluable for my educational upbringing.
I also truly appreciate the untiring support from Dr. Zhiwen Xu, Chris Handwerk and Mike Pope. Their aid on codes, computing and the finer points of being a graduate student has made my tenure here infinitely easier.
Last, but certainly not least, I'd like to express my gratitude for the endless love and support from my family back home in South Dakota. Randy, Carol, Laura-Bean, Chance and Riley, I'm not sure I could have finished this 5 year roller coater ride without you all.
Financial support for this work was provided for by the MIT Center for Advanced Nuclear Energy Systems and the Tokyo Electric Power Company.
Table of Contents A bstract ... 1 Acknowledgements... 3 Table of Contents ... 5 List of Figures ... 7 List of Tables ... 9 List of Acronyms ... 10 1. Introduction... 12
1.1. Societal Need for Safe and Economic Nuclear Power... ... 12
1.2. Review of Previous Work on Annular Fuel for Reactor Applications ... 15
1.3. Objective of This W ork ... ... 20
1.4. Organization of the Thesis ... 21
2. Uranium Nitride Annular Fuel for PWR Applications ... ... 23
2.1. M ethodology ... 23
2.2. A nalysis Tools ... 24
2.2.1. M C O D E ... 24
2.2.2. CA SM O -4 ... ... 26
2.3. Description of Geometries Analyzed... ... ... 31
2.4. Benchm ark A nalysis ... ... 32
2.4.1. MCODE/CASMO-4 Comparison... 32
2.4.2. CASMO-4 Pseudo-Solution for Annular Fuel... ... 36
2.5. Poison-free Pin Cell Correction ... 37
2.6. Poisoned Pin Cell Correction... 41
2.6.1. Self-shielding Factor Correction... ... ... 42
2.6.2. Multiplication Factor Tracking with Burnup... ... 43
2.6.3. Gadolinium Tracking with Burnup ... ... 45
2.6.4. Plutonium Tracking with Burnup ... ... 47
2.7. Correction for Fully Poisoned Assembly... ... ... 48
2.7.1. Multiplication Factor Tracking with Burnup... 49
2.7.2. Plutonium Tracking with Burnup ... ... ... 50
2.8. Final Uprated Design Comparison... 51
3. Investigation of Annular Fuel for BWR Applications ... ... 54
3.1. M ethodology ... 54
3.2. Analysis Tools: VIPRE Thermal Hydraulics Code ... ... . 55
3.2.1. Flow M odeling... 56
3.2.2. Heat Transfer Correlations... 57
3.2.3. CH FR Correlations ... ... 58
3.2.4. CHFR/CPR Comparative Analysis... 61
3.3. Fuel A ssem bly M odels ... 68
3.3.1. Solid Fuel 9x9 Reference Assembly... 68
3.3.2. Annular Fuel Assembly Design Option Space ... 73
3.3.3. Annular 5x5 Fuel Assembly ... 75
3.3.4. Annular 6x6 Fuel Assembly ... 78
3.3.5. Annular 7x7 Fuel Assembly ... 81
3.4.1. Annular 5x5 Fuel Assembly ... 85
3.4.2. Annular 6x6 Fuel Assembly ... 88
3.4.3. Annular 7x7 Fuel Assembly ... 92
3.4.4. Comparison of Optimal Designs... 96
3.4.5. Analysis of the Results... ... 97
4. Summary of Conclusions and Recommendations for Future Studies ... 101
4.1. C onclusions ... 101
4.2. Recommendations for Future Studies ... 103
References... 105
Appendix A: CASMO-4 Operational Parameters for Reactivity Coefficient Calculation ... 108
Appendix B: VIPRE Input Files ... 111
B. 1 GE 9x9 BWR Assembly Reference ... ... 111
B.2 Annular 5x5 BWR Assembly... 117
B.3 Annular 6x6 BWR Assembly... 122
B.4 Annular 7x7 BWR Assembly... 129
Appendix C: CASMO-4 Input Files ... 137
C.1 Westinghouse 17x17 PWR Assembly Reference ... 137
C.2 Annular 13x13 PWR Assembly ... 138
Appendix D: MCODE/MCNP Input Files ... 140
D.1 Westinghouse 17xl7 PWR Reference ... 140
List of Figures
Figure 1-1: US Electricity Consumption Projection [EIA] _--..._ . _ --- -13
Figure 1-2: Temperature Dependence of Thermal Conductivity for UN-. ...--- 17
Figure 2-1: Flow of Calculation in MCODE-1.0 [Xu 2003] ... 25
Figure 2-2: Flow of Calculations in CASMO-4 [Knott et. al. 1995] ... .... ... 28
Figure 2-3: Pictorial Representation of Unit Cell Models ...--...-- -- --- _. --... . 31
Figure 2-4: MCODE/CASMO-4 Eigenvalue versus EFPD Benchmark Calculation for 17x17 Solid Assembly --- 33
Figure 2-5: MCODE/CASMO-4 Eigenvalue versus EFPD Benchmark Calculation for 13x13 Annular A ssem bly ... 34
Figure 2-6: Eigenvalue Differences between MCODE and CASMO-4 ._...--- .-35
Figure 2-7: MCODE/Corrected CASMO-4 Eigenvalue versus EFPD for a Poison-Free Annular Fuel Pin 38 Figure 2-8: Eigenvalue Differences between MCODE and Corrected CASMO-4 for a Poison-Free Pin Cell 39 Figure 2-9: Plutonium Composition versus Burnup as Calculated by MCODE and Corrected CASMO-4 for a Poison-Free Pin Cell ...--- 40
Figure 2-10: Cross sections of various nuclides in the Thermal Energy Range [Driscoll 19911].41 Figure 2-11: MCODE and Corrected CASMO-4 Eigenvalue versus EFPD for a 10 Owt% GdN Poisoned Annular Fuel Pin --- - 43
Figure 2-12: Eigenvalue Differences between MCODE and Uncorrected/Corrected CASMO-4 for a 10wt%/o GdN Poisoned Pin Cell --- 44
Figure 2-13: Total Cross Section for Gadolinium Isotopes . ... 45
Figure 2-14: Gadolinium Composition versus Burnup as Calculated by MCODE and Corrected CASMO-4 for a 10wt% GdN Poisoned Pin Cell 46 Figure 2-15: Plutonium Composition versus Burnup as Calculated by MCODE and Corrected CASMO-4 for a 10wt% GdN Poisoned Pin Cell 47 Figure 2-16: Fully Poisoned 13x13 Annular PWR Fuel Assembly ... 48
Figure 2-17: MCODE/Corrected CASMO-4 Eigenvalue versus EFPD for a Poisoned 13x13 Annular Assembly ---... 49
Figure 2-18: Plutonium Composition versus Burnup as Calculated by MCODE and Corrected CASMO-4 for a Full Poisoned 13x13 Annular Fuel Assembly ---...--- 50
Figure 2-19: Multiplication Factor versus EFPD for a 17x17 Solid Reference U02 Fuel Assembly at 100% Power Density and a 13x13 Annular UN Fuel Assembly at 150% Power Density --- 51
Figure 3-1: NUPEC Experimental Axial Power Peaking Profile [Kitamura 1998] ... 62
Figure 3-2: NUPEC Experiment Radial Power Peaking Factors . ... ... 63
Figure 3-3: NUPEC Experiment Axial Power Peaking Factors...--- 64
Figure 3-4: GEl 1 Fuel Assembly Layout [Gerald 1997] .--- -69
Figure 3-5: Axial Power Peaking Profile for 9x9 Reference Case *.... --- 72
Figure 3-6: Radial Power Peaking Profile for 9x9 Reference Case ..._... 73
Figure 3-7: 2-D Cross Section of the 5x5 Annular Fuel Design Concept (Not To Scale) ... 77
Figure 3-9: 2-D Cross Section of the 6x6 Annular Fuel Design Concept (Not To Scale) ... 80
Figure 3-10: Radial Power Peaking Profile for 6x6 Annular Case ... 81
Figure 3-11: 2-D Cross Section of the 7x7 Annular Fuel Design Concept (Not To Scale) --- 83
Figure 3-12: Radial Power Peaking Profile for 7x7 Annular Case --- -84
Figure 3-13: Effect of a Reduction in Inner Diameter on the MCHFR for 5x5 Annular Fuel ... 86
Figure 3-14: Effect of Decreasing the Inter-Pin Gap (Via Expansion of the Overall Fuel Pin Dimensions) on the MCHFR for 5x5 Annular Fuel ... 87
Figure 3-15: Effect of a Reduction in Inner Diameter on the MCHFR for 6x6 Annular Fuel ... 89
Figure 3-16: Effect of the Orifice Resistance Coefficient on CHFR for 6x6 Annular Fuel 91 Figure 3-17: Effect of a Reduction in Inner Diameter on the MCHFR for 7x7 Annular Fuel ... 93
Figure 3-18: Effect of the Orifice Resistance Coefficient on CHFR for 7x7 Annular Fuel ... 94
List of Tables
Table 1-1: Physical and Thermal Properties of UO2 and UN --- 16
Table 2-1: Geometric Design Parameters for Investigated Fuel Assembliesm --- -32
Table 2-2: BOL Reactivity Coefficients for 17x17 Solid and 13x13 Annular ... 52
Table 3.1: NUPEC Experiment Operational Conditions [Kitamura 1998] ... 61
Table 3.2: Comparison of the Critical Powers Predicted by the Hench-Gillis and EPRI-1 Correlations to the Experimentally Measured NUPEC Data at 25 kJ/kg Inlet Subcooling --- 65
Table 3.3: Comparison of the Critical Powers Predicted by the Hench-Gillis and EPRI-1 Correlations to the Experimentally Measured NUPEC Data at 126 kJ/kg Inlet Subcooling --- --- 65
Table 3.4: EPRI-1 CPR Calculation Data 67 Table 3.5: EPRI-1 and Hench-Gillis Calculated CPR Comparison ...- . ---. 67
Table 3.6: Solid Fuel Reference Core Operating Parameters [Lungmen], [Nine Mile Point 2004] --- 70
Table 3.7: Solid Fuel Reference Core Design Constraints ... 70
Table 3.8: GEl 1 Fuel Assembly Design Parameters.. --- 71
Table 3.9: Localized Pressure Drop Coefficients...--- 71
Table 3.10: Annular Design Option Space... 73
Table 3.11: Geometrical Design Parameters for 5x5 Annular Fuel ... 76
Table 3.12: Geometrical Design Parameters for 6x6 Annular Fuel ... . 79
Table 3.13: Geometrical Design Parameters for 7x7 Annular Fuel ..._... 82
Table 3.14: Comparison of 9x9 Reference, 5x5, 6x6 and 7x7 Annular Designs ...--- 96
Table 3.15: Mixing Contribution Comparison for 9x9 Reference and 6x6 Annular Cases ... 97
Table 3-16: Effect of Radial Power Peaking on the MCHFR. ---.... ...----...-... -100 Table A-i: CASMO-4 Operational Parameters for the 17x17 Reference Case Reactivity
Coefficient Determination 108
Table A-2: CASMO-4 Operational Parameters for the 13x13 Annular Case Reactivity
List of Acronyms
BOL - Beginning Of Life BWR - Boiling Water Reactor CHF - Critical Heat Flux
CHFR - Critical Heat Flux Ratio CMS -Core Management System
COL - Construction and Operating License CPR - Critical Power Ratio
DC - Design Certification AP - Pressure Drop
DNB -Departure from Nucleate Boiling DOE -Department of Energy
EIA -Energy Information Administration ENDF - Evaluated Nuclear Data File EOL - End Of Life
EPRI -Electric Power Research Institute ESP - Early Site Permit
FTC - Fuel Temperature Coefficient GE - General Electric
HEM - Homogeneous Equilibrium Model HM - Heavy Metal
JAERI - Japan Atomic Energy Research Institute
JEF - Joint Electronic Folder LWR - Light Water Reactor
MCHFR - Minimum Critical Heat Flux Ratio MCPR - Minimum Critical Power Ratio MTC - Moderator Temperature Coefficient MWe - MegaWatts electric
NEA - Nuclear Energy Agency (France) NRC - Nuclear Regulatory Commission
NUPEC -NUclear Power Engineering Corporation (Japan)
OECD - Organization for Economic Co-operation and Development (France)
PPM - Parts Per Million
PSAR - Preliminary Safety Analysis Report PWR - Pressurized Water Reactor
TD - Theoretical Density
USAR - Updated Safety Analysis Report
1.
Introduction
1.1.
Societal Need
for
Safe and Economic Nuclear Power
Sobering electricity supply and demand projections, coupled with the current volatility of energy prices, have underscored the seriousness of the challenges which lay ahead for the utility industry. According to the Energy Information Administration (EIA), the statistical arm of the U.S. Department of Energy (DOE), worldwide energy consumption is likely to increase 57% by 2025, with consumption of nuclear generated capacity rising from 2560 billion kilowatt-hours to over 3300 billion kilowatt-hours. The U.S. alone is expected to require at least 355,000
megawatts of new and replacement electrical generation within the next two decades, assuming electricity demand grows at a modest rate of 1.5% per year, [EIA 2004].
US Past, Present and Forecasted Future Electricity Consumption i 0 .o ,.m 50000 50000 40000 0. E r 30000-1 20000 IL 10000 0 19 0 16 190 190 190 200 200 200 2 .U/ --- U'-50 1960 20 30 Year
Figure 1-1: US Electricity Consumption Projection [EIA]
In order to satisfy this incredible increase in electricity demand shown in Figure 1-1, the nuclear industry has two available means with which to address this need. The first option, construction of new nuclear power reactors, has been aggressively moving forward thanks to the recent passage of the 2005 Energy Bill which implemented incentives recommended by [Ellis] in August of 2004 and again by [Dominici] in November of that same year. This favorable
economic and political environment has allowed numerous utility companies, many of whom had already applied for early site permit (ESP) licenses, to announce their intent to apply for combined construction and operating licenses (COL) with recently certified reactor designs (DC).
The second option available to address the impending need for additional electricity is to increase the electricity output of existing reactor facilities. Since the industry has achieved an
'^^^^
19,
average plant capacity factor of over 90% U.S. wide, efforts to improve the outage management strategy of existing nuclear plants would likely only be able to achieve minimal increases in electricity production. Investigation of existing plant component operating limits is also not likely to uncover any significant abilities for higher electricity production capacity within the same core design since this initiative has been continually pursued by the utility companies ever since the NRC granted the first uprate license of 5.5% (140 MWt) to the Calvert Cliffs plant in September of 1977. Almost 5 MWe in added capacity have been allowed over the years. Therefore, the most promising remaining avenue with which to pursue higher electricity output from existing nuclear plants is to develop improved core designs and components capable of producing more electricity.
The improved core can increase electricity production by one or both of the following strategies; increasing the number of fuel bundles per core (which implies a redesign of the reactor vessel) and/or increasing the amount of power produced per bundle. Redesigning large components like the reactor vessel is possible; however it could face manufacturing limits. Advanced fuel designs, on the other hand, can be utilized with far less limitations. This thesis pursues the development of advanced fuel designs, i.e. the development of high-performance annular geometries which can achieve higher power densities and hence, higher electricity output. It is theorized that utilities would be able to utilize this design through either retrofitting
of their existing reactor facilities or via incorporation of the advanced fuel design into new plant orders.
1.2.
Review of Previous Work on Annular Fuel for Reactor
Applications
Previous studies [Hejzlar et. al. 2001], [Xu et. al. 2004] and [Feng et. al. 2005] have shown that 50% increases in power density for PWRs can be achieved with internally and externally cooled annular fuel. This ability to uprate is primarily due to the significantly higher fuel surface to volume ratio of the individual pellets. It was observed that the hot zero power to hot full power reactivity loss was smaller for the annular fuel due to the lower fuel operating temperature. It was also noted that the peak-to-average power ratio inside the pellet was smaller and that there are two distinct rim regions, where plutonium build up will be higher than the
average; one rim region at each surface facing the moderator.
The core modeling simulations conducted in this study showed that the annular fuel cores at 150% power density had lower fuel temperatures but equivalent moderator temperatures due to the fixing of the power to flow ratio. However if U0 2 is used for the same cycle length, the
assembly will have to be enriched higher (-8%) than the current legal limit of 5 weight percent U235. This higher enrichment, due to increased total energy demand from a reduced fuel volume,
significantly affected several important core parameters. Most notably, the reactivity worth of the assembly control rods decreased from hardening of the neutron spectrum. Therefore the annular pins had to be loaded with increased amounts of burnable poison due to the study constraint of a maximum core boron concentration of 1750 ppm (parts per million). Finally, it was observed that even though the reactivity feedback effects were similar to that of the reference Westinghouse
17x17 solid fuel assembly, the shutdown margin was reduced. It was theorized that the ability to stay at or below 5 weight percent enrichment would alleviate several of these concerns
associated with shutdown margin. Therefore, in part one this paper proposes swapping out the UO2 with higher density UN in order to stay below this 5% enrichment limit.
Stella Oggianu concluded in her CANES report [Oggianu 2001] that 95% smear density uranium nitride seems to be the best practical option for once-through advanced nuclear fuel
cycles. Also, the relatively high absorption cross section of N1 5 was not determined to be a
problem with respect to parasitic absorption in materials enriched in U235. The principal physical and thermal attributes of both uranium dioxide and uranium nitride are summarized in the table below.
Table 1-1: Physical and Thermal Pro•erties of U02 and UN
U0 2 UN
Theoretical Density (g/cm3) 10.96 14.32
HM Atom Density (g/cm3) 9.67 13.52
Specific Heat (J/Kg K) 270 (at 2000C) 205 (at 280C)
Melting Point (0C) -2800 -2700
Thermal Conductivity (W/m K) 7.19 (at 2000C) 4 (at 2000C)
3.35 (at 10000C) 20 (at 1000°C)
Linear Thermal Expansion Coefficient (10-6K-) 10.1 (at 9400C) 9.4 (at 10000C)
Swelling Rate (normalized to U02) 1.00 0.80
Fission Gas Release (normalized to UO2) 1.00 0.45
As shown above in Table 1-1, UN has several beneficial attributes over U02. The higher
theoretical and HM atom density allow the designer to pack in approximately 40% more uranium atoms in an equivalent volume. This attribute has tremendous implications for the development of advanced fuel designs since the integration of UN gives the enhanced ability to run the fuel assemblies hotter and longer than current U0 2 designs. UN also has a smaller linear expansion
coefficient and swelling rate which helps with long term performance of the fuel. Furthermore, the fission gas release is also believed to be markedly less than that of UO2. Finally, one of the more unique attributes of UN is that the thermal conductivity of the material actually increases
with increasing temperature. The opposite trend of the UO2 gives the UN fuel tremendous
advantage in this respect. Figure 1-2 below shows a graph of precisely how the thermal conductivity of UN depends upon temperature.
U -a I--j 0 400 400 1200 1500 2000 TEMPERATIRE PC)
Figure 1-2: Temperature Dependence of Thermal Conductivity for UN
If reprocessing were to be implemented, than enrichment in the N15 isotope would be required due to the N'4(n,p)C14 reaction. The C14 product would have a significant impact upon
the environment if a radioactivity release were to occur and it is doubtful that a naturally enriched nitride fuel would be accepted since it was the only material for which the dose commitment in the gastrointestinal track was above current legal limits. Since it is obviously desirable to enrich in the N15 isotope questions regarding the economics arose. Presently, this
enrichment cost has been estimated at roughly $1000 per gram. Future development work may help to decrease this cost to more economically acceptable levels. She concluded that the principal concern facing the use of UN in LWRs today is its oxidation reaction with water.
Unfortunately as stated before, the materials database for uranium nitride (and consequently gadolinium nitride) is quite small. Previously uranium nitride fuels were also investigated for space applications in nuclear electric propulsion systems however recent consultation with US national laboratories has indicated that no studies are currently being performed. Presently only the research groups at the Japan Atomic Energy Research Institute
(JAERI) appear to be working with nitride fuels. They have started to assemble a materials database and are currently developing economical fabrication and reprocessing technologies in order to support their advanced fast reactors and transmutation of long-lived minor actinides program [Suzuki 1998].
Internally and externally cooled annular fuel has also been investigated for BWR applications as well. Annular arrays of 5x5 and 6x6 were previously investigated for their potential to increase power density and it was determined that as much as a 18% uprate may be achievable with a 6x6 annular geometry [Morra 2004]. The uprated 6x6 annular assembly was also determined to have a 60% higher pressure drop across the core which has the possibility of complicating the assembly hold down and vibrations of the fuel against spacer grids. It was indicated that a vibration analysis should be conducted since this parameter might impose a limit upon the ability of the annular assembly to uprate. This larger AP also means that significantly
larger recirculation pumps, able to handle the increased needed pumping power, would have to be installed.
The neutronic differences between the solid 8x8 reference case and the annular 6x6 test assembly were determined to be smaller than those of the previous PWR annular study
completed by Zhiwen Xu in 2004. Even though the annular fuel has a larger fuel surface to volume ratio than the solid reference fuel, the effect of the significantly larger void fraction of
the coolant in the inner channels gives rise to a smaller adverse fuel surface effect than in PWRs. The local peaking factors were comparable to that of the reference case and the neutronic penalty of annular fuel was determined to be less for BWRs than for PWRs. Finally, under nominal operating conditions the annular fuel assembly for the BWR exhibited a smaller fuel temperature gain versus PWRs. This was mainly due to the fact that the annular fuel assemblies for BWRs have a lower power density level than PWRs.
The study completed by Morra used the Hench-Gillis critical power correlation for all analyses. This decision is problematic because Hench-Gillis is a bundle average correlation and its use for an annular geometry, particularly for the inner annuli, is questionable. Thus, more vigorous analysis is needed to more aptly model the annular geometry. Additionally, this study also indicated some problems of obtaining VIPRE convergence for some of the annular designs. In Appendix A the study documented an effect of the number of axial nodes on the calculated CPR (critical power ratio). Therefore, in part two, this paper proposed the investigation of annular fuel for BWRs with a more accurate heat balance CHFR correlation (EPRI-1 Reddy-Fighetti) rather than the modified Hench-Gillis CPR correlation which was used previously.
1.3. Objective
of
This Work
The primary objective of this thesis is to characterize and develop advanced high-performance annular fuel designs for both PWRs and BWRs. In particular for PWRs uranium nitride fuel, instead of uranium dioxide fuel, was assessed in a 13x13 internally and externally cooled annular fuel pin geometry. This objective was accomplished through three principal tasks. First, determination if an equivalent fuel cycle length could be achieved with uranium nitride
fuel at an uprated power density as the nominal uranium dioxide fuel at 100% power density without exceeding the current 5 weight percent licensing limit for fuel enrichment. Second,
determination of what corrections can be made to the CASMO neutronics code input deck in order to accurately model the uranium nitride annular fuel at both 100% power density as well as the uprated power density. Finally, the third task was a determination of what the relative
difference in reactivity swing was between an uprated 13x13 annular uranium nitride and the 17x17 solid reference uranium dioxide fuel assemblies. This task included a comparison of the reactivity coefficients so that a comparison could be made between the annular geometry UN and the solid pin geometry U02.
For boiling water reactors, it was desired to compare the best achievable designs for 5x5, 6x6 and 7x7 annular fuel pin geometries in order to determine from a thermal hydraulic
viewpoint how large of an uprate could be attained for an annular fuel geometry with uranium dioxide fuel. This objective will be accomplished by first comparing different applicable critical heat flux correlations in order to determine if a more accurate treatment of the annular geometry than that of previous research efforts can be utilized. Secondly, the difference in the
assembly was characterized in order to understand how the CHFR was affected by these parameters. Finally, the effects of varied grid coefficients on the inner and outer channels were investigated for their ability to influence flow distribution so as to increase the minimum CHFR.
1.4.
Organization
of
the Thesis
This thesis is organized into four main chapters. Chapter 1.0 (the current chapter) starts by looking at the societal need for additional nuclear generated electricity at economic costs and with enhanced safety margins. This is followed by a brief review of the previously completed work on annular fuel for high power density reactor applications. Finally, the study objectives and organization of the thesis round out this first chapter.
Chapter 2.0 focuses upon the utilization of uranium nitride fuel in an annular geometry for high power density PWR fuel assembly designs. This chapter starts with the methodology for how the study was conducted followed by a short overview of the analysis tools employed which include MCODE and CASMO-4. These two parts are followed by a third which is comprised of a short description of the geometries and other pertinent operating parameters for both the 17x17 reference and 13x13 annular test cases. The benchmark analysis of both the solid reference fuel and the annular test fuel delineates the need for a correction factor for the CASMO-4 input deck. This total assembly-wide correction factor is established by determining an appropriate
correction factor for each of the annular fuel assemblies constitutive parts (namely the poison-free pin and the poisoned pin) and then combining them together into a full poisoned annular assembly.
Chapter 3.0 focuses upon the utilization of uranium dioxide fuel in three different annular geometries for high power density BWR fuel assembly designs. First the methodology for how the study was conducted is introduced, followed by the second section which provides a short overview of the VIPRE thermal hydraulics analysis code along with a discussion of the reasons
for the selection of each correlation used. This is followed by a short description of the
geometries and other pertinent operating parameters for both the reference and annular test cases. Finally, the trial calculations and comparisons of all reference and test fuel assemblies along with some brief observations of the results are presented at the end of this chapter.
Chapter 4.0 delineates summary of conclusions and recommendations for future work from the completed analyses contained within Chapter 2.0 and Chapter 3.0 of this thesis.
2. Uranium Nitride Annular Fuel for PWR Applications
2.1.
Methodology
The methodology for this chapter of the thesis is relatively straightforward. Both the solid reference fuel and annular test fuel were benchmarked in CASMO-4 against MCODE results where a discrepancy was found for the annular fuel. This discrepancy can be best explained by the lack of appropriate treatment for the resonance absorption in UO2 at the interior channel of
the annular fuel. Since Studsvik of America considers the CASMO-4 source code to be proprietary, a correction factor was needed to be applied directly to the input file. In order to establish this correction factor, the annular assembly was broken down into its constituent pieces (poison-free fuel pins and poisoned fuel pins) so that an appropriate correction factor could be determined for each piece. These constituent pieces were then brought back together into a
13x13 array so that the correct assembly level correction factor could be determined for the CASMO-4 input deck.
2.2.
Analysis Tools
2.2.1.
MCODE
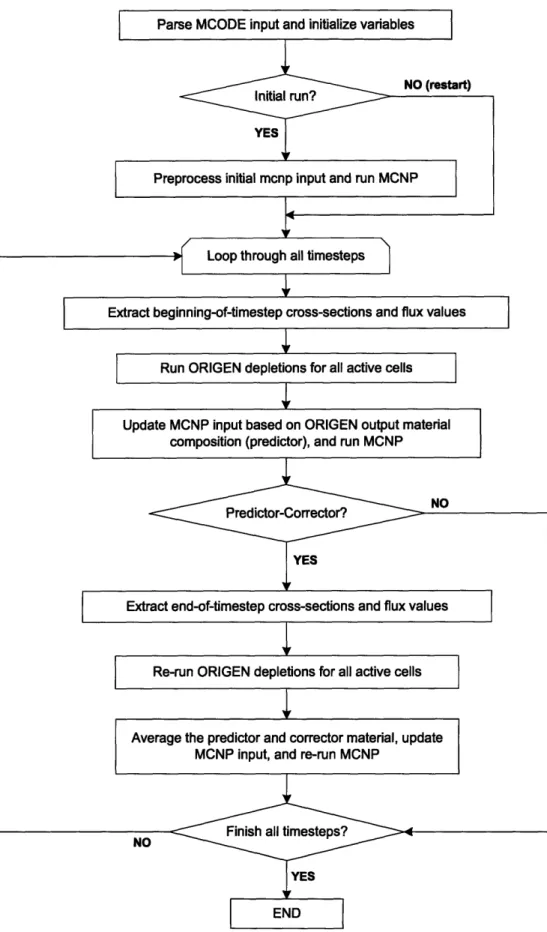
MCODE or MCNP-ORIGEN DEpletion program was developed at MIT in 2003 by Zhiwen Xu [Xu 2003]. This code couples the continuous energy Monte Carlo code MCNP-4C with the one-group point depletion code ORIGEN-2.1 in order to perform burnup simulations. Figure 2.1 shown below delineates the flow of calculations for the MCODE-1.0 program. As can be seen from the figure MCODE alternately executes MCNP-4C and ORIGEN to simulate burnup using a standard predictor-corrector algorithm. Initially the MCNP simulation is run to
calculate the neutron flux and effective one-group cross sections for the burnup regions of interest. This information is then fed into an automatically generated ORIGEN input deck which, in turn, carries out multi-nuclide depletion simulations for each burnup region of interest. This information output from ORIGEN is then used to generate updated material compositions in a new MCNP input deck which is rerun. To use MCODE only two input files are needed, a MCNP input file which appropriately defines the geometry and material composition of the problem and a MCODE input file which defines how and what, within the MCNP input, is to be depleted. An equilibrium MCNP source file may also be used in order to speed up calculation time.
Parse MCODE input and initialize variables
NO (restart)
Initial run? YES
Preprocess initial mcnp input and run MCNP
mcn
Extract beginning-of-timestep cross-sections and flux values
Run ORIGEN depletions for all active cells
Update MCNP input based on ORIGEN output material composition (predictor), and run MCNP
NO
Predictor-Corrector?
NO
YES
Extract end-of-timestep cross-sections and flux values
Re-run ORIGEN depletions for all active cells
Average the predictor and corrector material, update MCNP input, and re-run MCNP
Finish all timesteps?
NO
YES
END
Figure 2-1: Flow of Calculation in MCODE-1.0 [Xu 20031
L throu h all timeste s
I E IE" " II I II E II II • I l " "II ' J
The MCODE burnup simulation program considers two main groups of nuclides in its calculations: actinides and fission products. Both groups represent important contributions to the fuels properties during the burnup lifetime. The actinides as defined in this program are heavy metal nuclides with atomic numbers equal to 90 or higher plus their associated daughter decay products. These actinides provide a non-negligible number of fission source neutrons and subsequent source of fission neutrons. MCNP corrects for the following reaction rates of the actinides; capture, fission, (n,2n) and (n,3n). Since the fission products only represent a non-negligible source of absorption, only the neutron capture cross section is corrected for by MCNP.
MCODE only incorporates those nuclides which significantly contribute to the fission source neutron population and neutron interaction cross sections. So, in order to conduct a rigorous burnup simulation the contributions from those nuclides defined as non-significant would be
taken into account.
2.2.2. CASMO-4
CASMO-4 is part of the Studsvik Core Management System (CMS) code package
developed by Studsvik Scandpower Inc. which also includes TABLES-3 and SIMULATE-3. It is a multi-group two-dimensional deterministic transport theory code written in Fortran 77 which is used to model the burnup behavior of LWR fuel. This code is capable of modeling cylindrical geometries of arbitrary compositions in either a square or hexagonal lattice. Unless explicitly
specified, the code assumes several parameter values typical of existing LWRs. For instance if the moderator temperature is higher than 523 K then the default core pressure of a PWR is set to
15.5 MPa [Edenius et. al. 1995]. Providing that the fuel to be modeled is relatively similar to that of existing LWR fuel, even a fairly complex poisoned assembly can be formulated in
approximately 30 lines of code. Figure 2.2 below shows the flow of calculations for the CASMO-4 program.
Restart file ---Data library
Data library
--Card Image file
Burnup
Figure 2-2: Flow of Calculations in CASMO-4 [Knott et. al. 19951
As shown in the flow diagram CASMO-4 starts by calculating the effective resonance energy region cross sections for the resonance absorbers of interest by utilizing an equivalence
theorem which identifies a homogenous problem which closely relates to the heterogeneous problem at hand. The homogenous resonance integrals are recorded in the neutron data library as functions of potential temperature and cross section. The effective absorption and fission cross sections are calculated by the effective resonance integrals which were determined by
interpolating from the homogeneous resonance integrals from a square root dependence of potential temperature and cross section. Dancoff factors, which are calculated by CASMO, account for the shielding effect between different pins within the problem.
Following the resonance calculations, the data for the microscopic group cross section is created for each specific condition and spatial region. A micro group calculation is then
performed for each individual pin type in the problem using the macroscopic group cross sections in order to determine the detailed neutron energy spectra which are subsequently condensed into macro groups. The two-dimensional macro group calculation is then carried out utilizing an approximate fast response matrix method. The neutron spectra for the energy condensation of cross sections data obtained from this calculation is then input into the two-dimensional transport calculation to obtain the eigenvalue and flux distribution in the problem. In the case where the problem consists of only one fuel assembly, the fundamental buckling mode is used to include the leakage effect by modifying the infinite lattice results.
An isotopic depletion calculation is performed in each fuel pin and burnable absorber region. These burnup calculations in CASMO-4 also incorporate a predictor-corrector approach. This approach means that the depletion is calculated twice for each burnup step, initially
predicting by using the spectra at the start of the step and finally correcting by using the newly calculated spectrum at the end of the step. Then the average number densities from these two steps are used as the starting values for the subsequent burnup step. This algorithm represents a
widely accepted method for carrying out these sorts of calculations since sizable burnup steps can be used without compromising any accuracy. The version of CASMO-4 used at MIT does not utilize any pseudo fission products because it traces fission products explicitly by using extended heavy nuclide chains and fission products from the neutron data library J2/E6. This library was created from the data from both ENDF/B-6 from Brookhaven National Nuclear Data Center and JEF-2.2 from OECD/NEA data bank which contains 70-group microscopic cross sections, decay constants and fission yields for 305 different isotopes.
2.3.
Description of Geometries Analyzed
Figure 2.3 depicts a unit cell model of both solid pin from the 17x17 reference assembly and an annular pin from the 13x13 test assembly.
Figure 2-3: Pictorial Representation of Unit Cell Models
In all of the benchmark calculations the uranium was enriched to 5 weight percent and 10 weight percent Gd203 was assumed in the poisoned pins. The solid U02 reference case used a 98% theoretical density of 10.4 g/cm3 in the poison-free pins and 10.0374 g/cm3 in the poisoned pins. The annular UN test case used a 98% theoretical density of 14.0336 g/cm3 in the
poison-free pins and 13.4045 g/cm3 in the 10 weight percent GdN poisoned pins. A value of 104.5 kW
per liter-core was used to specify the 100% reference core power density level. The temperature of the fuel was assumed to be 900 K for the solid reference fuel and 600 K for the annular test fuel. The temperature of the moderator was the same for both cases at 583.1 K. Equivalent geometrical constraints were also imposed on the 13x13 annular design such as the assembly
height, width and length. The following table displays the key cold dimension design parameters for both the 17x17 solid reference case as well as the 13x13 annular test case.
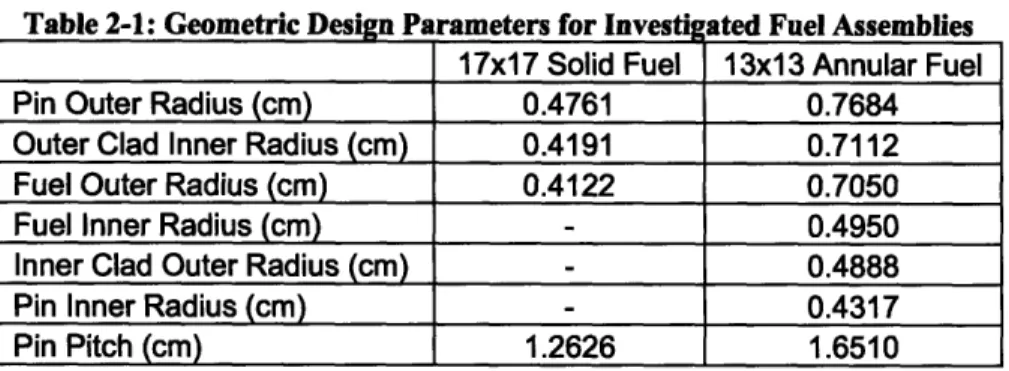
Table 2-1: Geometric Design Parameters for Investi ated Fuel Assemblies
17x17 Solid Fuel 13x13 Annular Fuel
Pin Outer Radius (cm) 0.4761 0.7684
Outer Clad Inner Radius (cm) 0.4191 0.7112
Fuel Outer Radius (cm) 0.4122 0.7050
Fuel Inner Radius (cm) - 0.4950
Inner Clad Outer Radius (cm) 0.4888
Pin Inner Radius (cm) - 0.4317
Pin Pitch (cm) 1.2626 1.6510
2.4.
Benchmark Analysis
2.4.1. MCODE/CASMO-4 Comparison
MCODE is based upon the stochastic Monte Carlo method, thus given sufficient computing power and time, an exact solution can be found for the neutron transport equation. However, this capability comes with an expensive (from both a time and money perspective) price; each assembly depletion simulation takes roughly 2 days to calculate utilizing 4 nodes on a supercomputing 20 node Beowulf cluster. Faster means of obtaining the desired solution were needed. The deterministic CASMO-4 transport code is capable of solving the equivalent problem in less than 2 minutes. However before the switch can be made, the results must be benchmarked against the existing Monte Carlo standard to ensure that the problem is appropriately simulated. In particular, the treatment of U238 absorption in the resonance region is restricted in CASMO-4
to the solid cylinder. Thus, the effect of the internal surface in the annular fuel is not accounted for. Without the internal surface, the U238 absorption will be underpredicted in CASMO-4.
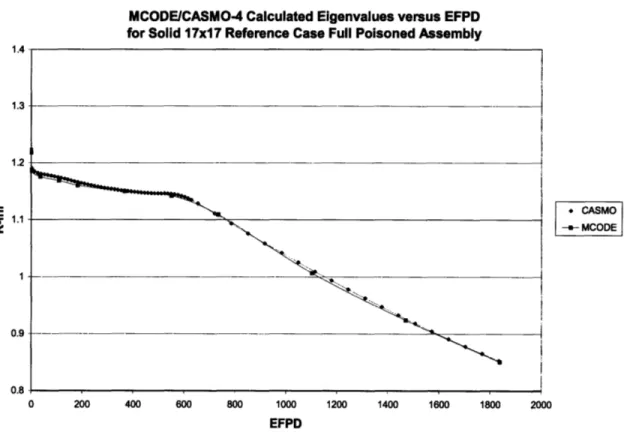
The reactivity limited burnup versus EFPD (effective full power days) as calculated by both MCODE and CASMO-4 for the 17x17 solid UO2 reference fuel model is shown below in
Figure 2.4.
MCODE/CASMO-4 Calculated Elgenvalues versus EFPD for Solid 17x17 Reference Case Full Poisoned Assembly
* CASMO
- MCODE
0 200 400 600 800 1000
EFPD
1200 1400 1600 1800 2000
Figure 2-4: MCODE/CASMO-4 Eigenvalue versus EFPD Benchmark Calculation for Assembly
As can be seen from Figure 2.4, the calculated infinite multiplication factor for the solid 17xl 7 reference assembly demonstrates satisfactory agreement. This result is expected since CASMO-4 has been tailored to provide accurate results for solid rod PWR fuel assemblies. This
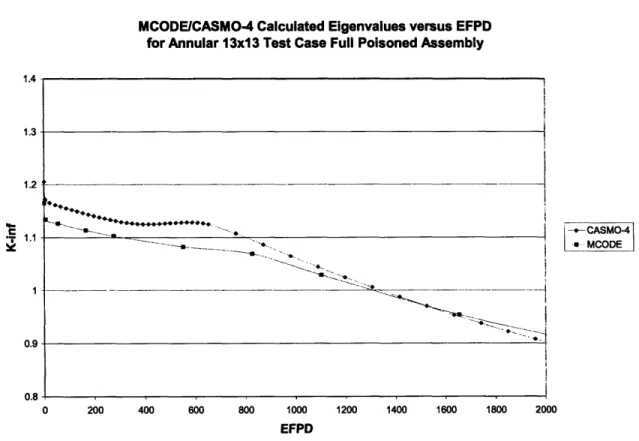
calculational procedure was then repeated for the annular 13x13 UN test assembly and plotted below in Figure 2.5.
MCODE/CASMO-4 Calculated Elgenvalues versus EFPD for Annular 13x13 Test Case Full Poisoned Assembly
1.3 1.2 C S1.1 0.9 -
-1
44,, - CASMO-4 L MCODE ' --- " ----. ... • .•--22Z ...• . 0 200 400 600 800 1000 EFPD 1200 1400 1600 1800 2000Figure 2-5: MCODE/CASMO-4 Eigenvalue versus EFPD Benchmark Calculation for 13x13 UN Annular Assembly
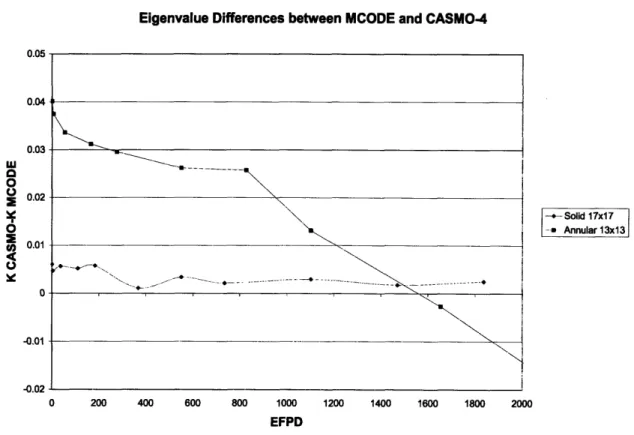
Unlike the solid 17xl 7 reference case, the infinite multiplication factor calculated by CASMO-4 is not in satisfactory agreement with the MCODE result. In order to better illustrate this variation between the solid and annular fuel, the differences in the eigenvalue determined by CASMO-4 and MCODE are plotted below in Figure 2.6 for both assemblies.
Eigenvalue Differences between MCODE and CASMO-4 U.Uo 0.04 0.03 a O 0.02 0.01 0 -0.010-0 <K-- ---- ~ ~ '~'~---·-.~. ~ --- ,,--.- Solid 17x7 m- Annular 13x13 Y~~ 0 200 400 600 800 1000 1200 1400 1600 1800 2000 EFPD
Figure 2-6: Eigenvalue Differences between MCODE and CASMO-4 for a 17x17 Solid U02 Assembly and a 13x13 UN Annular Assembly
The solid fuel eigenvalue difference (represented by the blue line) shows excellent agreement between the two codes. On average over the fuel lifetime, CASMO-4 overestimates the eigenvalue by less than 0.4%. For the annular case however (represented by the pink line) CASMO-4 dramatically overestimates the reactivity at the BOL (beginning of life) and underestimates the reactivity at the EOL (end of life). The principal cause of this significant variation is due to the fact that CASMO-4 is optimized for solid pin geometry; hence it
underestimates the amount of U238 captures by applying self shielding within the solid pellet and not taking into account the additional captures which occur near the fuel surface in the inner
annulus. This inability to account for the additional captures explains both the overestimation at the BOL from the excess neutrons which were not absorbed in the U238and the underestimation
at the EOL from the lack of appropriate Pu239 formation. The mechanism by which the Pu239 is
formed from U238 is shown below:
U238 +.n -+ U239 - N 239 8L- Pu239
This formation is non-negligible since in a typical PWR the Pu2 39 fissions account for roughly 40% of the energy produced in the reactor.
2.4.2. CASMO-4 Pseudo-Solution for Annular Fuel
In order to be able to utilize CASMO-4 to simulate the annular fuel assembly some sort of an adjustment needed to be applied to the code in order to correct for the underestimation of the U238 resonance captures. Since Studsvik of America considers the CASMO-4 source code to be proprietary, making a direct change to the code itself was impossible. Instead a correction
factor was needed to be applied to the input deck directly. Previous work [Xu et. al. 2004] has investigated a wide variety of correction factors which were applied to CASMO-4 as input including a reduction in the coolant density, an increase in the U238 number density and the addition of hafnium. It turned out that an artificial increase of the U238 number density in the input deck achieved the closest agreement with the MCODE results. This is because the correction most appropriately accounts for the discrepancy over the fuel's life since the excess U238 atoms absorb the appropriate number of neutrons near the BOL and produce a suitable amount of plutonium near the EOL. A reduction in the coolant density introduces error in several other areas by significantly hardening the neutron spectrum and the addition of hafnium, while
appropriately mimicking the U238 captures, doesn't accurately predict the Pu239 formation (and
hence the reactivity) at the EOL.
2.5. Poison-free Pin Cell Correction
It is important to point out that this correction factor is optimized for the particular enrichment, assembly pin layout, selection and weight percent of burnable poison in this specific problem. The exact value of the U238 correction factor will change with variance of any of the aforementioned parameters for new annular problems. Also this correction factor does have implications for the determination of some of the reactivity coefficients. Therefore, this correction factor should only be used when the solution for the average core with average fuel enrichment is sufficient. In order to obtain the closest approximate answer for the U238 correction
factor, the input adjustment deck will first be created for a poison-free pin cell, then for a 10 weight percent GdN poisoned pin cell and finally for an entire 13x13 poisoned annular test assembly.
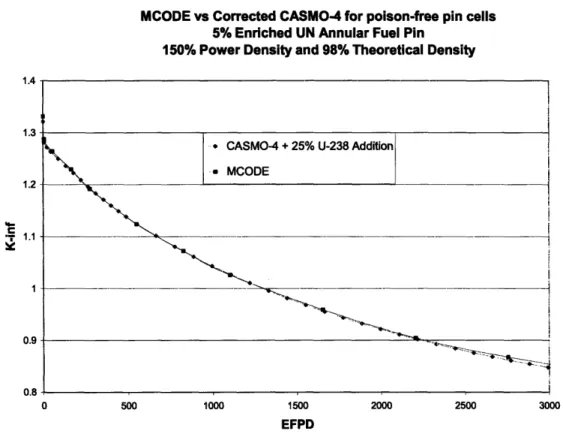
This pseudo-solution has been previously investigated for UO2 and it was shown that an
artificial increase of 20% was needed in the poison-free pin. Figure 2.7 below shows the infinite multiplication number versus effective full power days for the 50% uprated UN poison-free pin cell in both MCODE as well as in the corrected CASMO-4.
MCODE vs Corrected CASMO-4 for poison-free pin cells 5% Enriched UN Annular Fuel Pin
150% Power Density and 98% Theoretical Density
0 500 1000 1500 2000 2500
EFPD
3000
Figure 2-7: MCODE/Corrected CASMO-4 Eigenvalue versus EFPD for a Poison-Free Annular Fuel UN Pin
After a wide range of U238 number density additions were experimented with it turned out that a 25% addition of U2 3 8 number density provided for excellent agreement between the two
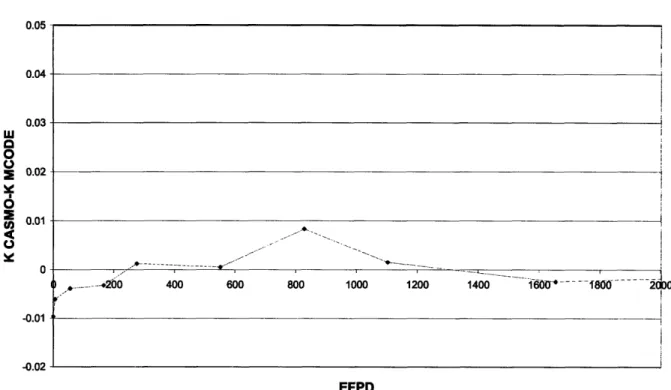
codes. Figure 2.8 shows how the differences in eigenvalue, as calculated by the corrected
Eigenvalue Difference for a CASMO-4 Corrected Poison-Free Pin Cell by Increasing U-238 at 150% Power Density and 98% Theoretical Density
0.05 0.04 0.03 0.02 0.01 0 -0.01 -0.02 -260 400 600 800 1000 1200 1400 120_ * - .200 400 600 800 1000 1200 1400 . i-O0 -... 800 ... EFPD
Figure 2-8: Eigenvalue Differences between MCODE and Corrected CASMO-4 for a Poison-Free UN Pin
Cell
Comparison of the 0.2% average eigenvalue difference achieved in Figure 2.8 with the larger swing exhibited in Figure 2.6 verifies that the selection of a 25% increase in number density was accurate. Since the intent of this project is to accurately simulate the annular fuel assembly over its entire lifetime, more than just a suppression of the reactivity at BOL is needed. The plutonium production potential of the annular assembly, which becomes increasingly
important at high burnup, was also tracked as a function of burnup in order to ensure accurate simulation of this assembly near the EOL.
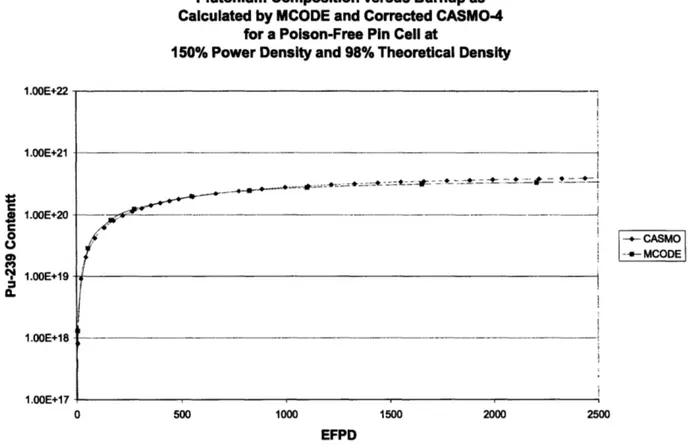
Plutonium Composition versus Burnup as Calculated by MCODE and Corrected CASMO-4
for a Poison-Free Pin Cell at
150% Power Density and 98% Theoretical Density
1.00E+22 1.00E+21 C i 1.00E+20 C * 1.OOE+19 1.OOE+18 1.00E+17 --- · ---- --- --- --- --- -
l-/---(
1000 1500 2000 -+- CASMO •-- MCODE 2500 EFPDFigure 2-9: Plutonium Composition versus Burnup as Calculated by MCODE and Corrected CASMO-4 for a
UN Poison-Free Pin Cell
Figure 2.9 demonstrates that the 25% U238 number density addition effectively tracks the Pu239 formation over the fuel lifetime. This handling of the Pu239 formation allows for an
adequate treatment of the annular assemblies reactivity, especially near the EOL.
i
1II__
'
I
2.6.
Poisoned Pin Cell Correction
Normal Westinghouse PWRs utilize an IFBA (thin layer of B'l coated onto the fuel pellet surface) for their burnable poison. Other options for burnable poison include either Erbia or Gadolinia mixed homogenously with the fuel. As shown below in Figure 2.10, the Gadolinia has an absorption cross section two orders of magnitude larger than B10 at thermal energies. Also,
due to the significantly higher expense of Erbium and questions regarding whether or not the IFBA coating could be applied to the inner annulus, Gd was selected for the annular assemblies' burnable poison. 4 tlE+F 1.OE+DS I 1.0E+03 1.0E+02 1.0E+00 0.001 0.01 0.1 1 Energy (eV)
Figure 2-10: Cross sections of various nuclides in the Thermal Energy Range [Driscoll 1991]
As previously mentioned in Section 1.2, the materials database for gadolinium nitride is quite small. Presently the only research group working to establish a materials database and
address fabrication issues associated with nitride fuels is at JAERI [Suzuki 1998]. Although these fabrication and material database issues are outside of the scope of this current research effort, they will need to be addressed in the future before integration into advanced fuel designs can take place.
2.6.1. Self-shielding Factor Correction
For the poisoned pin cell simulation the GdN was assumed to be uniformly mixed with the UN fuel in the pin. However because Gadolinium is known as a "black" absorber, it burns
out in layers. This trait caused a slight difficulty initially with MCODE because the burnup region was being re-homogenized between each depletion time step. This problem was
circumvented by separately defining 10 equi-volume cylinders within each poisoned fuel pin so that each "layer" could be treated independently. This significantly increased computation time however it was necessary in order to accurately capture the effect of the burnable poison.
2.6.2. Multiplication Factor Tracking with Burnup
As pointed out in the beginning of Section 2.5 the introduction of Gadolinium into the fuel pin necessitated a revalidation of the U238 number density correction factor for the poisoned pins. Figure 2.11 below shows the infinite multiplication number versus effective full power days for the 50% uprated UN GdN poisoned pin cell in MCODE and corrected CASMO-4.
MCODE vs Corrected CASMO-4 for a 10wt% GdN poisoned pin cell 5% Enriched UN Annular Fuel Pin
150% Power Density and 98% Theoretical Density
500 1000 1500 2000 2500
EFPD
3000
Figure 2-11: MCODE and Corrected CASMO-4 Eigenvalue versus EFPD for a 10wt% GdN Poisoned UN
Annular Fuel Pin
Again a wide range of U238 number density correction factors were experimented with.
with the MCODE derived results. The improvement in agreement between MCODE and CASMO-4 is further shown below in Figure 2.12.
Eigenvalue Difference for a CASMO-4 Corrected Poisoned Pin Cell by Increasing U-238 at 150% Power Density and 98% Theoretical Density 0.05 0.04 0.03 0.02 0.01 0 -0.01 -0.02 -0.03 -0.04 -0.05 .-- - , P --- 200 ---- 400 - .-. -600 - ---800 1000 --- 1200 -- 1400 1600 1800 - 2 k · . ... ~ ... 200 400 600 800 1000 1200 1400 160 80 2(
____---·-·--- ._
.__________ __.___.- ___ ---·
~-i
I I0 EFPDFigure 2-12: Eigenvalue Differences between MCODE and Corrected CASMO-4 for a 10wt% GdN Poisoned
2.6.3. Gadolinium Tracking with Burnup
Figure 2.13 below shows the total cross section for Gadolinium isotopes 152, 154, 155, 156, 157, 158 and 160 which were represented by the red, green, blue, purple, light green, brown and light red colored lines respectively. Although the Gadolinium utilized in the poison was at natural enrichment, only Gd-155 (blue) and Gd-157 (light green) were tracked due to the relatively insignificant absorption cross sections of the other isotopes.
~ 111111 I 11111111 I 11111111 I 11111111 I I I I 111 I 1111111 I 11111111 I 1111111 I 11111111 I 1111111
i
1
.1.
'Iii
I I I IIIII I I IIIIII I I I IIIId I I IIIIII I I I IIIII I I I IIIII I I IIIIII I I
1 8 167 106 165 154 1 3 162 11 11 16
Energy (MeV)
Figure 2-13: Total Cross Section for Gadolinium Isotopes
1% 11 185 184 0 3 0 0 01 8 -12 ii 5 59
Gadolinium Composition versus Burnup as Calculated by MCODE and Corrected CASMO-4
for a 10wt% GdN Poisoned Pin Cell
at 150% Power Density and 98% Theoretical Density
1.0E+21
1.00E+20
0 1.00E+19
1.00E+18
1.00E+17
-A-- Corrected CASMO-4 Gd-155
. Corrected CASMO-4 Gd-157
-*- MCODE Gd-155
--- MCODE Gd-157
0 500 1000 1500 2000 2500 3000
EFPD
Figure 2-14: Gadolinium Composition versus Burnup as Calculated by MCODE and Corrected CASMO-4 for a 10wt% GdN Poisoned UN Pin Cell
The Gadolinium composition was also tracked in order to ensure that adequate treatment of the burnable absorber was being observed. As shown in Figure 2.14 the introduction of the
U238 correction factors allowed for an appropriate tracking of the two important isotopes of Gadolinium. The computationally intensive nature of MCODE allowed for the completion of a certain number of points, although additional data points, particularly around dynamic features of the graph such as between 1100 and 1600 EFPD for the Gd'55, would likely show increased agreement between the two codes.
2.6.4.
Plutonium Tracking with Burnup
Plutonium Composition versus Burnup as Calculated by MCODE and Corrected CASMO-4
for a 10wt% GdN Poisoned Pin Cell at
150% Power Density and 98% Theoretical Density
1.00E+22 1.00E+21 e-9 1.00E+20 a 1.00E+19 1.00E+18 1.00E+17 500 1000 1500 2000 EFPD -- CASMO-4 - MCODE 2500
Figure 2-15: Plutonium Composition versus Burnup as Calculated by MCODE and Corrected CASMO-4 for a 10wt% GdN Poisoned UN Pin Cell
Figure 2.15 demonstrates that the 35% U238 number density addition effectively tracks
the Pu239 formation over the fuel lifetime. Now that an adequate correction factor has been
determined for the poisoned fuel pins, the correction factors can be combined together to form a full 13x13 poisoned annular fuel assembly.
2.7.
Correction for Fully Poisoned Assembly
The fully poisoned 13x13 annular UN assembly has 9 guide tubes and 160 fuel pins total;
16 of which are poisoned with 10% GdN by weight. The pin distribution is given below in
Figure 2-16.
0
Pisen-Free PinO
Pienedm lPh0
Guide Tube
Figure 2-16: Fully Poisoned 13x13 Annular PWR Fuel Assembly
Each fuel pin has an outer radius of 0.7685 cm and an inner radius of 0.4315 cm with a
1.651 cm. In order to stay within the design envelope of existing PWR fuel, the assembly pitch
was held constant at 21.50 cm and the overall fueled length was kept at 3.66 m. The moderator temperature assumed to be 583 K while the fuel outer surface temperature was set at 600 K.
2.7.1.
Multiplication
Factor Tracking with Burnup
MCODE vs Corrected CASMO-4 for a Full Poisoned Assembly 5% Enriched UN Annular Fuel Pin
150% Power Density and 98% Theoretical Density
-- Corrected CASMO-4
- MCODE
-- 0
0 200 400 600 800 1000 1200 1400 1600 1800 2000
EFPD
Figure 2-17: MCODE/Corrected CASMO-4 Eigenvalue versus EFPD for a Poisoned 13x13 UN Annular Assembly
Figure 2.17 shows a plot of the MCODE and corrected CASMO-4 simulations of a full
shows significant improvement in the ability to simulate annular fuel's reactivity over its lifetime. The plutonium production potential is plotted below in Figure 2.18.
2.7.2. Plutonium Tracking with Burnup
Plutonium Composition versus Burnup as Calculated by MCODE and Corrected CASMO-4
for a Full Poisoned 13x13 Annular Assembly at 150% Power Density and 98% Theoretical Density
1.00E+22 1.00E+21 1.00E+20 1.00E+19 1.00E+18 1.00E+17 -*- Corrected CASMO-4 -*-- MCODE 0 500 1000 1500 2000 EFPD 2500
Figure 2-18: Plutonium Composition versus Burnup as Calculated by MCODE and Corrected CASMO-4 for a Full Poisoned 13x13 Annular UN Fuel Assembly
As expected from the previous sections, Figure 2.18 confirms that the U238 number density correction factors determined for the poison-free and poisoned fuel pins, 25% and 35% respectively, allow for the appropriate formation of Pu2 39over the lifetime of the fuel.
2.8.
Final
Uprated Design
Comparison
K-inf versus EFPD for both a
17x17 Solid Reference UO2 Fuel Assembly at 100% Power Density and a 13x13 Annular UN Fuel Assembly at 150% Power Density
1.3 1.25 1.2 1.15 .--. .... 1.15 __ 1.05 -0.95 -0.85 0.8 0 200 400 600 800 1000 1200 1400 1600 EFPD * 17x17 Solid Reference * 13x13 Annular 1800 2000
Figure 2-19: Multiplication Factor versus EFPD for a 17x17 Solid Reference U02 Fuel Assembly at 100%
Power Density and a 13x13 Annular UN Fuel Assembly at 150% Power Density
Assuming 3% loss to leakage (depicted as the black line in the above figure), the multiplication factor versus EFPD is plotted for both the 17x17 solid reference case with U02
fuel enriched to 5% at 100% power density and for the 13x13 annular case with UN fuel enriched to 5% at 150% power density.
The reactivity coefficients at BOL for both the 17x17 solid U02 fuel reference assembly
at 100% power density and the 13x13 annular UN fuel assembly at 150% power density are summarized in Table 2-2 below. For a summary describing the operational ranges utilized in
CASMO-4 to determine these reactivity coefficients, please refer to Appendix A.
Table 2-2: BOL Reactivity Coefficients for 17x17 Solid and 13x13 Annular
17x17 UO2
13x13
UNReference Annular
FTC (1/K) -2.505E-5 -2.436E-5
MTC (1/K) -2.382E-4 -3.573E-4
Boron Worth (Ap) 6.320E-2 4.358E-2
Void Coefficient (1/%void) -7.249E-4 -1.084E-3
Even though the Doppler coefficient depends mostly upon the temperature (i.e. power level) and composition (i.e. depletion) of the fuel, the fuel temperature coefficients for both the
17x17 reference and the 13x13 annular are found to be quite similar. This demonstrates that the
10% reduction in fuel volume coupled with the change from UO2 to UN did not have a large
impact upon the feedback coefficient. Also, since the soluble boron has a positive effect on the MTC, the critical boron concentration is a limiting factor in PWR design. Thus, it is favorable to have a relatively comparable MTC to that of existing PWR assemblies. The approximately 30% higher MTC for the annular fuel is consistent with the 25% higher MTC observed in previous studies with this fuel type [Xu et. al. 2003]. The higher U235 content also gives rise to a harder spectrum which in turn leads to a smaller boron worth and degradation of the shutdown margin. This degraded shutdown margin could be overcome by increasing the number of control rods
and/or increasing the effectiveness of the control rod absorber materials.
As shown above in Figure 2.19, the 5% enriched UN annular-fuel assembly operating at
effective-full-power-days after the nominal 17x17 solid-fuel-pin assembly that operates at 100% power density. Additionally, the 13x13 annular fuel assembly is easier to control due to the smaller reactivity swing over the fuel lifetime. Thus, it is concluded that an annular uranium nitride
assembly at 150% power density can be designed so as not to require enrichments above 5% in order to reach the desirable cycle length of 18 months.

![Figure 2-10: Cross sections of various nuclides in the Thermal Energy Range [Driscoll 1991]](https://thumb-eu.123doks.com/thumbv2/123doknet/13878679.446612/42.918.168.730.579.949/figure-cross-sections-various-nuclides-thermal-energy-driscoll.webp)
