medication dosing: a focus on heparin
The MIT Faculty has made this article openly available. Please share
how this access benefits you. Your story matters.
Citation
Ghassemi, Mohammad M., Stefan E. Richter, Ifeoma M. Eche, Tszyi
W. Chen, John Danziger, and Leo A. Celi. “A Data-Driven Approach
to Optimized Medication Dosing: a Focus on Heparin.” Intensive
Care Medicine 40, no. 9 (August 5, 2014): 1332–1339.
As Published
http://dx.doi.org/10.1007/s00134-014-3406-5
Publisher
Springer Berlin Heidelberg
Version
Author's final manuscript
Citable link
http://hdl.handle.net/1721.1/103811
Terms of Use
Article is made available in accordance with the publisher's
policy and may be subject to US copyright law. Please refer to the
publisher's site for terms of use.
1
A Data-Driven Approach to Optimized Medication Dosing: A Focus on Heparin Authors:
Mohammad M. Ghassemi1, MPhil, <[email protected]> Stefan E. Richter2, MD, <[email protected]> Ifeoma M. Eche3, PharmD, <[email protected]> Tszyi W. Chen3, PharmD, <[email protected]> John Danziger3*, MD, <[email protected]> Leo A. Celi1,3*, MD, <[email protected]>
Affiliations:
1. Massachusetts Institute of Technology, Cambridge, MA 2. University of California Los Angeles, Los Angeles, CA 3. Beth Israel Deaconess Medical Center, Boston, MA
* Please note that LAC and JD should be considered co-senior authors
Corresponding Author:
Mohammad Mahdi Ghassemi, <[email protected]> Laboratory for Computational Physiology
MIT, E25-505
77 Massachusetts Ave. Cambridge, MA 02139 Phone: (617) 253-0378 Fax: (617) 253-7818
Conflict of Interest Statement: The authors declare that they have no conflict of interest. None of
the authors involved in this study have associations (intellectual, financial, or otherwise) that would affect, or be perceived to affect the author's research conduct or judgment.
2
Abstract
Purpose: To demonstrate a novel method that utilizes retrospective data to develop statistically
optimal dosing strategies for medications with sensitive therapeutic windows. We illustrate our approach on intravenous unfractionated heparin, a medication which typically considers only patient weight and is frequently misdosed.
Methods: We identified available clinical features which impact patient response to heparin and
extracted 1511 patients from the Multi-parameter Intelligent Monitoring in Intensive Care II database which met our inclusion criteria. These were used to develop two multivariate logistic regressions, modeling sub- and supra-therapeutic activated partial thromboplastin time (aPTT) as a function of clinical features. We combined information from these models to estimate an initial heparin dose that would, on a per-patient basis, maximize the probability of a therapeutic aPTT within 4-8 hours of the initial infusion. We tested our model's ability to classifying therapeutic outcomes on a withheld dataset and compared performance to a weight-alone alternative using VUS (a multiclass version of AUC).
Results: We observed statistically significant associations between sub- and supra-therapeutic
aPTT, race, ICU type, gender, heparin dose, age and Sequential Organ Failure Assessment scores with mean validation AUC of 0.78 and 0.79 respectively. Our final model improved outcome classification over the weight-alone alternative, with VUS values of 0.48 versus 0.42.
Conclusions: This work represents an important step in the secondary use of health data in developing
models to optimize drug dosing. The next step would be evaluating whether this approach indeed achieves target aPTT more reliably than the current weight-based heparin dosing in a randomized controlled trial.
3
Key words
Observational, Heparin, Clinical Informatics, Dosing, Optimization
Introduction
Retrospective data provides a valuable opportunity to investigate clinical practice when clinical trials are either unavailable, violate ethical boundaries for provision of best care, or are too costly to effectively evaluate treatment effect heterogeneity across patient subsets and clinical contexts [1]. Heparin is one example of a medication where retrospective data provides valuable insight as clinical trials must exclude patients who exhibit a high propensity for bleeding or severe complications caused by bleeding [2].
The current dosing guidelines for unfractionated heparin (UFH) are weight-based, and arose from a 1993 randomized control trial which showed that accounting for weight led to therapeutic anticoagulation more rapidly than a standard care nomogram [3]. Given the risks of misdosing UFH, we believe that weight-based heparin dosing alone is sub-optimal and may place patients at unnecessary risk in the formative hours of their hospital stay. In this paper we propose a potential solution to this issue by applying a novel perturbation of multinomial logistic regression, designed to probabilistically estimate an optimal heparin dose as a function of known feature values, and a specified therapeutic range. We chose heparin as a candidate drug given its widespread use, clinical relevance, and inconsistency in dosing practices across institutions but would like to stress that the technique is applicable to any drug with an arbitrary therapeutic window.
Selecting the correct initial bolus and infusion rates for UFH are necessary to ensure that anticoagulation, which is commonly measured by activated partial thromboplastin time (aPTT), reaches a therapeutic window in a timely manner. Many clinicians consider a therapeutic aPTT range to be 1.5-2.5 times the control value, however there remains significant controversy surrounding the optimal heparin dosing range [4-7]. The current guidelines for UFH dosing at Boston's Beth Israel Medical Center (BIDMC) prescribes an 80 (UI/kg*hr) bolus followed by 18
4 (UI/kg*hr) continuous IV infusion, with lower infusion rates recommended for some indications. Guidelines also dictate checking aPTT 6 hours after the initial infusion of UFH, followed by continuous dose adjustments as required to achieve a therapeutic aPTT within 24 hours (See Appendix, Section 6 in supplement materials for the complete BIDMC guidelines).
It is desirable to avoid supra-therapeutic aPTT at 6 hours after UFH infusion, as it has been associated with increased bleeding, with further worse outcomes for supra-therapeutic aPTT at 12 hours [8]. While the relationship between initial heparin dose, efficacy, and safety has been well described in the literature,the risk factors for sub- and supra-therapeutic aPTT response to the use of UFH is less well understood [9].To the best of our knowledge, the only recognized risk factors for supra-therapeutic aPTT are higher weight-normalized initial rate of heparin infusion, older age, and female gender [8,10]. Renal impairment inhibits excretion of heparin at higher doses, but this has not been correlated with aPTT and is not considered cause to adjust heparin dosing [11].
Materials and Methods
Study Population
Data for this study was extracted from the publicly available Multi-parameter Intelligent Monitoring in Intensive Care database (MIMIC-II) [12]. All data were extracted from the database using the SQL programming language. We extracted a total of 4779 unique adult individuals from the MIMIC-II database by selecting all patients who received heparin during their ICU stay. We included only those patients with aPTT measurements 4-8 hours after the initial infusion. This reduced the cohort size to 2873. We further removed any subjects with missing values for the covariates, reducing the cohort size to 2125. Lastly, we removed any patients that were transferred from another hospital, leaving the final cohort size at 1511. Transfer patients were removed as the heparin might have been started prior to ICU admission. Transfer patients were removed as we had no access to medical procedures that were performed on the population at other institutions.
5 The amount of time patients spent in the therapeutic range was studied by extracting aPTT at approximately 6 (4-8 hours), 12 (9-20 hours), and 24 (21-32) hours after initiation of therapy. We empirically identified the time ranges in which the intended 6, 12, and 24 hour aPTT measures actually occurred. For the 6 hour window this was accomplished by selecting the time frame where, across all patients, the greatest proportion of first aPTT measurements occurred. Similarly, for the 12 hour window, we selected the time frame where, across all patients, the greatest proportions of measures were the second measure for the patient population. The 24 hour window was identified in a similar way.
Study Covariates and Outcome
The outcome of interest was aPTT 4-8 hours after the initial heparin infusion. We defined the therapeutic range as an aPTT between 60-100 seconds (with values above this range considered supra-therapeutic, and values below considered sub-therapeutic). In this study we utilized data from the Beth Isreal Deaconess Medical Center, and as such used their definition of therapeutic aPTT when developing our predicative models. This is not to imply that the guidelines provided by the BIDMC are more effective than those of other institutions but rather, will serve to illustrate how our techniques may be used to estimate a dose which is more likely to produce an outcome aligned with the institution's specific definition of therapeutic. (See the Appendix, Section 6 )),
Measurements of both renal and hepatic function were included as features of interest. A binary variable was created for liver injury, which was coded as positive in patients with either aspartate aminotransferase (AST) or alanine transaminase (ALT) greater than five times the upper limit of normal. Other covariates included the weight-normalized heparin dose, the time between heparin infusion and the first aPTT measurement (measure time), patient age, gender, ethnicity (coded as white vs. nonwhite), the Elixhauser comorbidity index (an indicator of chronic illness), [13,14] ICU care unit type (medical vs. surgical) and the Sequential Organ Failure Assessment score (SOFA) measure closest to the time of heparin initiation. Due to limitations in the data source, we were unable to obtain information on heparin boluses for the vast majority of our patients;,the feature
6 was not included in our main analysis. Instead, we performed a subset analysis on the patients which had heparin bolus information and discuss these results separately. Additionally, We were unable to reliably determine the indication for heparin in a significant fraction of the study cohort. For this reason, we left the indication for therapeutic UFH out of the primary model and opted for ICU Type as a proxy. We also performed a subset analysis, selecting the heparin indication from ICD9 code when possible. Lastly We evaluated interaction terms but none significantly improved the performance of the models – see Section 3 of the Appendix for more details.
Guideline Development
Multivariate logistic regression can be understood as providing a probability of some outcome given a set of static feature values. The underlying linear assumption is ill-suited to directly model phenomenon such as therapeutic aPTT, whose probability is a not a monotonic function of the input features. However, sub-therapeutic and supra-therapeutic aPTT can be thought of as monotonically dependent on the input features (the higher the dose, the higher the probability of supra-therapeutic and vice-versa). As patients can only take on one of three possible therapeutic states, it follows that we can construct the probability of therapeutic aPTT quite simply as:
P(therapeutic) = 1 [P(supra-therapeutic) + P(sub-therapeutic)] (1)
Where P(supra-therapeutic) is the multivariate logistic regression model for supra-therapeutic aPTT, and P(sub-therapeutic) is the multivariate logistic regression model for sub-therapeutic aPTT. To generate guidelines of the form in (1), we performed two independent multivariate logistic regressions, using the same features, with sub-therapeutic aPTT and supra-therapeutic aPTT as the outcomes of interest. We then combined these models to generate a model which describes the probability of all three therapeutic states of a patient as a function of initial dose, and other features.
Model Analysis and Validation
7 cross validation to predict outcomes on a withheld test set given a known training set. We reported the mean AUC and standard deviation from this validation in addition to the results of a Hosmer -Lemeshow test. To test our model's capabilities as a classifier of three distinct therapeutic states, we computed the Volume Under Surface (VUS) measure [15]. The VUS measure is similar to AUC, with the difference being that it may be used to quantify the performance of a classifier with more than two outcomes. We compared the VUS of our model to a weight-based model to gauge our method's improvement in classification performance. Lastly, we checked the statistical significance of the improvement in our model's predictive performance versus the weight-based approach using a likelihood-ratio test. All statistical analyses were performed using MATLAB Version R2013a.
Alternative Models:
To validate our approach's performance compared to standard forms of multinomial, and ordinal logistic regression, we performed several validation experiments, which can also be found in the Appendix, Sections 1 and 2. In addition to the logistic regression based methods, we attempted several other forms of machine learning algorithms as a means of validating our approach. Specifically, we compared our approach against a single and double layer neural network, two ensemble learning based approaches, and a multiclass support vector machine. In each case, the methods were allowed to train and validate on 70% of the data, and tested on the remaining 30%. We found that the more advanced methods did not perform as well on the testing portion of the classification task as our proposed approach – see Section 4 of the Appendix for full details.
Results
Main Analysis
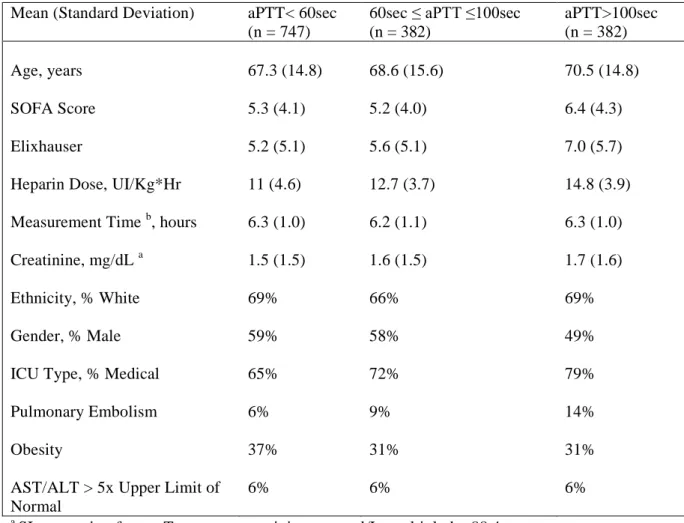
A total of 4779 unique adult individuals from the MIMIC-II database who received IV UFH during their ICU stay were identified. Patients who were transferred from another hospital or missing a full set of feature data were excluded, leaving the final cohort size at 1511. Summary information on our
8 patient population is shown in Table 1.
The trends in our cohort's aPTT from heparin onset to approximately 24 hours after infusion are illustrated in Figure 1. The proportion of patients with supra-therapeutic aPTT decreased over time, from over a quarter of all patients at approximately 6 hours after infusion to roughly 5% by approximately 24 hours.
In Figure 2 we show the distribution of initial heparin doses provided to our cohort as well as their aPTT values classified by therapeutic range. The figure illustrates two important points: (1) a large number of patients received heparin dosing outside the amount recommended in the guidelines from the institution, and (2) heparin misdosing is frequent even when the dosing is at guideline levels. Table 2 provides the results of the multivariate logistic regression model for the risk of a supra- and sub-therapeutic aPTT Combining our logistic regression models as shown in equation (1), the probability of sub-therapeutic, supra-therapeutic, and therapeutic aPTT as a function of initial dose for two example patients was plotted and shown in Figure 3. In comparing these models we found a VUS of 0.48 for our model versus 0.42 for the weight-based approach. While the increase in performance is modest, it is statistically significant according to the likelihood-ratio test (p < 0.01).
Bolus Subset
Of our original cohort, only 485 patients had data available on their initial heparin bolus. After removing transfer patients, we were left with 353 patients who met the inclusion criteria for a subgroup analysis. For this subgroup, a weight-normalized bolus term was not found to be statistically relevant (See Table A-10 of the Appendix). This suggests that our analysis is sound despite the lack of information on heparin bolus. Comparison of the patients who did and did not have data for heparin boluses is given in Table A-12 of the Appendix.
Heparin Indication Subset
We did not have sufficient information captured in the database to determine the exact indication for anticoagulation in this population of patients. For patients in which the indication was easily inferred
9 from ICD9 Codes, the distribution of therapeutic outcomes (goal aPTT range set by BIDMC guidelines) vs. initial heparin dose is shown by indication in Figures 7 through 10. Information regarding the primary diagnosis for enrolled patients is summarized in the Appendix, Tables A-13 and A-14. When models were constructed using primary indication for heparin therapy as a covariate, the AUC increased in each case by <0.02. This analysis is shown in the Appendix, in Table A-15.
Discussion
The results of Figure 2 illustrate a surprisingly large variation in the initial dosing of UFH at the Beth Israel Medical Center. Of note, even when the guidelines are being followed, the variance in aPTT response remains large. This suggests that the wide variation in the initial aPTT results from both inter-provider practice variability and patient factors. This variance might be the result of clinicians dosing UFH according to known or presumed risk factors, despite the guidelines at their institution. An Austrian survey in 2010 also showed relatively lax adherence to dosing of enoxaparin for thromboprophylaxis in ICU practice [16].
As shown in Table 2, all of our chosen variables except the Elixhauser score, creatinine, liver function, and measurement time exhibited statistically significant relationships (p < 0.05) with the first measured aPTT. These results are consistent with what has been observed in the limited literature available. A 2008 study using data from 31,445 high risk patients across 420 hospitals determined that increased age and female sex were associated with elevated aPTT when using UFH, but that this effect was driven primarily by higher initial dosing relative to weight [10].
Figure 3 shows how two patients evaluated using our model exhibit distinctive probabilities of over-, under-, and therapeutic-dosing profiles. Figure 4 compares our model versus a weight-alone alternative. Our full-featured model recommends an initial UFH dose which will, for the same patient, provide a 5-10% increase in the probability of a therapeutic aPTT at six hours. Given the frequency with which patients are treated with UFH drips, an improvement on this order of magnitude would result in enhanced safety for a substantial number of patients. Since the covariates of our analysis are
10 commonly measured in an ICU setting, a clinician could employ our method to predict the risk for a supra- or sub-therapeutic aPTT for any given patient in real time, and dose a UFH drip accordingly following from Equation 1. Additionally, since the actual target aPTT range can be arbitrarily specified in the model to follow institution specific guidelines, it can be used to adjust initial heparin dosing to any desired therapeutic range. For instance, the goal aPTT for acute coronary syndromes at The Beth Israel Deaconess Medical Center is 50-80 (see Section 6 of the Appendix); our model is capable of targeting this or other ranges (driven by physician preference) with only very minor adjustments.
While our model's VUS exhibited modest (albeit significant) gains over a weight based approach, we feel that our work is a good starting point for the development of more effective heparin dosing guidelines and the approach would be strengthened as clinical databases continue to grow in size. The models require validation on other ICU datasets. This approach should also be evaluated in a randomized controlled trial.
The simplicity of this approach makes it relatively easy to embed in a website as an online calculator. The model would require input of some fairly standard variables about a patient (age, ethnicity, gender, ICU type, and SOFA score) to dynamically generate the probability of reaching, overshooting, or undershooting a target range at six hours. With such a tool, a physician could choose an aPTT target range based on expected or tolerated risk of bleeding, and see the risk of over- or undershooting in real time for any initial heparin drip rate.
Despite the encouraging results, our study has several limitations. Firstly, information concerning the initial heparin bolus for our patients was incomplete; only 353 of the patients in the cohort had bolus information available. In this sub-population, the amount of the weight-adjusted bolus did not have a significant impact on aPTT at 6 hours. One potential explanation for this is that information about the heparin bolus is correlated with – and therefore contained within – the infusion rate for the heparin drip. That is, a higher infusion rate is associated with a higher heparin bolus, and vice versa. We do
11 not consider the lack of information about a heparin bolus a significant flaw in our study design, but it does preclude us from making conclusions about the impact of heparin bolus on aPTT at six hours.
In table A-14 we observe that 21.3% of patients had acute coronary syndromes as their primary diagnosis, followed by 12.8% with venous or arterial thrombosis (not in the brain or heart), 5% with primary valve disorders, 3.4% with ischemic strokes. and 1.6% of patients with atrial fibrillation. More than half (55.7%) had a primary diagnosis that does not require anticoagulation. In the subgroups for which information regarding primary indication was available, an indication of acute coronary syndrome or valvular disorder was associated with a higher probability of sub-therapeutic dosing and a lower probability of supra-therapeutic dosing. An indication of arterial or venous thrombosis was associated with a higher probability of supra-therapeutic dosing, with no change to the probability of sub-therapeutic dosing. The absence of this information is a real limitation of our results, and should be addressed as other groups build on our work using more complete databases.
One additional weakness of our study is that the incidence of bleeding was available for our population. It is quite possible that the risk of bleeding for any given patient is more strongly influenced by individual patient factors than by aPTT. However, given that the risk for bleeding is known to increase with increasing aPTT and that a sub-therapeutic aPTT indicates ineffective therapy, it is certainly more desirable to have an aPTT in the therapeutic range from a safety standpoint. The same applies for thrombosis or thrombosis recurrence.
Another limitation of this work is that the BIDMC heparin protocol was implemented in approximately 2002 (with uneven rollout throughout the hospital); some of the data included in the MIMIC-II database are from prior to the implementation of the guidelines. Due to the nature of our dataset (dates have been shifted for de-identification), we cannot identify which patients were treated based on the BIDMC weight-based protocol vs. physician-determined dose, since physicians were allowed to modify the dose at will, based on their assessment of the patient’s bleeding risk. However, the guideline used does not impact the construction or applicability of the model. The model is built
12 using weight-normalized heparin dose, regardless of whether or not a guideline was followed. The aPTT range targeted at BIDMC may be different from those at other institutions (in some cases substantially so), but since the model predicts a probability distribution of aPTT category, the upper and lower bounds of the therapeutic range can be arbitrarily specified.
Lastly, the data in this study were collected retrospectively and as such were limited to what had been recorded on patients at the time. Further refinements could be made to the model by collecting information on levels of heparin-binding proteins and other substances affecting heparin activity, as well as the size of heparin boluses given with the heparin drips. There remains the distinct possibility that aPTT is in fact immaterial to patient outcomes. Should a superior method to monitor the effect of heparin emerge, the approach described in the paper can be applied using that measurement as the outcome. In future prospective studies, it would be useful to include information on anti-Xa levels and bleeding/thrombotic outcomes in patients to allow comparison against aPTT and potentially help specify more clinically relevant endpoints [17].
Having clearly outlined these limitations, we feel that our work is valid and demonstrates that it is possible to improve on current weight-based heparin dosing practice using a data-driven approach. As more of these variables (such as anti-Xa activity and protein levels) move into clinical practice and the data become available, the ability to predict aPTT on the basis of available data will likely improve as well.
Conclusion
A central aim of this study was to create an approach that would help clinicians determine the optimal initial dose of a drug to safely and quickly reach a therapeutic aPTT window. One serious disadvantage of heparin risk factor analyses based on clinical trials alone is that they exclude patients who exhibit a high propensity for bleeding or severe complications caused by bleeding [2]. Retrospective analyses like ours are able to overcome this issue by utilizing clinical data that is reflective of the entire population actually receiving treatment.
13 The model we developed allows clinicians to determine the initial dose which would maximize the probability of a therapeutic aPTT by plotting P(Therapeutic) versus a viable range of dose values. This approach utilizes modeling techniques which are common in medical research, and could be easily replicated for other medications. Indeed, the applicability of the approach we described in this paper is not limited to heparin dosing, or to the ICU setting. Given any large, comprehensive data set, it is possible to use a combination of logistic regression curves to model the risks for over- or under-dosing in which either or both of these poses a significant risk. Potential applications include the use of any medication with a measured range of therapeutic blood levels (antibiotics such as vancomycin or aminoglycosides, antiepileptics such as valproic acid, post-transplant immunosuppressants such as tacrolimus, etc.), or medications that are titrated to effect (such as antihypertensives and insulin). Similar health informatics [18] techniques have already been used to improve interpretation of pulmonary artery catheter data [19] and quality of glycemic control algorithms [20]. As large datasets become more broadly available in multiple hospital systems, it will be possible to create institution- or patient population-specific prediction tools that can be used in real time to guide decisions regarding initial dosing. By reducing the time required to reach therapeutic range, patients will have reduced exposure to morbidity risk associated with over or under-dosing.
Acknowledgments
Sources of Support:
Grant R01 EB001659 from the National Institute of Biomedical Imaging and Bioengineering
(NIBIB) of the National Institutes of Health (NIH).
Guarantor:
Mohammad Ghassemi lead the analysis and design of this study and takes full responsibility for the integrity of the data, accuracy of the analysis, and implications of the results.
Author Contributions:
14 Analysis and interpretation: MMG, SER, LAC
Drafting the manuscript for important intellectual content: MMG, SER, LAC
Ethical Standards Statement:
All data used for this study was de-identified and publically accessible. Hence, it did not require an IRB for the purposes of investigation.
Financial / Non-financial Disclosures:
None of the authors involved in this study have associations (intellectual, financial, or otherwise) that would affect, or be perceived to affect the author's research conduct or judgment.
Role of the Sponsors:
The sponsors of this research played no role in the research process of this work beyond their important financial contribution.
Conflict of Interest Statement:
The authors declare that they have no conflict of interest. None of the authors involved in this study have associations (intellectual, financial, or otherwise) that would affect, or be perceived to affect the author's research conduct or judgment.
References
1. Celi LA, Mark RG, Stone DJ, Montgomerey RA (2013) Big Data" in the Intensive Care Unit.
Closing the Data Loop. Am J Resp Crit Care Med 187(11):1157-1160.
2. Alban S. (2012) Adverse effects of heparin. In: Lever R, Mulloy B, Page CP (eds) Heparin – A
Century of Progress. Berlin, Germany: Springer Berlin-Heidelberg pp 211-263.
3. Raschke RA, Reilly BM, Guidry JR, Fontana JR, Srinivas S (1993) The weight-based heparin
dosing nomogram compared with a standard care nomogram: A randomized controlled trial. Ann Int Med 119(9):874-881.
4. Hirsh J, Raschke R (2004) Heparin and low-molecular-weight heparin - the seventh ACCP
15
5. Cruickshank MK, Levine MN, Hirsh J, Roberts R, Siguenza M (1991) A standard heparin
nomogram for the management of heparin therapy. Arch Intern Med 151(2): 333-337.
6. Hirsh, Jack, et al (2001) Guide to anticoagulant therapy: Heparin a statement for healthcare
professionals from the American Heart Association. Circulation 103.24:2994-3018.
7. Krishnaswamy, Amar, A. Michael Lincoff, and Christopher P. Cannon (2010) The use and
limitations of unfractionated heparin. Crit Pathw Cardiol 9.1:35-40.
8. Lee MS, Wali AU, Menon V, et al (2001) The determinants of activated partial thromboplastin
time, relation of activated partial thromboplastin time to clinical outcomes, and optimal dosing regimens for heparin treated patients with acute coronary syndromes: a review of gusto-IIb. J Thromb Thrombolysis 14(2): 91-101.
9. Raschke RA, Gollihare B, Peirce JC (1996) The effectiveness of implementing the weight-based
heparin nomogram as a practice guideline. Arch Intern Med 156(15):1645-1649.
10. Melloni C, Alexander KP, Chen AY, et al (2008) Unfractionated heparin dosing and risk of
major bleeding in non-ST-segment elevation acute coronary syndromes. Am Heart J 156(2):209-215.
11. Grand'Maison A, Charest AF, Geerts WH (2005). Anticoagulant use in patients with chronic
renal impairment. Am J Cardiovasc Drugs 5(5):291-305.
12. Saeed M, Villarroel M, Reisner AT, et al (2011) Multiparameter intelligent monitoring in
intensive care II (MIMIC-II): A public-access intensive care unit database. Crit Care Med 39(5): 952-960.
16
13. Elixhauser A, Steiner C, Harris DR, Cofey RM (1998) Comorbidity measures for use with
administrative data. Med Care. 36(1):8-27.
14. van Walraven C, Austin PC, Jennings A, Quan H, Forster AJ (2009) A modification of the
Elixhauser comorbidity measures into a point system for hospital death using administrative data. Med Care 47(6): 626-633.
15. César F, Hernández-Orallo J, and Salido MA (2003) Volume under the ROC Surface for
Multi-class Problems. Machine Learning: ECML 2003. Springer Berlin Heidelberg 108-120.
16. Schaden E, Metnitz PG, Pfanner et al (2012) Coagulation Day 2010: an Austrian survey on the
routine of thromboprophylaxis in intensive care. Intens Care Med 38:984-990.
17. Guervil, David J., et al (2011) Activated partial thromboplastin time versus antifactor Xa heparin
assay in monitoring unfractionated heparin by continuous intravenous infusion. Ann Pharmacother 45.7-8:861-868.
18. Imhoff M, Webb A, Goldschmidt A (2001) Health Informatics. Intens Care Med 27:179-186.
19. Squara P, Foruquet E, Jacquet L, et al. (2003) A computer program for interpreting pulmonary
artery catheterization data: results of the European HEMODYN Resident Study. Intens Care Med 29:735-741.
20. Meyfroidt G, Wouters P, De Becker W, Cottem D, Ven den Berghe G (2011) Impact of a
computer-generated alert system on the quality of tight glycemic control. Intens Care Med 37:1151-1157.
17
Tables
Table 1: Summary statistics of selected features for the study cohort partitioned according to the
partial thromboplastin time (aPTT) categories approximately 6 hours after the initial infusion of heparin.
Mean (Standard Deviation) aPTT< 60sec (n = 747)
60sec ≤ aPTT ≤100sec (n = 382) aPTT>100sec (n = 382) Age, years 67.3 (14.8) 68.6 (15.6) 70.5 (14.8) SOFA Score 5.3 (4.1) 5.2 (4.0) 6.4 (4.3) Elixhauser 5.2 (5.1) 5.6 (5.1) 7.0 (5.7)
Heparin Dose, UI/Kg*Hr 11 (4.6) 12.7 (3.7) 14.8 (3.9)
Measurement Time b, hours 6.3 (1.0) 6.2 (1.1) 6.3 (1.0)
Creatinine, mg/dL a 1.5 (1.5) 1.6 (1.5) 1.7 (1.6)
Ethnicity, % White 69% 66% 69%
Gender, % Male 59% 58% 49%
ICU Type, % Medical 65% 72% 79%
Pulmonary Embolism 6% 9% 14%
Obesity 37% 31% 31%
AST/ALT > 5x Upper Limit of Normal
6% 6% 6%
a
SI conversion factor: To convert creatinine to mol/L, multiply by 88.4 b
18
Table 2: Results of a logistic regression for modeling supra-therapeutic (Table 2a) and
sub-therapeutic (Table 2b) aPTT 6 hours after the initial dosing of heparin. 2a
Validation AUC Mean (Standard Deviation) = 0.79(0.02) HL test p-value = 0.118 Odds Ratio 95% Confidence Interval (Lower/Upper) p-value Age (Years) 1.01 1.01/1.02 < 0.01 SOFA Score 1.09 1.05/1.13 < 0.01 Elixhauser 1.01 0.99/1.03 0.42
Heparin Dose, UI/Kg*Hr 1.27 1.23/1.32 < 0.01
Measurement Time b ,hours 0.99 0.87/1.12 0.86
Creatinine mg/dLa 0.98 0.89/1.07 0.64
Ethnicity, White 0.56 0.40/0.79 < 0.01
Gender, Male 0.60 0.46/0.78 < 0.01
ICU Type, Medical 1.60 1.17/2.17 < 0.01
AST/ALT > 5x Upper Limit of Normal 1.28 0.72/2.29 0.40
2b
Validation AUC Mean (Standard Deviation) = 0.78(0.03) HL test p-value = 0.158 Odds Ratio 95% Confidence Interval (Lower/Upper) p-value Age 0.98 0.97/0.99 < 0.01 SOFA Score 0.96 0.94/1.00 0.02 Elixhauser 1.01 0.99/1.03 0.56
Heparin Dose, UI/Kg*Hr 0.79 0.77/0.82 < 0.01
Measurement Time† 1.04 0.93/1.16 0.49
Creatinine mg/dL* 1.01 0.93/1.10 0.83
Ethnicity, White 1.64 1.20/2.23 < 0.01
Gender, Male 1.44 1.13/1.82 < 0.01
ICU Type, Medical 0.62 0.48/0.79 < 0.01
AST/ALT > 5x Upper Limit of Normal
0.77 0.46/1.29 0.33
a
SI conversion factor: To convert creatinine to mol/L, multiply by 88.4 b
19
Fig. 2The distribution of our cohort's partial thromboplastin time (aPTT) measures approximately 6
hours after initial dosing as a function of the initial, weight-based heparin dose.
Fig. 3Logistic probability models of sub-therapeutic, supra-therapeutic, and therapeutic dosing as a
function of initial dose for two distinct patients. The dashed lines represent the response of a 40 year old, non-white, female, in the SICU with a SOFA score of 13. The solid lines represent a 20 year old, white, male subject in the SICU with a SOFA score of 5.
Fig. 4A depiction of the logistic probability models of sub-therapeutic, supra-therapeutic, and
therapeutic dosing as a function of initial dose for a 20 year old, white, male subject in the SICU with a SOFA score of 5 compared to the recommendations from a weight-alone based model.